Guest post by David Middleton
When the observations don’t match the models, adjust the observations…
Satellite snafu masked true sea-level rise for decades
Revised tallies confirm that the rate of sea-level rise is accelerating as the Earth warms and ice sheets thaw.
Jeff Tollefson
17 July 2017
The numbers didn’t add up. Even as Earth grew warmer and glaciers and ice sheets thawed, decades of satellite data seemed to show that the rate of sea-level rise was holding steady — or even declining.
Now, after puzzling over this discrepancy for years, scientists have identified its source: a problem with the calibration of a sensor on the first of several satellites launched to measure the height of the sea surface using radar. Adjusting the data to remove that error suggests that sea levels are indeed rising at faster rates each year.
“The rate of sea-level rise is increasing, and that increase is basically what we expected,” says Steven Nerem, a remote-sensing expert at the University of Colorado Boulder who is leading the reanalysis. He presented the as-yet-unpublished analysis on 13 July in New York City at a conference sponsored by the World Climate Research Programme and the International Oceanographic Commission, among others.
Nerem’s team calculated that the rate of sea-level rise increased from around 1.8 millimetres per year in 1993 to roughly 3.9 millimetres per year today as a result of global warming. In addition to the satellite calibration error, his analysis also takes into account other factors that have influenced sea-level rise in the last several decades, such as the eruption of Mount Pinatubo in the Philippines in 1991 and the recent El Niño weather pattern.
The view from above
The results align with three recent studies that have raised questions about the earliest observations of sea-surface height, or altimetry, captured by the TOPEX/Poseidon spacecraft, a joint US–French mission that began collecting data in late 1992. Those measurements continued with the launch of three subsequent satellites.
“Whatever the methodology, we all come up with the same conclusions,” says Anny Cazenave, a geophysicist at the Laboratory for Studies in Space Geophysics and Oceanography (LEGOS) in Toulouse, France.
[…]
“As records get longer, questions come up,” says Gavin Schmidt, a climate scientist who heads NASA’s Goddard Institute for Space Studies in New York City. But the recent spate of studies suggests that scientists have homed in on an answer, he says. “It’s all coming together.”
If sea-level rise continues to accelerate at the current rate, Nerem says, the world’s oceans could rise by about 75 centimetres over the next century. That is in line with projections made by the Intergovernmental Panel on Climate Change in 2013.
“All of this gives us much more confidence that we understand what is happening,” Church says, and the message to policymakers is clear enough. Humanity needs to reduce its output of greenhouse-gas emissions, he says — and quickly. ”The decisions we make now will have impacts for hundreds, and perhaps thousands, of years.”
- Nature
- doi:10.1038/nature.2017.22312
So… They accomplished accelerated sea level rise by slowing down the past…
Of course, Bill Cosby invented the word “riiiiight” in a sketch about accelerated sea level rise…
Oddly enough, Dr. Nerem and company predicted that they would soon detect the irascible acceleration in sea level rise. So, I guess the soon-to-be-detected acceleration will be tacked on the the adjusted acceleration and Bill Cosby will probably not get credit for the inundation of our coastlines when they are submerged under 7.5 meters of adjusted sea levels.
Until then, sea level rise looks just as tame as it ever did…

Featured Image: Cartoons by Josh

Sea level rise looks even less scary if one examines tide gauges in places like Honolulu, without radical subsidence. Of course, considering that the chain of seamounts and islands that Hawaii is part of is subsiding almost certainly, that data set overstates “actual” sea level rise.
They should re-apply this to land heights as well. I wonder if the planet is expanding at a rate of a few mm per year …
Ooh – that is just wicked! And also spot on target.
I thought the planet would be shrinking as part of it’s cooling, and all the earthquakes and changes in topography throughout history were just the skin wrinkling as the planet shrunk.
Ian H
Sorry, I asked Annie Cazenave about earth expansion some years ago. She had found no evidence for it. Geoff
The expanding earth hypothesis has been around in various forms for many decades. A strong proponent (of how to test it plus difficulties it could solve), was Prof S Warren Carey, geologist, from Australia. It was a privilege to spend many hours solving the expanding earth puzzles with Sam, who stuck to the ideas to his 2002 death.
Obviously, earth expansion has to be settled before satellite distancing methods can be adopted. Some years ago I emailed Anny Cazenave, who recommended a 2011 paper BT X. Wu et al, who put error bounds around their estimate of the constancy of earth size. Radius change below 0.1 +/- 0.2 mm per year. Paper is at GRL 38 (2011).
It would be interesting to know if this remains the accepted figure.
BTW, those who enjoy scientific examples of challenging the Establishment with thinking outside the comfort zone, Carey’s story is fascinating. Among other acts, he declined membership of the Australian Academy of Science, a serious act from a time when Learned Societies mattered.
Geoff
NASA article about GRL paper…
https://www.nasa.gov/topics/earth/features/earth20110816.html
The notion of an expanding Earth is not as wacky as Velikovsky or Hapgood, it just isn’t supported by most of the observations.
Apart from the deposition of material from outer space, it’s difficult to think of a mechanism for expansion.
Geoff,
I was thinking more along the lines that the ‘recalibration’ that increased the ocean height ‘trend’ would have also made the land seem like it was getting higher too. The question I have is why didn’t they notice the Earth diameter was shrinking before they ‘fixed’ the data, or did the ‘fix’ only apply to the oceans.
Very perspicacious of you. There must be data for that, I wonder where it is.
Colerado U. have been manipulating altimetry data for at least a decade. It has no scientific value.
They only now provide it with “inverse barometer” adjustment ( which is meaning less on a global scale ) and with GAIA correction to account for hypothetical deepening of the oceans. This is meaningless is you are supposed to be worried about flooding, which is the scare story they are pushing.
It’s all hype and BS.
They’ve also fiddled the Poisidon data before and then disappeared the previous version to prevent comparison and validation.
This is not science.
Geoff,
Was this before or after the latest ‘adjustments’?
Global geostationary tide guages do NOT show any SL acceleration.
Indeed, apparently we are to believe that it’s all piling up in the middle of the oceans where we can not measure it by other means than their rigged satellite extractions.
Last time I checked Hawaii was in the middle of a very large ocean:
https://tidesandcurrents.noaa.gov/sltrends/sltrends_station.shtml?stnid=1612340
Greg -“Colorado U. have been manipulating altimetry data for at least a decade.” 1998 so 20 years and called out in 2005, 12 years ago.
There Is No Alarming Sea Level Rise! by Nils-Axel Mörner
the El Niño/La Niña-Southern Oscillation, a quasi-periodic climate pattern that occurs across the tropical Pacific Ocean every few years.) Therefore, a much more realistic approach is to treat that ENSO-signal as a separate event, superimposed on the long-term trend, as shown in Figure 6 (Mörner 2004). Figure 6 shows a variability (of ±10 mm) around a stable zero level (blue line) and a strong ENSO-event (yellow lines) in 1997. The trend thereafter is less clear (gray lines). This graph provides no indication of any rise over the time-period covered (Mörner 2004, 2007a, 2007c).
When the satellite altimetry group realized that the 1997 rise was an ENSO signal, and they extended the trend up to 2003, they seemed to have faced a problem: There was no sea level
rise visible, and therefore a “reinterpretation” needed to be undertaken.
Originally, it seemed that this extra, unspecified “correction” referred to the global isostatic adjustment (GIA) given as 2.4 mm/year (see, for example, Peltier 1998) or 1.8 mm/year (IPCC 2001). The zero isobase of GIA according to Peltier (1998) passed through Hong Kong, where one tide-gauge gives a relative sea level rise of 2.3 mm/year. This is exactly the value appearing in Figure 7. This tide-gauge record is contradicted by the four other records existing in Hong Kong, and obviously represents a site specific subsidence, a fact well known to local geologists.
Nevertheless, a new calibration factor has been introduced in the Figure 7 graph. At the Moscow global warming meeting in 2005, in answer to my criticisms about this “correction,” one
of the persons in the British IPCC delegation said, “We had to do so, otherwise there would not be any trend.” To this I replied: “Did you hear what you were saying? This is just what I am accusing you of doing.”
http://www.21stcenturysciencetech.com/Articles_2011/Winter-2010/Morner.pdf
“Sea level rise looks even less scary if one examines tide gauges in places like Honolulu, without radical subsidence. Of course, considering that the chain of seamounts and islands that Hawaii is part of is subsiding almost certainly, that data set overstates “actual” sea level rise.”
While looking at Hawaii, also have a look at all of the islands and atolls in the middle of the Pacific ocean.
I have been raising this point about the Pacific islands in every comment thread on the topic of sea level for years…no one seems to notice, and some even disagree that this is the place to look for what the actual ocean is doing away from large land masses.
It does not get any more middle-of-the-oceanish than the Central Pacific.
So, if there is some TOPEX bulge out there, should we not see it here?
No bulge.
Some of those islands show virtually the same sea level since measurements began.
Many are discontinuous, or do not go back as far as ones in the US, so I think they maybe get left out of the analysis.
I know one thing…anyone who is living their life any differently or losing a minute of sleep because they think the ocean is coming to get us, should not.
Go ahead and adjust the satellite readings.
Still does not negate the linear (non-accelerating) tide gauges around the world.
[Man(n), you just can’t trust these scientists with data, they keep adjusting and adjusting, and the present is always adjusted hotter, and the past colder.
Another check on SLR is the LOD (length of day).
As ice melts, and redistributes to a bulge around the equator, it should slow the earths rotation.
Does anyone monitor this?
Yes. Astronomers do it every day when they point their telescopes. If the length of day changes the stars won’t be where they are supposed to be. Unfortunately they keep showing up where they are supposed to be. This is known as “Munk’s enigma” and is never mentioned in polite society:
http://www.pnas.org/content/99/10/6550.full
tty, Thanks.
Excellent paper. Real science, trying to make sense of measurements with physics and math.
The alarmists will dismiss it as a old paper…but I see the issues he raises as still valid.
Length of day is a good check on these adjustments, until they start adjusting time as well.
Any such enigma can be explained by carefully adjusting the cosmological constant. Dark matter and dark energy being non-uniformly distributed will help. /sarc off
tty,
Thank God for physicists! They are even paying proper attention to the reported significant figures, unlike the run of the mill climatologist.
Something that struck me, while reading the paper, was that isostatic rebound of the land was being taken into consideration in analyzing the relative position of tide gauges with respect to the ocean surface. However, I saw nothing about how the isostatic rebound of the continental shelf that is currently underwater would cause a rise in sea level. That is, at the end of the last major glaciation, there could have been much more than 125 meters of ice loading the northern continental shelf; perhaps as much as 2,000 meters in some of the more northerly locations. With the removal of the ice overburden in excess of 125 m, the crust should rebound. As it does so, it displaces water locally, causing the overall ocean level to rise. Thus, we have two opposing effects. The tide stations on land that are rising make it appear that the sea level is dropping; the continental shelf that is underwater that is rising causes the sea level to actually rise. These two effects need to be untangled, if possible.
In that case the astronomers are obviously as lazy as it comes when calibrating their clocks and telescopes. Gosh what a shambles all those GPS satellites must be and continental drift has probably been happening at a rate we never even imagined thanks to AGW. This unadjusted reality just cannot be allowed to continue!! Think of the little children. They cannot have their reality not fiddled with!
sarc/
If the RC church can present itself as truly following the teachings of Jesus Christ and cover up massive, widespread child sexual abuse and ISIS can claim to be an Islamic caliphate and run a sexual slavery market for its inner circle then there is not much hope for ‘scientific’ zealots being expected to behave themselves frankly. Thats the brutal ruth of it all.
Has anyone notice that Figure 1 is a classic under-damped impulse response? Looking at it, we’re on the upswing of the damped oscillation, which should turn back down in another 1000 years or so.
Clyde, when glaciers/ice sheets melt the mass of the ice moves to another part of the globe and the land rebounds.
When below sea level ice melts, it doesn’t go anywhere, so no rebound.
The big iceberg of note last week is a good example. When it moves on, water of the same mass will take its place, no local rebound.
gregfreemyer,
Please re-read what I wrote. With the sea-level 125 m lower than today, there was several miles of land exposed that is only now under water. Any ice on the margins of that exposed shelf would have extended out some distance before the buoyancy of the ice resulted in it completely floating. That is, there was loading on the shelf, for a long period of time, that was essentially the same as what the interior of the continent experienced, except that the ice was thinner. There may have been a forebulge, complicating the situation, if the ice didn’t make it to the edge of the Continental Shelf.
The Larsen C iceberg was calved from a floating section of ice that reached beyond the grounding line. That was not what I was addressing.
As well as tidal gauges – how do they tie into this?
If the track record of post hoc “adjustments” being busted later was not so clear. And if there was actual physical evidence of slr impacting new areas… And please if one is going to promote slr have the integrity to address subsidence and erosion…..
Does this mean that the land is rising too, or do the sensors only read the ocean, and the land stays at the same altitude? Does all this crap happen in the back computer room and they think that no one will notice?
“Does all this crap happen in the back computer room and they think that no one will notice?”
Doesn’t matter, the MSM will cover the newly accelerating rise, and it becomes gospel.
Indeed. The scientific journal of choice for most climate activists is the Guardian.
And ‘they’ call skeptical beliefs conspiracy theories.
If you do not embrace CAGW and 50+ genders you are a “Science denier”.
But to embrace 50+ genders, you have to deny the science of genetics.
Flying from Europe to the south Pacific over water for 20 hours, ( thousands of miles and many miles deep )
the tide goes in and out at different times all round the world,
storms at sea
evaporation
the moon fazes affect high low tide levels
water temperature . ( expands contracts )
the above are a few
2/3 of our planet is covered by water
Now how the hell do you find 3.9 mm a year increase ???
excellent!…….
Uh… you have to subtract twice the original number you thought of.
Does anyone know if orbital drag has an affect on these satellites?
If it does, and the satelllites are being slowly deorbited by say 1 – 1.5mm per year, is this calibrated into the measurement?
After all, a satellite that has it’s orbit decayed by1 mm per year, will register the ocean being 1 mm closer than it is calibrated to be. This will be interpreted as additional sea level rise and will introduce an extra mm of sea level rise into the laser measurements.
It’s no coincidence that the world gravity map…..
https://www.bing.com/images/search?view=detailV2&ccid=L42aRab9&id=07DE9287F99453EFC254D52087309878957A0EF2&thid=OIP.L42aRab99WAGuZW2kIXhYQEsCi&q=world+gravity+map&simid=607995950000505099&selectedIndex=3&qpvt=world+gravity+map&ajaxhist=0
matches the world sea level map….
https://www.bing.com/images/search?view=detailV2&ccid=qTnLz4A3&id=238A8F47E2FB5FF91DEF0D7E3EA05F1E24376B70&thid=OIP.qTnLz4A3W3_XqCWbQYVg9gEsDA&q=world+sea+level+map&simid=607996233480802299&selectedIndex=12&qpvt=world+sea+level+map&ajaxhist=0
That sea level map shows 5-10mm/year off the coast of NSW Australia..
Yeah…. righttttttt !!!
From Tony Heller’s blog last September: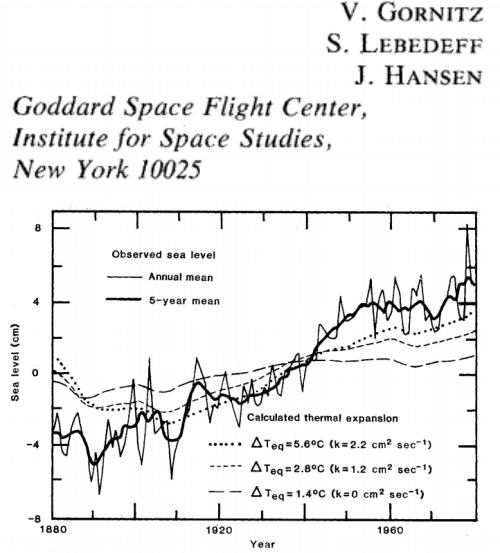
“In 1982, James Hansen told a completely different story. Hansen showed sea level rise slowing dramatically after 1950”
http://pubs.giss.nasa.gov/docs/1982/1982_Gornitz_go05100g.pdf
The whole blog post here:
https://realclimatescience.com/2016/09/more-massive-sea-level-fraud-from-james-hansen/
There are 148 PSMSL tide gauges in close proximity to differential GPS for estimating vertical land motion. About 70 of those are sufficiently long records to,provide meaningfull SLR. (you need a minimum of 6 decades.) Those show a rate of ~2.2mm/year per Nils Acel Moerner and no acceleration. That rate also closes with the sum of estimated ice sheet loss and thermosteric rise. The satellite altimetry does not close and is therefore probably too high. Details were provided in a recent guest post here on SLR and closure.
So fiddling with a demonstrably erroneous result does not make it less erroneous.
I suspect the point is not to remove the ‘closing problem’ (“The numbers didn’t add up”) but to make a story that the problem is solved, and solved to show acceleration. So the point is to influence policy rather than to actually fix scientific riddles. And, or course, after the paper has been published, it will be feverishly quoted by activists, installed into Wikipedia, and then believed by all gullible.
It is sad. It is more like the age of communism in Europe. Age when people knew what ‘politically correct’ really means.
By the way, this reiterates a common pattern in climastrology. A problem does not exist (like “there is no hiatus”), until someone ‘solves’ it, after which it can be referred as a solved problem (which existed) by the enlightened.
No, it makes it even more erroneous.
They are just kidding themselves that we would not see through this exercise “getting the correct answer by torturing the poor data”.
Mind you if we didn’t have real down on the ground Tide gauges it would be difficult to argue with them, so we all know what is coming next, don’t we?
Yes, you got it, make sure we have Archives of Tide data, because it won’t look the same shortly, it will be “Quality Adjusted” to bring it in line with the Satellites as we obviously can’t read the ones on the ground.
The unreliable tide gauges have to be retrocalibrated to fix the TOBS bias, plus site changes. The best way is to find the breaking points and remodel the data. I’m sure we can reveal the true sea level rise from the tide gauge data by splitting it into pieces and assigning adjustment coefficients to get the true anomaly development. Can I get a grant?
The tide gage data pages have a very clear note declaring that “seasonal variations have been removed”.
It is not raw data.
It too is suspect, as it does not comport with what was being reported by scientists before the era of politicization of all things related to climate and climate change.
Imagine a temperature time series that was labelled as representing the temperature with all of the seasonal variations removed?
Menicholas,
You are right about them not being original numbers.
If you present sea level data with subannual resolution, you will have the seasonal changes. It will also quickly show how unalarming the long-term global average relative rise is compared to local monthly or hourly changes. The same as with temperatures.
Sea level is a local, hourly number. The global mean sea level is a theoretical and very slowly increasing number. Theoretical, because it makes a little difference if the absolute sea depth bulges at mid ocean. It is the relative sea level at coast line, and coast line with population which matters.
Our alarmist friends wait for a storm surge and then blame global mean sea level. It is so sad.
Here’s what that sort of looks like for seven long running tide gauges around the world:
http://oi66.tinypic.com/1zv7rwg.jpg
Rates today are approximately the same as they were by 1950.
“Same as it ever was…”
Thank you Steve and David. Was scanning comments to see if anyone referenced the 1910-1945 stretch of GW.
Exactly.
See my earlier post: May 16, 2017 at 8:53 am
But, if you take the RIGHT guages, increase their geographic area read out to 1200 kilometers, you can have a greatly increased rate of rise.
Indeed, it doesn’t even matter if we know the local tectonics — as long as the local vertical land motions are constant. Surely, if sea level rise were accelerating, the acceleration would show up identically on every tide gauge on the planet. Since the CAGW caucus isn’t pointing to confirming tidal gauge data, I think we can safely assume that the tidal gauges not only don’t look on casual observation to be confirming the satellite “observations”, the confimation isn’t there when they looked for it using valid and/or creative statistical techniques. The chances that they didn’t look are probably roughly zero.
Let’s see. I can assume that every tide gauge is wrong, or that the satellite processing — which had at least one long term bug might have a few other … ahem … issues.
Think I’ll go with the tidal gauges for the time being.
Also think I’ll go with the tide gauges on this one.
Clearly the sea is rising in the middle of the oceans, not where the tide gauges are.
/sarc
Thinking about tectonics …
As the Atlantic is getting bigger and the Pacific is getting smaller, is the fact that the Pacific is deeper than the Atlantic taken into account? That alone should cause some sea level rise.
Second issue, and this applies to ice volumes as well …
You need to know where the land is underneath. I believe that the error bounds for the height of the land underneath the ice are greater than the error bounds in the ice surface level. Does this also apply to ocean bottom measurements?
You mean if there is acceleration, the same acceleration should be detectable in tide gauge data. Not identically, since tide gauges are showing other variation as well.
The fact is whether sea rise is actual or imagined an incredibly high number of the world’s population lives near the actual bodies of water that will be affected and there is no changing that.
Joe,
Dutch engineers have build up centuries of knowledge how to defend their low lying country against stormy seas. Sea level rise is peanuts compared to a strong NW storm at spring tide (+7 meters in 1953)… The lowest point in The Netherlands is 12 meter below mean sea level… The 30 cm/century sea level rise will not make much difference.
At this moment they help Bangladesh to build defenses for in case of hurricanes. Will be a good paid, permanent job until the next glacial period gets in…
That’s actually a good point Joe. Almost everyone who has looked at sea level rise agrees that it is happening and will probably continue to happen for a long time because much of it is due to the oceans expanding as they warm and as surface warmth woks slowly downward.. The rate of rise probably is not all that high — maybe 25cm per century. Maybe somewhat more. Almost certainly NOT James Hansen’s meters per decade.
That combined with humanity’s habit of building way too much infrastructure way too close to (and sometimes at or even below) highest high water is a problem. Not on a scale with nuclear proliferation, but a problem that often makes itself evident when a powerful storm comes ashore in an inhabited area. It’d be a problem even if sea levels were dropping. SLR just exacerbates the problem a bit..
BTW, the low coral islands likely are not in all that much trouble from sea level rise. Coral grows and storms take care of raising the islands — That’s fairly well settled science -Charles Darwin 1842. Confirmed by cores bored at Eniwetok in the 1950s and other observations. But the coral islands have other problems — lousy soil, limited fresh water, overpopulation.
“as surface warmth woks slowly downward.”
Surface warmth works down to the top of the thermocline and no further, besides, warm water, like warm air, rises. The deep ocean temperatures are a function of the density/temperature/pressure profile of water which varies between about 0C at the bottom and 4C at the bottom of the thermocline and will remain so as long as there’s ice at the poles. The thickness of the thermocline may vary, but only as the temperature difference between the deep ocean cold and warm surface waters varies, where the temperature of the deep ocean cold is fixed.
The deep ocean cold water is well insulated from warm surface waters by the thermocline and as such, surface temperatures have no effect on its temperature, which comprises the bulk of all ocean water. While you may not consider water an insulator, at a sufficient thickness even metals can act as a thermal insulator. Search for the temperature profile of the ocean and it will look like the temperature profile of an insulated wall separating the cold outdoors from a warm interior.
Joe. It seems to me a mistake to subscribe to the stupid-people hypothesis. I don’t for one minute believe that people will stand still in their wing-tips while the surf rises, millimeter-by-millimeter, getting their socks wet. People will not be making fortunes in Miami Beach selling Totes galoshes. We have centuries to protect New York City and other seaside cities. It is a lot cheaper to sandbag a city than it is to pay the ridiculous, and useless toll mandated by the Paris Accords.
True but the ‘shoreline’ has changed throughout history and the people have followed it.
Once again, if sea level is rising at four inches a century, how long will it take for that to actually flood anyplace, even if nothing is done?
Hundreds of years.
In hundreds of years, how many sections of coastline will NOT be hit by an incredibly bad storm?
I think that the statistics on that would be that very few places, in the Eastern half of the US anyway, will not have one single catastrophic storm in those hundreds of years.
Most places will have several.
New Orleans is far below sea level, and sits in one of the most hurricane prone spots in the world.
The city is also sinking more and more every single day, and nothing will stop that.
And yet, knowing that, and with all the predictions about sea level, how much debate was there about perhaps…not rebuilding it in the EXACT SAME PLACE when much of the city was destroyed?
I recall exactly zero…same amount as was had regarding all of the places that flooded in Sandy.
Both of those storms hit places that are well short, over the past several decades, of the historical number of hits from devastating hurricanes and coastal storms.
This is one of those things that no one is prepared to actually do anything about…not even when panic mongers occupy the White House.
The people spending money are ignoring this issue completely and 100%
Excuse me, using the 25 cm number…about ten inches per century.
Yet another example of how the actions of the people who shamelessly push global warming fearmongering are very close to being diametrically opposed, to a near mathematical precision, to what they are saying, and should be doing if they actually believed what they are saying.
Living their lives in the most energy profligate manner imaginable, buying and living and investing in hugely expensive oceanside properties, opposing the forms of power generation that are the best at reducing CO2 emissions…
Oh, yeah…and spending as much time as possible in the tropics, even though they are gosh darn certain that a handful of degrees of warming of the air will surely and completely erase humanity from existence.
Reality has evolved to a point that makes the Twilight Zone look like Sunday afternoon in Mayberry.
David, here is the Envisat working papers….it’s long, tedious….but hiding in there is the fact they didn’t believe what Envisat was reporting..sea levels not rising…so they tuned it to match the satellites that were failing….that Envisat was to replace…because the satellites Envisat was replacing were reporting fake news……
Fake news is in one section….reporting no sea level rise in another…..adjustments in another….etc etc
https://www.aviso.altimetry.fr/fileadmin/documents/calval/validation_report/EN/annual_report_en_2010.pdf
BTW….this is standard procedure across the board…
They report a sea level rise rate as a constant (3.9 mm/yr) and then refer it as a an acceleration?
If the slope is linear how is this an acceleration. Or should it be 3.9 mm/yr/yr? so next year we should be seeing 7.8 mm next year and 11.7 the following year….
At this accelerating rate the earth will run out of water to raise the sea level.
You can get acceleration by pushing mid-point results down. No change in average, but increase in recent numbers. There is a huge pressure to find acceleration, so it is expected that there are desperate, unscientific approaches to do that. In a healthy scientific community, these are shot down. But the current era is not healthy. If you shoot a paper down, you risk a lot. Possibly your whole career. These people attack on individual scientists, the more credible, the more vicious attack. They also tend to claim their opponents attack on individual scientists.
It’s a matter of fact that the data is revised. It’s also a matter of fact that climate data revisions follow a pattern. Why the data is revised is a matter of opinion.
The satellite altimetry measures an average sea level, mostly in the middle of oceans. We don’t really care if a place in Atlantic is 4,000 m deep or 4,000,001 m deep. What concerns us is the sea level at the coasts. The coast itself might be rising, stable, or subsiding, so we are really interested in differences. That’s what tide gauges measure.
Sorry – 4,000.001 m.
Yes but George, the hills on the ocean are really really small so if sea levels rise they will rise everywhere. Since you can measure this anywhere you should choose to do so in the place where you can get the best measurement. Near the coast there is a lot of noise from local tidal and weather related effects. It is much simpler to measure in the middle of the deep blue sea. The fact that we care more about what happens on the coasts is a red herring.
Not only that. There are also waves up to 29 m high.
Correct, Forrest. It astounds me that any sensible person would put much credence in measurements made of a constantly moving surface, let alone those made from a constantly moving platform several hundred kilometers away.
Didn’t somebody recently post a link to the NOAA story regarding their adjustment to their SST measurements? As I recall (could be wrong since I couldn’t find the link to go back and re-read), NOAA “knew” they had a problem with the ocean being too cool, since the temperature readings didn’t match the SLR. So, they found a problem with all their buoy temp sensors, and recalibrated (or whatever) to match their expectations.
Now we find out that the SLR was also suspect? It was inaccurate? Because it didn’t match the temp rise? Which didn’t show up in their buoy data either?
So now we have both an adjusted SST record AND adjusted SLR record?
Fantastic!
So glad my tax dollars are going to fund this effort…
rip
can’t wait for the “Rising Sea Levels in the Poles” story … homogenized measurements of course …
Imagine the scary headlines: The North Pole is flooded!
There’s all sorts of ways to depict what they’re doing. Here’s one that shows the over-all rate of sea level rise as a function of time:
http://oi68.tinypic.com/2hz4cqt.jpg
If there weren’t any changes made to the data the orange plot should have fallen right on top of the plot in blue. So it will be interesting to see what changes are in store for the first CU Sea Level Research Group release for 2017. Will earlier rates be found to be less than had been reported? Will that high point sometime during 2006 be reduced? Stay tuned.
It’s been quite obvious that the CU Group has been a cheer-leader for increased sea level They’ve released several (three that I know of) titles lamenting no acceleration during the altimeter era, a speed bump on the way to higher seas and a question if acceleration of sea level rise is imminent.
Steve Case, that is a damning chart. Thanks for posting.
So their putative cause for the change in rate of SLR is the 1998 El Nino weather event, not global warming.
Sea level rises … sea level falls … it’s always doing one or the other since at least the onset of the Pleistocene.
Where I live in Florida, on a long peninsula, we have at various times in the last 2.3 million years been approximately three times as wide as we are today, and at other times, completely inundated. The entire peninsula is made of limestone with a thin layer of sand proving it was entirely under the sea surface, multiple times. At some distant point in the future, we will be under water again, no matter what mankind does or doesn’t do. That is going to cause some massive social and economic disruption! But take heart, some tens or hundreds of thousands of years later, we’ll be uncovered, and the “new” Florida will end up being 400 miles wide again.
We need a special place to put these folks where their imaginary world will not be in such conflict with the real world. I fear for their mental well being. They need a protected environment where they can have their own reality. They can pretend they are smart, honest, insightful and that every day they are out there saving the world from Armageddon, all while writing nifty little fairy stories about how every breath you take makes the ocean warmer and unicorn farts can power modern society.
Maybe they are illegal immigrants from one of the other dimensions of the Multiverse (which, of course, exist because some cosmological models predict them).
And in the Multiverse… All possible adjustments are both correct and incorrect.
That sounds about right.
It’s called Academia
… hiw aboud giving them a holodeck?
And my Mark 1, Mod 0 eyeball (left – my good eye) says the slope increased after 2010.
What about the foregone conclusion calibration error (FCCE, for short) ?
Here, I’ll work it all out mathematically for you:
If “satellite calibration error” is SCE,
and if “foregone conclusion calibration error” is FCCE,
then SCE – FCCE = 0, or zero error.
QED (no not the Latin thing, but “Quite an Enlightening Discernment”)
But I’m experiencing some uncertainty in arriving at this with a high degree of confidence, and so I need a grant to help resolve it.
Colors are different satellites. The spec for instrument drift for Jason 2 (green) is plus/minus 1mm/year. Essay PseudoPrecision in ebook Blowing Smoke shredded two hysterically funny papers purporting to explain the changes as physically real.
Speaking of adjustments, wonder what happened here—Freeport, Texas is subsiding, apparently with a little help. In about 1972 there is an “Apparent Datum Shift” up of almost 0.2 meter. I know people pushing 90 who grew up on the seashore who want to know where the rise is. I can’t get the figure but this is the link. Other Texas sites do not show this.
https://tidesandcurrents.noaa.gov/sltrends/sltrends_station.shtml;jsessionid=C83722B0078A42FA4605910585A04F9B?stnid=8772440
“The mean sea level trend is 4.43 millimeters/year with a 95% confidence
interval of +/- 1.05 mm/yr based on monthly mean sea level data from
1954 to 2008 which is equivalent to a change of 1.45 feet in 100 years.”
Somehow I recall being taught to be suspicious of two significant decimals in such data.
You folks wouldn’t be chance be pumping fluids — petroleum and/or fresh water — out from under your town, would you. That has been a problem elsewhere.
Great to see science at work. They had a problem, potentially a fundamental funding problem, and they solved it. Now all that remains is to adjust the land itself. Can’t have stubborn pieces of the globe in denial of being submerged. Fortunately, there is the perfect tool ready for the necessary adjustments; maps. Soon enough, a seaside city close to you will be showing contours below sea level. If you don’t have wet feet, do something about it!
I feel a Google maps re-do in the future, then.
I Suppose that they will forget to back out the bogus Isostatic Adjuatment…
Its ‘lucky’ how all the errors they find work in their favor and support ‘the cause ‘ the lesson from this, never play poker with these people . Not because they are good players but because they will cheat like hell , and stack the deck ever chance they get .
Talking of adjustments, I have a twitter troll who thinks devices are calibrated according to/using their own readings. Poor chap!
As I recall the CU satellite project “adds” an additional .3 mm to the measured rate to accommodate a theorized dropping of the ocean floor. On top of that, the accuracy of the satellite is only 2 cm; making measurements over a short span meaningless.