Guest post by David Middleton

[…]
The thaw is happening far faster than once expected. Over the past three decades the area of sea ice in the Arctic has fallen by more than half and its volume has plummeted by three-quarters (see map). SWIPA estimates that the Arctic will be free of sea ice in the summer by 2040. Scientists previously suggested this would not occur until 2070. The thickness of ice in the central Arctic ocean declined by 65% between 1975 and 2012; record lows in the maximum extent of Arctic sea ice occurred in March.
The most worrying changes are happening in Greenland, which lost an average of 375bn tonnes of ice per year between 2011 and 2014—almost twice the rate at which it disappeared between 2003 and 2008 (see chart). This is the equivalent of over 400 massive icebergs measuring 1km on each side disappearing each year. The shrinkage is all the more perturbing because its dynamics are not well understood. Working out what is going on in, around and underneath a supposedly frigid ice sheet is crucial to understanding how it will respond to further warming and the implications of its demise for rising global sea levels (see article).
[…]

375 billion tonnes per year… Oh my!
400 massive icebergs measuring 1km on each side disappearing each year… Oh no!!!
Wait a second… Those sound like big numbers… But how big are they compared to the Greenland ice sheet?
The USGS says that the volume of the Greenland ice sheet was 2,600,000 km3 at the beginning of the 21st century.
According to the “ice sheet goeth” graph, since 2001, Greenland lost about 3,600 gigatonnes of ice or about 3,840 km3 … That equates to a 16 km x 16 km x 16 km cube of ice (3√ 3,840 = 15.66). That’s YUGE! Right? Not really.
It’s not even a tiny nick when spread out over roughly 1.7 million square kilometers of ice surface. That works out a sheet of ice less about 2 meters thick… Not even a rounding error compared to the average thickness of the Greenland ice sheet.
- 2,600,000 km3 / 1,700,000 km2 = 1.53 km
The average thickness of the Greenland ice sheet is approximately 1.5 km (1,500 meters). 2 meters is about 0.15% of 1,500 meters.


From a thickness perspective, 2 meters looks like this:

Using The Economist ratio of 400 km3 to 375 gigatonnes, 2,600,000 km3 works out to 2,437,500 gigatonnes. When some actual perspective is applied, it is obvious that “the ice sheet goeth” nowhere:

Despite all of the warming since the end of Neoglaciation, the Greenland ice sheet still retains more than 99% of its 1900 AD ice mass.
Multiple Choice Quiz
Fill in the blank:
Alarmists are _________ perspective.
- a) allergic to
- b) ignorant of
- c) willfully ignoring
Can I just fill in ‘a**holes’ and ignore the multiple choice options?
Personally, I prefer not filling in a**holes.
I have with my boot a few times. Old Army sergeants saying: “I’ll put my boot so far up your a$$ you’ll taste Kiwi for a week.”
Matt Ridley had a good post on Greenland ice some years back:
http://www.rationaloptimist.com/blog/greenlands-melting-ice/
At the rate of one percent per century, the GIS would be gone in 10,000 years, but since climate is cyclic, there will be more and probably colder Little Ice Ages during that interval in which the ice sheet will gain mass.
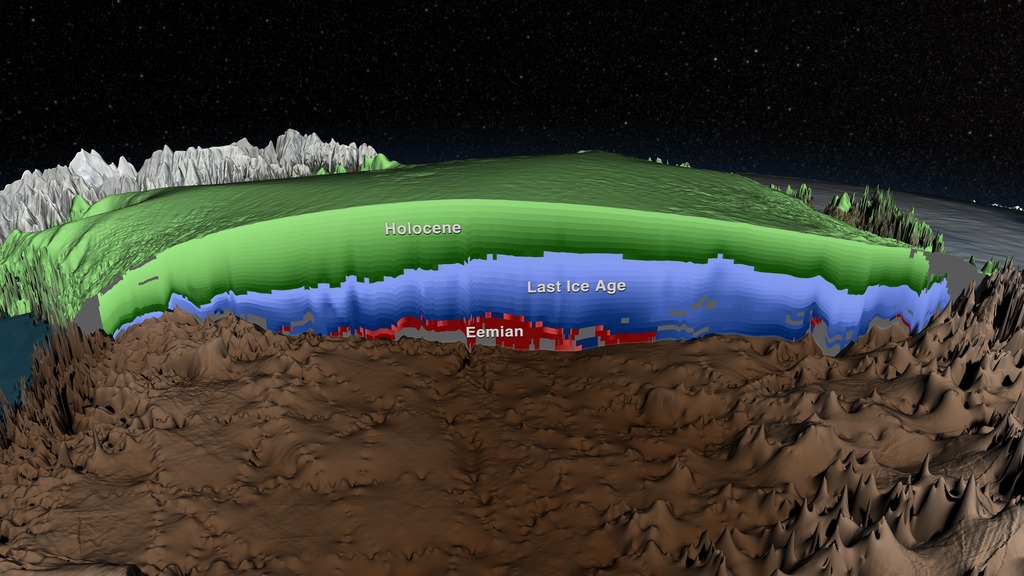
IMO the 11,000 year-old Holocene, even should it last another ten thousand years just hasn’t been and won’t be hot enough to melt the whole GIS. In the Eemian, which was warmer and lasted 16,000 years, the Southern Dome melted about 25% more than it has so far in this interglacial, but the Northern Dome remained largely intact.
However, should the Holocene last another 20 to 40,000 years, as some think possible, then the GIS could melt completely. The SD did so before in a longer, warmer interglacial, possibly twice.
Chimp May 1, 2017 at 10:10 am
2 questions:
1. Can the top boundary of Eemian ice be detected in Greenland ice cores?
2. How can max ice level be measured after melting has occurred?
1. Yes. But only if the ice is undeformed. IIRC only 1 core (NGRIP) has a clear Eemian (Sangamonian) section.
http://i90.photobucket.com/albums/k247/dhm1353/NGRIP.png
2. It can’t be measured.
Stevan,
Yes, the Eemian can be detected.
No, or with difficulty, but the max doesn’t really matter. Geology shows where how much mass must have been missing compared to now.
As for total melting, dating organic material from below the ice sheet indicates when the land was exposed.
Here’s one guess as to what was left after the Eemian ended.
http://www.rockyhigh66.org/stuff/greenland_ice_eemian3.png
Apparently they think their job, these days, is to tell you how/what to think. Forget facts, those are so patriarchal.
ROFLMAO! I love this line from the economist, “around and underneath a supposedly frigid ice sheet”. So now Warmists are doubting that the Greenland Ice Sheet is frigid, merely just common speculation they insinuate. I really wonder what goes on inside their supposed grey matter.
I’m guessing that they are trying to argue that going from -30C to -29.99C means that Greenland is no longer frigid.
RW same thing that goes on in NYC snow, its gets grey, granulates, and melts away. Nah, couldn’t be correlation is not necessarily causation. So I guess we don’t know what goes on in their “supposed grey matter”.
Everybody who knows anything about earth science (third grade and up) knows that we are in an interglacial period. What happens in interglacial periods? Yup – glaciers melt.
The only time that glaciers don’t melt is when we are in a glaciation period – what laypersons used to refer to as an “ice age”. It sucks to be a human during an ice age. It’s much better to be a human during an inter-glacial period.
Since the initiation of the Pleistocene, our planet has lived in a bipolar state – either a glacial period, or an interglacial period, or in one of the brief transitions from one state to the other. For the last 2.4 million years.
The very worst thing “man-made global warming” can do is just more of the same … continue melting the remnants of the same glaciers that have been melting the last 15KY or so … just as we’ve been doing anyway.
You forgot d) All of the above.
Alarmists are already far too much entangled in false reports to find a save way home to normality.
a) allergic to
b) ignorant of
c) willfully ignoring
d) far from reality
This years winter maximum was about the same as other recent years. What is “unprecedented” however is how slowly Arctic sea ice is melting this year.
The 30-year median melt in April is 1.175 million square kilometers. This year it was only 730,000 sq km. March melt was also lower this year.
As predicted here, sea ice extent is headed for the normal range. It’s already higher than on April 30 this year than it was in 2016 and 2015. Unusually cold Arctic SST, which even NOAA has grudgingly acknowledged but downplayed, is the main reason for the slow thaw, but air temperatures in the region are also back close to average.
http://nsidc.org/arcticseaicenews/charctic-interactive-sea-ice-graph/
Griff could still luck out on his assertion that this year was “sure” to set a new record low, if there are yet again August cyclones in the Arctic, but he has already been shown wrong that the ice would stay well below normal all year.
Last autumn, the Arctic had very much time to lose much heat from the upper reaches of the Arctic Ocean. Does no one notice what the Arctic really is? The biggest sink for the excess heat on the earth. And the longer the Arctic Ocean remains open in its peripheral regions, the greater the heat loss. Nevertheless, on the side of the NOAA is written, the ice sheet of the Arctic would lower the earth temperature. How can this happen when the ice isolates the water surface from the atmosphere? The albedo effect with thick ice is negligible in the arctic dark winter, since simply with such a non- insulation. In the arctic night there is no more heat in the atmosphere, which can be radiated. And also in Summer, except a few weeks at the ice minimum, the ice isolated the warmer water from the atmosphere, contrary to open water surfaces with a little frost in the atmosphere. But is the ice thinner, the heat release can happen also in late fall and early winter. At the time of the last real ice age the ice of the Arctic was about 3 times as thick as today, but the ocean below it was about 2-3 degrees warmer. What was not written after 2007 and 2012? But no, there were the years 2008 and 2009 and after 2012 came 2013, each year with an amazing rebound of the ice, where previously the early death was predicted. This year is even more striking, because the freezing in the 2016 fall and early winter was slower than ever and the Arctic Ocean is therefore very cold this spring and early summer. And therefore, the melting in the arctic is at a very slow pace.
Griff was told that this year might be like the rebounds from low ice previously, eg 2013. Ice was low in both 2015 and 2016, although not new records, so it could rebound rather than remain low for a third year. With the El Nino over, that might even be the way to bet. But actual extent will depend on the WX in August and September.
Basically Arctic sea ice extent has been flat for a decade, with some years lower, eg 2007, 2012, 2015 and 2016, others higher, eg 2009, 2013 and 2014, and the rest in between.
i think it will likely be observed that the ebb and flow of arctic sea ice extent, both summer and winter,drive the amo .
One has to ask what alarmists hope to accomplish with exaggeration and prevarication, other than risking their credibility. I presume that they think that the typical voter is too dumb or lazy to question the claims. Of course, that is an insult to the “common” person liberals pretend to represent.
Fear, Get enough people frightened of something they will demand that the Government does something about it. See the DDT response or the ozone hole thing. Tried and true tactics.
And yet we have Paul Ehrlich and his dismal record of incorrect prevarication carrying on with his sweet-ass career. Wrong about everything. Lauded a hero by the human haters.
At least the Malthusians are consistent… wrong 100% of the time.
I remember reading maybe 20 years ago now that the planes slowly ‘sank’ through the snow and later ice getting to 268 feet below the surface level. Along with some additional snow falling on top for 50 years. Obviously this area of the icecap didn’t get 80 feet of snowfall per year, making 5.4 feet ice per year. Recent ice cores tells us this basic fact.
The 2 Grace satellites are measuring gravity anomalies in the ice and bedrock below, so relying on Grace alone to measure ice balance alone may be in error if the underlying bedrock to great depth is changing density. The isostatic conditions are changing as well with LIDAR measurements to the actual surface so is difficult to get a real mass ice balance over all of Greenland.
The coastal glaciers are receding in some area’s as is obvious but the ice cap is relatively unchanged and would take thousands of years to melt, especially at the higher elevations in the interior.
Yep. The P-38’s mostly sank into the snow.
The problem with GRACE and bedrock is glacial isostatic adjustment (GIA). As ice sheets melt, the underlying crust rises (post glacial rebound, PGR).
The raw data from GRACE actually indicate that the Antarctic ice sheet is growing and Greenland is fairly stable.
The ice mass loss in Greenland is the result of subtracting the GIA from the raw GRACE data. The net ice mass loss is generally less than or equal to the GIA.
https://wattsupwiththat.com/2013/12/21/oh-say-can-you-see-modern-sea-level-rise-from-a-geological-perspective/
David Middleton
A frequent claim, but the “physics” of the airplanes does NOT support this myth.
A piece of metal, when liad directly on a ice mass (and slightly heated) WILL slowly sink into the ice mass as its pressure slowly melts the ice below the metal, the ice becomes water and moves, and the metallic mass moves down and again presses against more ice lower down. A very slow process, and depends on the metal being very heavy (compared to the ice) and very dense (with a high mass to contact surface ratio.)
A WWII P-38 is neither. Many that crash-landed in water stayed afloat for long periods, and these P-38 crashed because they were lightly-loaded (no guns, ammo, bombs, or cargo) for the long flight AND were out of gas! (No fuel forced them down.) They landed in smooth, “regular” glide slopes on the hard ice, and were essentially undamaged in body, lower body, nose, tail and wings. They would “float” above the ice, UNTIL more snow landed on top of them. The P-38’s would NOT sink in, but would be stable because the plane weighs less than the ice you are assuming it is “submerging” into by “pressure”. Further, the intact wings, body, and tail surfaces would RESIST further drops – even IF you assume that the full weight of the plane is on the small wheel area. (I will grant a near-certainty that they would sink 4 feet down when the tires deflate.)
No, the planes are 81 meters down because the ice increased in height by that much since WWII.
I stand mostly corrected.

The crash site was in southern Greenland:
http://p38assn.org/images/p38s/gg/greenland-lg.jpg
This area experiences some summer melting:
Some of the 61 m of ice overburden was due to the plane sinking during summer melt season.
Although it does look like that area of Greenland gets 1-2 m of snowfall per year:
So… More than 50 m of the overburden was probably due to snowfall.
No, they are 81 feet down because 81 feet of ice accumulated over them. The way glaciers work is snow falls on the top, and ice is squeezed out the bottom.
There is no evidence that the glaciers are 81 feet taller than they were during WWII.
85 meters: 24 meters of snow on top of 61 meters of ice. The crash site experiences some summer surface melting. Some (not most) of the overburden was due to the P-38’s sinking.
Since the crash landing the planes have moved about 10km downslope.
If sinking the weight of the engines would have meant the plane would have been found nose down. It was found level.
The P-38 was a twin-engine fighter. The engines were not in the nose.
And “Glacier Girl” was slightly nose-down.
http://p38assn.org/glaciergirl/images/GPR-measurement-concept.jpg
RACookPE1978:
You say to David Middleton
Sorry, but David Middleton is correct, and no heating and/or melting is required for a mass to sink through solid ice because of a material property of ice which was first discovered by Michael Faraday (of ‘electricity’ fame).
The property is why ice is slippery, why ice skates work, and is one of the reasons for doubt about paleo data from gas analyses of ice cores.
At all temperatures down to about -40°C all ice is coated with a few molecules thickness of liquid water.
So, the weight of an object resting on an ice surface pushes the object down into the liquid layer. This causes the liquid layer to displace downwards so the object sinks further.
The sinking is slow but can be increased by increasing the pressure the object applies to the liquid layer (e.g. by increasing the objects mass or reducing its vertical cross-section).
A nice demonstration of this effect can be used to amuse children at Christmas parties.
Place an ice cube on the top of a wine or bear bottle.
Attach two similar weights to a length of cotton thread; one of the weights at each end of the thread.
Place the thread across the ice cube so the weights hang down opposite sides of the bottle.
After some time the thread is seen to have entered the ice cube.
Eventually the thread exits the bottom of the ice cube.
The top and sides of the ice cube show no evidence that the thread sank through it.
Richard
RACookPE1978 and David Middleton:
This is an addendum to my above post. It adds detail that could confuse the clarity of my above post if it were not separate.
The empty plane would be lighter than ice so would move up (n.b. not down) through solid ice. This is similar to the reason why at any level in an ice core the ‘gas age’ differs from the ‘ice age’ often by centuries.
But the plane would not be empty. When covered with snow (firn) it would fill with melt-water during summer melt season. Hence, its bulk density would then be greater than that of ice (duralumin and steel are denser than ice) so it would sink.
Richard
Studies have found that:
1) The Greenland Ice Sheet may have receded tens of kilometers within its present day margins during the early and mid Holocene.
2) In many locations the ice sheet and mountain glaciers reached their maximum extents since the early Holocene during the Little Ice Age.
https://notalotofpeopleknowthat.wordpress.com/2014/04/06/we-live-in-cold-times/
Why should anybody be surprised that the ice sheet is getting slightly smaller again?
People who are unfamiliar with Quaternary geology have an excuse to be “surprised that the ice sheet is getting slightly smaller again.”
Science “journalists” generally have about the same level of scientific literacy as the general public… So, they have the same, lame excuse.
However, there is no excuse for climate “scientists” to be unfamiliar with Quaternary geology.
“The Greenland Ice Sheet may have receded tens of kilometers within its present day margins…”
The present day margins shown in the Greenland map at the top of the page are bogus.
http://www.rockyhigh66.org/stuff/Greenland6050'4345_map_zoom.png
The map dot is well within the large green ice-free zone surrounding the ice cap. On the map, anyway. Here’s a shot I took of the same area in 2004.
http://www.rockyhigh66.org/stuff/Greenland6050'4345_real.jpg
So much ice it’s overtopping the mountain ridges and flowing down into the fjords.
The white area on the map below the 1,000 m contour is where the ice is >10 m thick. The green area isn’t necessarily ice-free, much less snow-free.
The map dot is in the center of the photo, which is looking west. The entire top of the photo (and far beyond) is in the green area, and definitely > 10m.
The “dot” is right where two ice masses, presumably valley glaciers nearly merge…
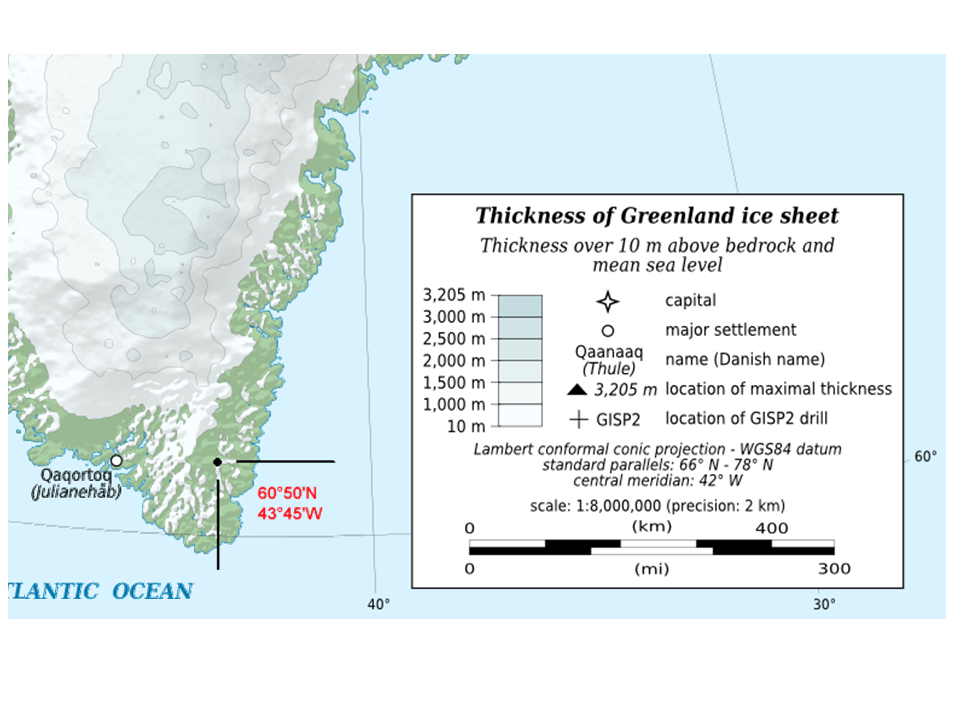


The “green” area doesn’t mean ice- or snow-free. It indicates that there is less than 10 m of ice. The “white” area below the 1,000 m contour indicates that the ice is greater than 10 m thick and less than 1,000 m thick. It’s an isopach (thickness) map of the ice, not ice and snow. It is not intended to be an ice and snow extent map.
Most of the “green” area along the southeast coast is clearly covered with ice and/or snow…
But, that’s not what the map is of.
Within the ice sheet, there are numerous cores and GPR cross sections which can be used to measure the thickness of the ice sheet. Now, I have no idea how the author of the map estimated the ice thicknesses outboard of the main ice sheet. So, it could very well be wrong. However, the tongue of ice trending from the rocky outcrop to the bottom of the photo looks like a valley or alpine glacier, it’s probably the eastward trending valley glacier on the map. The rest of the white on the photo looks like snow to me.
d) impervious to reason.
Good one.
d) impervious to reality
Hey, the good news is that Al Gore’s ice free Arctic summers are postponed by a further 26 years! I guess Al missed the scientists saying 2070. All of this feels like 1984 to me where statements can be redrafted historically at will.
he has another movie coming up this summer: An incoNvenient sequel: Truth to power.
http://www.imdb.com/title/tt6322922/?ref_=nv_sr_1
An Inconvenient Sequel: The Phantom Menace.
“alice does Dallas”
‘Even worse that we expected’.
It seems we always get these catch-phrases after a long period of nothing. Just to make sure we don’t go around believing our lying eyes.
You forgot D). All of the above.
Alarmists really need to stop partying so hard, drinking and doing drugs.
A longer term perspective of Greenland ice.
Yup. Earth has been cooling for 3000 years.
If you want to worry about climate, there’s your concern.
http://www.tonykieraldo.com/wp-content/uploads/2015/01/alfred-e-neuman.jpeg
Might as well worry about plate tectonics or entropy… 😉
Where was “all of the above” in the quiz?
B and C are incompatible…
b) ignorant of
c) willfully ignoring
You can be willfully ignorant by refusing to look at anything that might challenge what you want to believe.
“C” wasn’t “willfully ignorant.” It was “willfully ignoring.” You can’t willfully ignore something if you are ignorant of its existence.
If I willfully refuse to read a book, I’m ignorant of everything within the book.
You’re not ignorant of the existence of the book.
They aren’t ignorant of the fact that there are people who disagree with them (book). They are however ignorant of the arguments used by the people who disagree with them because they refuse to actually look at those arguments(contents of the book).
If:
Alarmists are ignorant of perspective.
Then they can’t be:
Alarmists are willfully ignoring perspective.
So true. This information has been put in front of them many times.
Facts and data are an enema to them.
David. thanks for the last graph.
I used a slightly higher total volume (different reference maybe) in my calculation and have been using this graph of Total Greenland Ice Mass to annoy ice worriers. they cannot refute it.
I think the difference is that I used the ratio of 375 gigatonnes per 400 cubic km (ice has a lower density than water). 1 gigatonne of water = 1 cubic km of water. Had I used a 1:1 ratio, I would have come up with same number you did.
Either way, 3,600 gigatonnes is nothing compared to 2.4 to 2.6 million gigatonnes.
[But the actual density of very thick static (ice cap) ice differs greatly from that of thin, fast-moving glacier ice, and both from “frozen” thin layers of sea ice. .mod]
Also ice becomes slightly more dense as it gets colder.
But no matter how you do the calcs.. the graph is still basically a dead flat line.
The 3600 Gt number is from GRACE, which is highly suspect over active volcanic regions,
Greenland has a massive intrusion of the Icelandic sack underneath the northern end.
Take those numbers with a grain of salt !
ps. I started with a larger volume from some reference somewhere. used the same density as you did.
Funny… Your ice mass looks like it’s about the same as my ice volume.
Of course, there are a wide range of estimates for Greenland’s ice mass and volume.
iirc, I started with 2.72 million km³.
Don’t know where I got the value from
As you say.. lots of different estimates.
I will use the value of around 2.4 x 10^15 tonnes from now on, so we match. 🙂
Estimates of the volume of the Greenland ice sheet vary from 2.6 to 5.5 × 10^6 km^3. The difference between 2.6 and 5.5 million cubic kilometers of ice is quite a bit larger than 3,600 gigatonnes. For that matter, GRACE derived estimates of recent (2003-2011) ice mass balance vary widely as do the glacial isostatic adjustments…
With ~±10% margins of error in modern satellite measurements of glacial mass balance and GIA accounting for up to 1/3 of the reported ice mass loss, it is truly amazing that a 0.15% reduction in the Greenland ice sheet during the 21st century can be identified with such robustness [/Sarc].
with henceforth use this one so we match. 🙂
It’s worse than we thought; Trump is cutting our funding!
This post does a great job addressing the Economist’s reference to ice mass loss in Greenland (pointing out that the Economist communicates the loss in absolute, not percentage terms).
Two points on this:
1. Is there a person with relevant background (Anthony himself for example) who could make this point visible to Economist readers, in a comment section, Twitter feed, or (absent something better) in a short letter to the editor?
2. Perhaps this post could be supplemented to address the Economist’s claim that “Arctic” sea ice extent has dropped by “more than half”? I am a casual student of all this, but I had thought that 1979-present satellite data showed a decline much,
much smaller than that (even putting aside the apparent non-representativeness of 1979 as a benchmark). So I was surprised to see that claim. Perhaps the percentage decline is smaller in the winter than in the summer, and the Economist is talking about the latter when it makes its “more than half” statement?
I now see that the article does have a comment section. A shortened version of this article there would be great. (The tone and tenor of comments there already is surprising — a healthy dose of challenge and skepticism. This suggests that it would be productive to add the facts above to the discussion.)
Never mind “perspective”. You need to “think of the children”.
Well, not really.
Arctic summers ice-free ‘by 2013’ (as predicted in 2007)
Scientists in the US have presented one of the most dramatic forecasts yet for the disappearance of Arctic sea ice.
Their latest modelling studies indicate northern polar waters could be ice-free in summers within just 5-6 years.
The bigger and more alarmed they are, the harder they fall……..
http://ocean.dmi.dk/arctic/meant80n.uk.php
http://www.climate4you.com/images/NOAA%20SST-NorthAtlantic%20GlobalMonthlyTempSince1979%20With37monthRunningAverage.gif
http://www.climate4you.com/images/AMO%20GlobalAnnualIndexSince1856%20With11yearRunningAverage.gif
NSIDC has extent GREATER than 2006, 2015, 2016, and it will probably shortly overtake 2004, 2007, 2014.
MASIE has sea ice extent above 2006, 2007, 2009, 2011, 2015 and 2016, and probably catching 2013 in the next couple of days.
I think the DMI has a graph of the Greenland ice that differs from NOAA. One shows loss and the other gains.
dmi also changed how it measures arctic sea ice extent last year .not sure if the new algorithm has been applied to the previous years displayed on the chart .
A further perspective on Greenland SMB
As we all know, the late 1970’s was the coldest period in nearly a century, (great time for a reference period for the AGW scam)..
…and 1930/40’s was a peak, probably about the same as now.
Graph looks incorrect compared to the stuff from Denmark itself. See graph from “Latitude”