Global temperatures plunge in April – "the pause" returns

Global temperatures have dropped 0.5° Celsius in April according to Dr. Ryan Maue. In the Northern Hemisphere they plunged a massive 1°C . As the record 2015/16 El Nino levels off, the global warming hiatus aka “the pause” is back with a vengeance. He writes:

Some good news to end April, global temperature anomaly has fallen to only +0.1°C today (snapshot) … graphic is like stock market trace


Global Ocean Temperatures Drop To Pre-El Nino Levels

Despite NOAA’s Denial, A Growing Number Of Studies Confirm the Global Warming Hiatus

Despite widespread denial among climate activists, a growing number of scientific research papers in recent months have confirmed the global warming hiatus, trying to explain its possible reasons (for the latest studies see herehere and here).  The latest study claims that the Southern Ocean played a critical role in the global warming slowdown.

h/t to the GWPF


Dr. Roy Spencer says while there was a plunge at the surface, the lower troposphere is still holding warmth, but what is clear is that the effects of the El Niño are over:


The Version 6.0 global average lower tropospheric temperature (LT) anomaly for April, 2017 was +0.27 deg. C, up from the March, 2017 value of +0.19 deg. C (click for full size version):

Global area-averaged lower tropospheric temperature anomalies (departures from 30-year calendar monthly means, 1981-2010). The 13-month centered average is meant to give an indication of the lower frequency variations in the data; the choice of 13 months is somewhat arbitrary… an odd number of months allows centered plotting on months with no time lag between the two plotted time series. The inclusion of two of the same calendar months on the ends of the 13 month averaging period causes no issues with interpretation because the seasonal temperature cycle has been removed as has the distinction between calendar months.

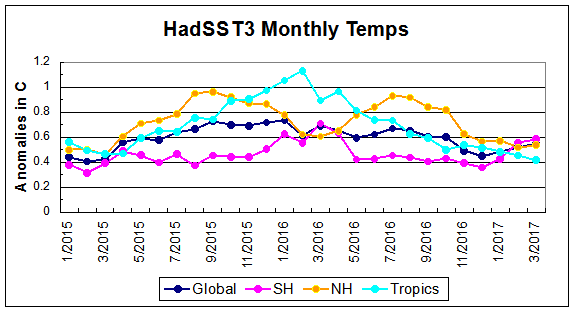
The global, hemispheric, and tropical LT anomalies from the 30-year (1981-2010) average for the last 16 months are:

YEAR MO GLOBE NHEM. SHEM. TROPICS

2016 01 +0.54 +0.69 +0.39 +0.84

2016 02 +0.83 +1.16 +0.50 +0.98

2016 03 +0.73 +0.94 +0.52 +1.08

2016 04 +0.71 +0.85 +0.58 +0.93

2016 05 +0.54 +0.64 +0.44 +0.71

2016 06 +0.33 +0.50 +0.17 +0.37

2016 07 +0.39 +0.48 +0.29 +0.47

2016 08 +0.43 +0.55 +0.31 +0.49

2016 09 +0.44 +0.49 +0.38 +0.37

2016 10 +0.40 +0.42 +0.39 +0.46

2016 11 +0.45 +0.40 +0.50 +0.37

2016 12 +0.24 +0.18 +0.30 +0.21

2017 01 +0.30 +0.26 +0.33 +0.07

2017 02 +0.35 +0.54 +0.15 +0.05

2017 03 +0.19 +0.30 +0.07 +0.03

2017 04 +0.27 +0.27 +0.26 +0.21

The UAH LT global anomaly image for April, 2017 should be available in the next few days here.

The new Version 6 files should also be updated soon, and are located here:

Lower Troposphere: http://vortex.nsstc.uah.edu/data/msu/v6.0/tlt/uahncdc_lt_6.0.txt

Mid-Troposphere:http://vortex.nsstc.uah.edu/data/msu/v6.0/tmt/uahncdc_mt_6.0.txt

Tropopause:http://vortex.nsstc.uah.edu/data/msu/v6.0/ttp/uahncdc_tp_6.0.txt

Lower Stratosphere: http://vortex.nsstc.uah.edu/data/msu/v6.0/tls/uahncdc_ls_6.0.txt

0 0 votes
Article Rating
282 Comments
Oldest
Newest Most Voted
Inline Feedbacks
View all comments
May 1, 2017 7:26 am

Cooler temps in the presence of increased C02… what the?! 😉
Andrew

Reply to  Bad Andrew
May 1, 2017 7:33 am

It’s natural variation when they drop. It’s human caused when they rise! Always! /sarc

tony mcleod
Reply to  Adrian Roman
May 2, 2017 3:55 am

Other way around.

Mat
Reply to  Bad Andrew
May 1, 2017 7:46 am

Cooler temps? It says clearly in the article the anomaly is still positive.

Reply to  Mat
May 1, 2017 7:57 am

Mat, the line squiggled downward. Isn’t that cooling? Or is everything warming no matter which way the line goes?
Andrew

Janice Moore
Reply to  Mat
May 1, 2017 8:42 am

comment image
On the way down
from a rise far too small and short-lived to conclude the stop in warming EVER ceased.
Given the data we now have:
For UAH: There is no statistically significant warming since December 1993;
For RSS: There is no statistically significant warming since October 1994;
For Hadsst3: There is no statistically significant warming since May 1997.
(Source: Werner Brozek, ed. by J. T. Facts, https://wattsupwiththat.com/2017/04/11/la-nina-puzzle-now-includes-february-and-march-data/ )
the stop in warming is.
*********************************
Warming may, indeed, resume. So far, it has not.
BOTTOM LINE:
CO2 UP. WARMING STOPPED.
This has never been explained away by the AGWers.
…. it’s a travesty that we can’t. {NOT! — lolol}
Kevin Trenberth

Roscoe
Reply to  Janice Moore
May 2, 2017 7:22 pm

Janice says…
………………………………………………………………………….
For UAH: There is no statistically significant warming since December 1993;
For RSS: There is no statistically significant warming since October 1994;
For Hadsst3: There is no statistically significant warming since May 1997.
(Source: Werner Brozek, ed. by J. T. Facts, https://wattsupwiththat.com/2017/04/11/la-nina-puzzle-now-includes-february-and-march-data/ )
…………………………………………………………………………….
Well that’s according to Mr. Stokes somewhat puzzling definition of statistical significance which is quite broad and looks at each one alone with no consideration of their agreement.
Actual temp changes 1993 to 2017
HadCrut +0.43 deg
GISS +0.61 deg
RSS + 0.30 deg
UAH +0.28 deg
The four data sets have an average monthly correlation of 0.81 so they agree more than they disagree. All are up. The chance of achieving these four results with some kind of Monte Carlo are shockingly low.
Just how low? I might just run the numbers

Janice Moore
Reply to  Mat
May 1, 2017 8:48 am

comment image
On the way down
from a rise far too small to conclude the stop in warming EVER ceased.

Janice Moore
Reply to  Mat
May 1, 2017 8:50 am

Given the data we now have:
For UAH: There is no statistically significant warming since December 1993;
For RSS: There is no statistically significant warming since October 1994;
For Hadsst3: There is no statistically significant warming since May 1997.
(Source: Werner Brozek, ed. by J. T. Facts, https://wattsupwiththat.com/2017/04/11/la-nina-puzzle-now-includes-february-and-march-data/ )
the stop in warming is.

Janice Moore
Reply to  Mat
May 1, 2017 8:54 am

Warming may, indeed, resume. So far, it has not.
BOTTOM LINE:
CO2 UP. WARMING STOPPED.
This has never been explained away by the AGWers.
…. it’s a travesty that we can’t.
K.T.

jimbobby
Reply to  Mat
May 1, 2017 10:17 am

It’s like the business community talking about a “negative increase” – whichever way one looks at it CO2 is increasing whilst temperature is dropping

scraft1
Reply to  Mat
May 1, 2017 12:55 pm

Mat, UAH’s anomaly over their baseline is still .27deg. A]so the anomaly in April actually increased over March. Same is true with HadSS. NCEP anomaly actually declined from March. Anthony’s point is that temps have declined to levels a bit below those prior to the the most recent El Nino.

crackers345
Reply to  Mat
May 3, 2017 2:31 pm

Roscoe commented on Global temperatures plunge in April – “the pause” returns.
“For UAH: There is no statistically significant warming since December 1993;”
this is very false.
uah lt v6.0 warming since 1/2014 is 0.31 +/- 0.16 C (error = 95% CL), well above the 95% confidence limit
this changes with autocorrelation
but werner b has said several times he doesn’t understand a.c.
and he never includes it in his
calculations.
in my experience werner’s calculations are nothing
but meaningless numerology.

Roscoe
Reply to  crackers345
May 3, 2017 6:23 pm

The calculations were from Stokes. I’m not sure how to do the confidence intervals. It’s not straightforward statistics in this situation because of several mitigating factors.
I did, however, take the monthly changes in UAH and scale them to zero so there were equal chances of rising or falling temps. Then I randomly put together a time series with the data 1000 times.
I thought this would show the chance of replicating the observed warming very unlikely. But I was wrong.
When taken together, the four data sets (UAH GIS HADC RSS) randomly simulated more warming than actually observed 350 times!
This seemed way off to me until I thought about it more. The total UAH warming since 1993 is 0.28. The average monthly change in UAH is 0.10. There were 291 months. So all it takes is three more months of warm than cold. So if the score is 147 warm and 144 cold with an average change of 0.10, then you have exceeded your 24 year anomaly of 0.28.
Just because it’s not “statistically significant” doesn’t mean the earth isn’t warming. All trends from all data sets in the entire fossil fuel era ending in 2017 are positive. If you go back to the 1970s, the trends are almost certainly significant.
The problem is that we don’t measure global mean temperature very well. We claim that we do, but then why do the 4 data series I referenced have such different values? That indicates uncertainty which when quantified produces big standard deviations which then produces big confidence intervals and thus, low significance.
I would welcome other number crunching by people with more expertise in this problem. But I was quite convinced by the numbers I ran that the last quarter century has not met any reasonable measure of significance.

Reply to  crackers345
May 5, 2017 4:50 am


Do you have discalculia? Last I checked, 1993 looked nothing like 2014. But YMMV.

crackers345
Reply to  Mat
May 3, 2017 7:08 pm

roscoe, thanks, but i dont care where the
calculations are from. i know the math and how to
do confidence limits and include
autocorrelation and can do
my own calculations.
the results are as i stated.
trying to claim that uah shows no warming
since 1993
is just junk.

Roscoe
Reply to  crackers345
May 3, 2017 8:27 pm

crackers345
“roscoe, thanks, but i dont care … trying to claim that uah shows no warming since 1993 is just junk.”
I never claimed that UAH shows no warming. I clearly stated that it shows 0.28 deg of warming since 1993. I also pointed out numerous times that all trends in all fossil fuel era data to 2017 are warmer. On this thread, I expressed near certainty that it was statistically significant since 1993 but when I ran numbers myself, I backed off that assertion. I welcomed other calculations. You provide insults but no data.

barry
Reply to  Mat
May 4, 2017 8:06 pm

There was also no ‘statistically significant’ pause from 1998 to whenever. All trend uncertainties from 1998 overlapped with prior warming trends.
If a ‘pause’, or slowdown wants to be claimed, better to avoid statistical significance altogether and stick to the mean trend. Which is warming since 1998.

richardscourtney
Reply to  Mat
May 7, 2017 10:51 pm

barry:
You write this false news

There was also no ‘statistically significant’ pause from 1998 to whenever. All trend uncertainties from 1998 overlapped with prior warming trends.
If a ‘pause’, or slowdown wants to be claimed, better to avoid statistical significance altogether and stick to the mean trend. Which is warming since 1998.

In the unlikely event that you believe what you have written then try telling the UN Intergovernmental Panel on Climate Change (IPCC) and not us.
Box 9.2 on page 769 of Chapter 9 of IPCC the AR5 Working Group 1 (i.e. the most recent IPCC so-called science report) is here and says

Box 9.2 | Climate Models and the Hiatus in Global Mean Surface Warming of the Past 15 Years
Figure 9.8 demonstrates that 15-year-long hiatus periods are common in both the observed and CMIP5 historical GMST time series (see also Section 2.4.3, Figure 2.20; Easterling and Wehner, 2009; Liebmann et al., 2010). However, an analysis of the full suite of CMIP5 historical simulations (augmented for the period 2006–2012 by RCP4.5 simulations, Section 9.3.2) reveals that 111 out of 114 realizations show a GMST trend over 1998–2012 that is higher than the entire HadCRUT4 trend ensemble (Box 9.2 Figure 1a; CMIP5 ensemble mean trend is 0.21ºC per decade). This difference between simulated and observed trends could be caused by some combination of (a) internal climate variability, (b) missing or incorrect radiative forcing and (c) model response error. These potential sources of the difference, which are not mutually exclusive, are assessed below, as is the cause of the observed GMST trend hiatus.

GMST trend is global mean surface temperature trend.
A “hiatus” is a stop. And “the observed GMST trend hiatus” is the observed “Pause”.
Richard

mountainape5
Reply to  Bad Andrew
May 1, 2017 4:00 pm

The general trend is up, what is it that you don’t understand?

Reply to  mountainape5
May 1, 2017 4:14 pm

mountainape5,
“The general trend is up…”
And I should care because…
Andrew

mountainape5
Reply to  Bad Andrew
May 3, 2017 2:55 pm

.. lost in thoughts?

billw1984
Reply to  mountainape5
May 1, 2017 5:42 pm

The rate of the “up” is the important issue.

Another Scott
Reply to  mountainape5
May 1, 2017 7:13 pm

The general trend since….1979? 1879? 1679? The question to smug people like you is how much do you think it is caused by CO2? And are you trying to say we should radically change things to stop CO2 emissions?

Darrell Demick (home)
Reply to  mountainape5
May 1, 2017 9:13 pm

To all, please don’t let these ignorant trolls upset you. All they want is responses and unfortunately I had to respond to state the obvious.
Back into your hole, troll.

Reply to  mountainape5
May 2, 2017 4:00 am

I’ve said there has been an underlying warming trend ( thank goodness) and co2 isn’t the cause. There are several things that we know of that can cause global cooling. It’s that one thing that causes global cooling in the absence of the the others that concerns me. Or it could be, it doesn’t matter, it’s just time according to fibonacci numbers.
The predictive power of fibonacci numbers is truly astounding. That and fractal geometry.
CAGW has interwoven the argument of co2 causing the slight warming we’ve had so well, it is difficult to acknowledge that there has been some warming without acknowledging the co2 part. I do not acknowledge co2 as the cause.
Then there is if it’s been so warm, and temperature is falling, where is the heat hiding ? In the oceans ? There is a direct way of measuring that, thermal expansion. It’s not there. I do believe CAGW on thermal expansion. I did the math, and if it was as warm as it should be, we wouldn’t be measuring SLR in millimeters or some distant rise 100 years from now.

ferdberple
Reply to  mountainape5
May 2, 2017 8:56 am

The general trend is up.
================
the trend depends on your choice of starting point. for example, the trend over the past 6000 years is definitely DOWN. the same is true over the past 4 million years.

John Leggett
Reply to  mountainape5
May 2, 2017 9:45 am

Which general trend? The 65 million year trend?comment image
The 5.5 million year trend?comment image
The the Holocene trend?comment image
Perhaps you are talking about the trend since the start of the modern warm period around 1850?

Roscoe
Reply to  John Leggett
May 2, 2017 1:11 pm

I think we are discussing a fossil fuel era time scale.

Chimp
Reply to  mountainape5
May 2, 2017 1:35 pm

How about the 542 million-year trend?comment image
Also down.
As is of course too the 4.5 billion-year trend, since earth started out covered by an ocean of molten rock. However at intervals thereafter, it was also covered oceans of frozen water.

george e. smith
Reply to  mountainape5
May 3, 2017 10:09 am

The length of time over which that arbitrary trend continues is not predictable.
The “general trend” in ML CO2 is UP almost monotonically if you filter out the yearly cyclic variation.
But at times the Temperature trend is down, which is in the opposite direction to the CO2,
So the two of them cannot be tightly linked, compared to something else that can make the Temperature gdown, no matter the CO2 rise.
That’s what YOU don’t seem to understand.
G

mountainape5
Reply to  george e. smith
May 3, 2017 2:52 pm

I’m not linking the uptrend with the rise of the CO2, choosing not to see the warming for the sake of the ‘other side’ is just dumb.

Steve
Reply to  Bad Andrew
May 2, 2017 12:50 am

So funny. Measurements that show the planet has stopped warming for one month and deniers use the data. When the same organisation shows the planet keeps hitting record temperatures they are unreliable or made up or its a conspiracy. Which is it? Ha ha!

Reply to  Steve
May 2, 2017 5:27 am

“Measurements that show the planet has stopped warming for one month”
Because for one thing, it illustrates AGW as intermittent, if AGW is even possible.
So now we are to the the question is AGW even possible?
If climate science can’t explain the wiggles, it can’t explain anything.
Andrew

MarkW
Reply to  Steve
May 2, 2017 6:41 am

Temperatures have been dropping since the peak of the recent El Nino. It’s been a lot longer than one month.
What is it with these trolls and their inability to do even the most basic of research?

Gerry, England
Reply to  Steve
May 2, 2017 11:56 am

I love it when warmists don’t see the irony of what they say. Yes, the data has been fiddled but when even their corrupt data shows cooling then it must really be cooling. Well, until they fiddle it again to make it appear to be warming again.

Duster
Reply to  Steve
May 2, 2017 1:31 pm

Just as funny as using an ENSO event a a “pause buster.” The “record temperatures” are in hundredths of a degree and are not statistically significant. Also, they are the result of “adjustments” to the data. Simply the fact that the “record” requires “adjustments” to exist is evidence that the record is not robust, maybe not even real.

May 1, 2017 7:27 am

Time for some new adjustments!

Bruce Cobb
Reply to  psion (@psion)
May 1, 2017 7:30 am

And a new round of “the dog ate my global warming” excuses!

JohnKnight
Reply to  psion (@psion)
May 1, 2017 10:32 am

Prolly more warm got down deep into the ocean ; )

Auto
Reply to  JohnKnight
May 1, 2017 1:02 pm

JohnKnight
The oceans are, indeed, deep.
And wide.
The science is settled – we are told repeatedly, trying to drown out the intermittent bits of decent, observation based comment.
The whole thing is a scam – a fraud, indeed.
Auto

Trebla
May 1, 2017 7:32 am

it only “feels” cooler. The models say it’s actually warmer. Don’t be confused by your senses (and your shivering as I was yesterday)

A C Osborn
Reply to  Trebla
May 1, 2017 7:40 am

Yes we haven’t really got record breaking cold in the US and Europe, we are imagining the snow and frost as well.

Reply to  A C Osborn
May 1, 2017 7:45 am

They were only local! All over the places! /sarc

rocketscientist
Reply to  A C Osborn
May 1, 2017 8:40 am

You won’t get to record breaking cold until the continent is re-glaciated. :)…but that would be climate recurrence?

brians356
Reply to  Trebla
May 1, 2017 11:33 am

What you gonna believe, the models or your lying eyes?

commieBob
Reply to  brians356
May 1, 2017 2:45 pm

There is some evidence that people are influenced by their own experience. link
It has been observed that older people are more likely to be skeptics. link It is said that older people are more conservative. It is also true that they have more experience with the climate. I suspect that both of those factors increase skepticism. They also have more experience being lied to by politicians and experts.

If you’re not an environmental activist at 25 you have no heart, if you’re a climate alarmist at 40 you have no brain. poetic license invoked

Reply to  brians356
May 1, 2017 6:04 pm

commieBob … us older people also have more experience with failed doomsday scenarios. I survived the coming ice age scare of the 70’s. Those ‘science reports’ scared the snot out of me. When I heard Algore claim that the ‘the debate was over, the science was settled,’ I actually stood up and yelled at the radio. What debate? I don’t remember any debate! A skeptic was born.
Does anybody else remember how quiet New Year’s Eve was when we hit the year 2000? Not a lot of partying … we were scared. All the power would shut down, planes falling out of the sky. Hmmff. I know, I know … programmers were working overtime all year fixing Y2K errors. Still, can’t help but feel like I was bamboozled … again.
Ozone hole. Acid rain. Nuclear annihilation. Zombie apocalypse. The 2nd Coming was supposed to happen before the year 2000, too. (I spent 6 months in a foster home in the 60’s who were Pentecostal.)
I can’t count the number of scares I’ve lived through by now. No more! I refuse to let them scare me, again. Or guilt me out by telling me it’s my fault. PHOOEY!

Reply to  teapartygeezer
May 2, 2017 11:38 am

Does anybody else remember how quiet New Year’s Eve was when we hit the year 2000? Not a lot of partying … we were scared.

I was working. IT. A colossal bore, but necessary due to all the ones that were scared. Still, I am not upset. My income (and work hours) went up 50% in 1999 due to the scare. Not until this year did my income finally exceed that year’s income.
I knew we were safe. But it was because we started preparing for it back in the mid 90s. But the YSM did not tell you that.

andrew
Reply to  brians356
May 2, 2017 9:32 am

I wonder which climate models have cooling built into their algorithms
[All those that go unfunded the next fiscal year.
Only those that go unfunded the present fiscal year. .mod]

Reply to  brians356
May 2, 2017 12:26 pm

: That’s a great synopsis of the last 50 years worth overhyped, fearmongering, hysterical attempts at change via doom mongering. The cover of Time in our house was constantly informing me how I was going to die because of ice age/famine//lack of ‘energy’/ozone holes from mom’s hairspray/etc. The schtick wears a tad thin after a while. I’m just disappointed that you didn’t end your reply to commieBob with “…now you kids get off my lawn!”

Richard G
Reply to  Trebla
May 1, 2017 5:16 pm

My friends in Seattle say they are still waiting for Spring to arrive. They are told it will arrive mid week only to be followed by more cool damp weather on the weekend.

Ian Magness
May 1, 2017 7:39 am

How long is the pause now please? Are we anywhere near getting Monkton-style analysis showing 20+ years?

Richard M
Reply to  Ian Magness
May 1, 2017 8:44 am

Linear trends will show an upward trend due to the position of the recent El Nino. However, we know there was no warming prior to the El Nino and we have cooled back to equal or lower temperatures than existed before the El Nino. Clearly, the pause is still in effect. This is why I looked at ENSO neutral months only to get a better feeling and that analysis showed a flat trend since 1997.

tony mcleod
Reply to  Richard M
May 2, 2017 4:01 am

No child born since 1984 has experienced a month with a below average global temperature.

Reply to  tony mcleod
May 2, 2017 2:10 pm

No child born in the history of man has experienced an above average global temperature. All have experienced above, below and normal LOCAL temperatures.
Your statement is stupid.

bitchilly
Reply to  Richard M
May 2, 2017 5:08 am

those kids today do not know how lucky they are.

MarkW
Reply to  Richard M
May 2, 2017 6:42 am

Depends on how you measure average. If you use the last 3000 years instead of the last 30, we’ve been below average for several hundred years.

Reply to  Richard M
May 2, 2017 8:35 am

Tony tell me again how we are measuring the Earth’s average temperature with sufficient accuracy to “know” that?

John Leggett
Reply to  Richard M
May 2, 2017 9:51 am

tony mcleod, no child born since 10,000 BCE has experienced a month with above average global temperature.

brians356
Reply to  Ian Magness
May 1, 2017 11:35 am

It has not warmed significantly in a human generation. No kid graduating high school this month has lived through global warming. Sad!

MarkW
Reply to  brians356
May 1, 2017 12:26 pm

High school? They are half way through college already.

Jer0me
Reply to  brians356
May 1, 2017 3:56 pm

Children won’t know what warming is!

Ack
May 1, 2017 7:41 am

Ground here is covered with global warming from yesterdays storm. My poor garden…

Reply to  Ack
May 1, 2017 3:40 pm

fret not. If the ground was warm to begin with all those CO2 molecules piling up can’t help but trap the heat in your garden.

Bear
May 1, 2017 7:41 am

It must be hiding in the deep ocean (or maybe Karl’s closet).

rbabcock
May 1, 2017 7:47 am

Per Joe D’Aleo (behind a paywall, sorry), the upcoming El Niño is having some issues with warmer waters holding in the ENSO regions. Maybe a weak one or warm La Nada. Also per the last two solar cycles, the pattern on the way from peak to bottom was El Niño, La Nada, El Niño and La Niña. So far we seem to be following that pattern for this cycle as well.
We’ve gone through the first El Niño and coming up on the La Nada (although a very weak El Niño may take it’s place). Is it possible the solar cycle influences the high pressure over Darwin and low pressure over Tahiti than controls the trades in the eastern and central tropical Pacific? Will be very interesting to watch the global pressures as this solar cycle runs its course.

Reply to  rbabcock
May 1, 2017 9:10 am

rbabcock
The ENSO cycle as a whole exerts a warming effect (mainly poleward pumping of warm water by La Niña). Thus a period of climate cooling may be associated with ENSO neutrality without pronounced El Niños or La Niñas. What some authors refer to as a changed “ground state” of the Pacific.

richard verney
Reply to  rbabcock
May 1, 2017 10:13 am

It is unfortunate that last year’s very strong El Nino was not followed by a La Nina. If 2017 had been a La Nina year it would make it difficult for the IPCC to write AR6. back to back El Ninos (if that is what occurs) will give them a life line.

Reply to  richard verney
May 1, 2017 10:29 am

Richard
If we’re cheering on cooling 😎 here, then I would beg to differ. As Bob Tisdale clearly showed, a strong La Nina although causing short term SST cooling, in the longer term caused a much greater warming with almost global extent, due to a pulse of equatorial warm water being pumped poleward. This caused the big global temperature step-up after 1999. I have argued previously that the 2016 el Nino was of the Modoki type, not engaging the Bjerknes feedback and being characterised by mid Pacific rather than eastern Pacific (Peruvian) el Nino SST warming. My further prediction / guess would be that unlike the classic el-Nino – La Nina cycle, the Modoki equivalent would not ramp up global temperatures but instead lead to stasis or possibly cooling (if Pacific equatorial heat instead dissipates to space).

Crispin in Waterloo
Reply to  richard verney
May 1, 2017 11:31 am

I am with ptolemy2 on this one. The effect of continued ‘warmth’ in the E Pacific is merely showing us the loss of heat into space. Source: the ocean. Net effect: systemic cooling.

richard verney
Reply to  richard verney
May 2, 2017 1:47 am

My point is a political one.
If there is a La Nina then this has a short lived effect on temperature anomalies producing both cooler satellite data, and cooler global thermometer data.
AR6 will be written in 2017/18. I do not know what the cut off date is for the publication of papers, but if La Nina conditions were seen and continued throughout 2017 and into early 2018, then there would be further papers on the re-emergence of the pause, and/or on ever lower figures for climate sensitivity to CO2.
In fact if one looks at the model assemble (the Spencer plot), one does not need much lower temperature anomaly satellite data and balloon data running into 2018 before all the models, or at any rate all but 2 models to be outside there 95% confidence levels.
I am merely observing that if 2017 is a cool year (and this now appears unlikely given the present ENSO conditions), the IPCC would find it much more difficult to continue to maintain their position on climate sensitivity, and much difficult to skim over the problem of models running hot and the divergence with satellite data and balloon data.
With ENSO positive conditions, the IPCC will find it relatively easy to fudge this issue, as the Karl paper demonstrates.

Reply to  richard verney
May 2, 2017 1:59 am

richard verney May 1, 2017 at 10:13 am
2015-16 El Nino was followed by a weak La Nina JAS 2016 to NDJ 2017 and hence there is no question of a back to back El Nino. In 2017 there has not been and 3-monthly seasonal period with ONI index +0.5 C or more. In fact the last available ONI index is JFM 2017 which is just +0.2 C.

dmacleo
May 1, 2017 7:47 am

5-1-2017 1030am and 38 degrees here mid-maine.
lot of 32-33 deg mornings. cold is hurting even my hostas and they are pretty much nuke proof….

Richard M
Reply to  dmacleo
May 1, 2017 8:47 am

In the past week+ I’ve had two daily highs about 25°F below average with the rest of the days 10-20°F below average. Minnesota is already too cold and it is snowing in parts of the state again.

RWturner
Reply to  Richard M
May 1, 2017 9:02 am

The high temperature from around Garden City to Liberal KS was 39 degrees F below average yesterday — 36 F when average is 75 degrees. That was a heck of a winter storm, luckily the only major crop growing there right now is hard winter wheat.

Joe Hill
Reply to  dmacleo
May 1, 2017 10:44 am

The National Weather Service predicts 2-3″ snow on Mt Katahdin (elevation 5267′) today…

dmacleo
Reply to  Joe Hill
May 2, 2017 8:38 am

I forgot to see if it happened but would not surprise me.
yay it hit 42 now, yesterday 5-1-2017 never got above 38 here

Tom Halla
May 1, 2017 8:06 am

Well, it is warm here (suburban Austin TX) but it snowed yesterday in Amarillo.

MarkW
Reply to  Tom Halla
May 1, 2017 8:41 am

I heard from family that it snowed in El Paso over the weekend.

RWturner
Reply to  MarkW
May 1, 2017 8:50 am

There are currently snow drifts of 6’+ in western KS.

Harry Passfield
Reply to  Tom Halla
May 1, 2017 9:16 am

C’mon!! Tom, you had a TORNADO the other day! It was all over the news. We’ve been told it’s the end of theworld. Sheesh, how ya gonna overcome such a tragedy? I mean, AGW has hit Texas hard……hasn’t it? /s

Tom Halla
Reply to  Harry Passfield
May 1, 2017 9:23 am

There is a taste for disaster stories, just that the scenario varies depending on your backround. Whatever happened to Harold Camping? or Paul Ehrlich?

Editor
May 1, 2017 8:10 am

A difference in air temperature of 0.1 Celsius would be imperceptible to humans, but if you are a climate “scientist” or one of the other hangers-on depending upon grant money, it makes conclusive proof of AGW. Never let facts get in the way of greed.

Clif westin
Reply to  andrewmharding
May 2, 2017 5:58 am

Difficulty, the thermometers margin of error is 0.4…..I love when the data set is more precise than the instruments used to provide the data…..

Reply to  Clif westin
May 2, 2017 6:35 am

Clif. I doubt that with a standard analogue thermometer you could tell the difference between say, 20.1 or 20.0 Celsius.

May 1, 2017 8:17 am

What data series is Dr. Ryan Maue’s statement based on?

rbabcock
Reply to  Jeff in Calgary
May 1, 2017 8:50 am

The chart heading says NCEP CFSR CFSv2 http://cfs.ncep.noaa.gov/cfsr/

Mary Brown
Reply to  Jeff in Calgary
May 1, 2017 10:57 am

The global weather models are initialized every hour. A grid is established of 2mT for the whole globe. Save this data and you have a global time series in real time.
It’s a nice alternative to satellite and sfc based thermometer data but it has some issues as well… longer term doesn’t account for UHI and some other issues.

RWturner
May 1, 2017 8:49 am

Unfortunately, those of us that are saying that global temperatures are likely to decrease for the next few decades are probably going to be correct.

john harmsworth
Reply to  RWturner
May 1, 2017 3:23 pm

Pretty much a saw off. Warmer is better for nearly all the planet but then again it might finally be enough to stop the madness if we get a few decades of cooling.

Rhoda R
Reply to  john harmsworth
May 1, 2017 3:50 pm

Naw, they’re already screaming about ‘Climate Change.” As if the climate never changed before. NOW we know why Mann’s hockystick was so important.

Reply to  john harmsworth
May 2, 2017 10:15 am

John Harmsworth – I doubt it. They will either claim credit for stopping the disastrous warming – Obama has already made noises in that direction; or it will be “We told you so, AGW causes cooling, we must stop burning fossil fuels or it will get worse and we’ll all burn freeze”.
Belief in AGW is not an evidence-based position. Do you see any apologies when a religious sect says the world will end at 6:30 pm on such-and-such a date, and it doesn’t? They just move the date and start over.
Once a believer has been infected with the belief, it’s very hard to get free of it. It’s an infection, in fact, a VIRUS OF THE MIND

Richard M
May 1, 2017 8:52 am

One of the reasons the surface data is showing the cooling first is that the warmth from the open water in the Arctic takes awhile to work it’s way through the atmosphere. While temperatures have just about returned to average near the surface in the Arctic, satellite data will not reflect the loss of those warmer waters for a couple of months.

richard verney
Reply to  Richard M
May 1, 2017 10:09 am

It would appear that the satellite is less sensitive to cold SST than it is to warm SST, probably due to convection. Warm waters drive more convection and thus carry warm air up to the troposphere where the satellite measures the temperature, however, cold waters drive less convection and do not in the same way drive/carry cold air high into the troposphere.

Chimp
Reply to  Richard M
May 1, 2017 10:16 am

Reposting from David’s Greenland article today:
This year’s Arctic sea ice winter maximum was about the same as other recent years, just ever so slightly lower. What is “unprecedented” however is how slowly Arctic sea ice is melting this year.
The 30-year median melt in April is 1.175 million square kilometers. This year it was only 730,000 sq km. March melt was also lower this year.
As predicted here, sea ice extent is headed for the normal range. It’s already higher than on April 30 this year than it was in 2016 and 2015. Unusually cold Arctic SST, which even NOAA has grudgingly acknowledged but downplayed, is the main reason for the slow thaw, but air temperatures in the region are also back close to average.
http://nsidc.org/arcticseaicenews/charctic-interactive-sea-ice-graph/
Griff could still luck out on his assertion that this year was “sure” to set a new record low, if there are yet again August cyclones in the Arctic, but he has already been shown wrong that the ice would stay well below normal all year.

Bob boder
Reply to  Chimp
May 1, 2017 10:56 am

Tony Mcleod bet me that the geographical north Pole would be ice free this year, if he loses he can no longer post on WUWT. i have tried to explain to these guys that a low maximum has very little bearing on the minimum. I tried to get Griff to go for the same bet but he wouldn’t bite could have gotten 2 birds with one throw but oh well.

Chimp
Reply to  Chimp
May 1, 2017 11:06 am

Bob,
If he loses, Tony will be back, even if it means getting a new IP address. Too bad Griff didn’t bite.
You, others and I all tried to explain how sea ice works. The lower ice this winter just meant that more heat was lost to space, hence cooler water, meaning slower melt. Pretty simple, really.

Chimp
Reply to  Chimp
May 1, 2017 11:07 am

Of course, a polynya might briefly form at the North Pole. Would that count?

MarkW
Reply to  Chimp
May 1, 2017 11:08 am

What’s the definition of “ice free”? Unfortunately that is hole that you can drive a whole fleet of distractions through.

Javert Chip
Reply to  Chimp
May 1, 2017 12:49 pm

Chimp
Griff can handle that – he/she/its been below normal he/she/its entire existence

Reply to  Chimp
May 1, 2017 1:15 pm

MarkW May 1, 2017 at 11:08 am
What’s the definition of “ice free”? Unfortunately that is hole that you can drive a whole fleet of distractions through.

I believe the bet was that the north pole could be reached by sailing over open ocean, last year two research ships tied up next to the pole in open water, so it’s a far from certain bet.

MarkW
Reply to  Chimp
May 1, 2017 2:30 pm

I would have gone with something like no ice within 10 miles of the pole.

john harmsworth
Reply to  Chimp
May 1, 2017 3:32 pm

Poor Griff might have to take all the ice cubes out of his freezer and watch them melt to have a good cry!

Chimp
Reply to  Chimp
May 1, 2017 5:14 pm

Javert Chip May 1, 2017 at 12:49 pm
Funny, if not sadly so true.
What he doesn’t get is bottoming behavior. Oh, well, check that. He very may get a lot of that.
Anyway, if Arctic sea ice were a stock, now would be a good time to buy. Hasn’t made a new low since 2012, and even if it does, it won’t be much lower. It tried in 2015 and 2016, but could only about equal the first low in 2007.
The three-year intervals 2007-09, 2010-2012 and 2013-15 all averaged about the same, with one low year each. I’d expect 2016-18 to show in the same narrow range, despite getting off to a low start last year. At least one of 2017 and 2018 is liable to be a higher year, as were 2009, 2013 and 2014, or they could both end up in between, like 2008, 2010 and 2011. Three more low years like 2015 and 2016 seem improbable.

Rod Everson
Reply to  Chimp
May 2, 2017 6:15 am

Anthony, speaking of sea Ice, it’s time to retire, or drastically reduce the content of, the Sea Ice page on this site. Most of the charts don’t update due to, as I recall you explaining, a change in WordPress. It’s really a confusing mess as it stands. Too bad too, because it really was an interesting part of the site in its day.
Maybe instead of displaying half a dozen or so charts of extent and area, most of which no longer update, just pick out one or two functional ones and drop the rest? It’s particularly confusing this time of year because most of the charts quit updating about now, so they look current but the data is a year old.

Tony mcleod
Reply to  Chimp
May 3, 2017 1:12 am

Bet stands Bob.
Fly from Svaalbard to the pole an see no ice. This year.

May 1, 2017 8:56 am

In the Northern Hemisphere they plunged a massive 1°C

If Co2 is the definitive control knob, how is this even possible? Where did all that heat go if not to space, past all of that co2 that is supposed to be blocking it?

john harmsworth
Reply to  micro6500
May 1, 2017 3:34 pm

$64 question there.

Stan
Reply to  john harmsworth
May 1, 2017 5:21 pm

$64 TRILLION dollar question.

Socalpa
Reply to  micro6500
May 1, 2017 5:41 pm

Looks like the amount of human CO2 remaining n the atmosphere from us dropped since about 2000 ..If I am reading this paper correctly ..

The extra CO2 stimulated the biomass increase so much over the past decades ..a “pause” has occurred ..If this ain’t “temporary” as the author seems to believe ..Who needs ..Paris ?

Recent pause in the growth rate of atmospheric CO2 due to enhanced terrestrial carbon uptake
Nature Communications 7, Article number: 13428 (2016)
doi:10.1038/ncomms13428

“Since the start of the twenty-first century, however, the airborne fraction has been declining (−2.2% per year, P=0.07; Fig. 1b), despite the rapid increase in anthropogenic emissions (Fig. 1b).”
https://www.nature.com/articles/ncomms13428/figures/1

Mary Brown
Reply to  Socalpa
May 1, 2017 6:11 pm

You just hit on one of my pet peeves on climate models. Hansen apologists (1988 fcst) like to claim that “Scenario B” verified but that is ridiculous. Clearly the “business as usual” Scenario A happened… and then some with Chinese emissions… i call it Scenario A+
But the earth ‘ate’ a lot more of the CO2 than anticipated
So, another source of climate model error is present that no one talks about … uncertainty over emissions and how much remains in the atmosphere
Hansen essentially got lucky… Emissions were much higher than anticipated but uptake was also much higher. And his forecast still overforecast by 2.5 to one
So, in summary, climate models do a poor job with perfect CO2 input. Going forward, we have no idea what the CO2 emissions and uptake will be. That source of error is rarely acknowledged

Frederik Michiels
May 1, 2017 9:02 am

global warming destroyed my cherryblossoms with frost.
it also did damage a lot of my plants….

J
Reply to  Frederik Michiels
May 1, 2017 12:33 pm

Yup, near Chicago, first day of May, the next three of five nights will be below 40 degrees F.
Tomato seedlings in a small green house will need some extra insulation.

J Mac
May 1, 2017 9:18 am

Hmmmmmm – Man made global warming is on hiatus? Must be global manopause….
Running on the cool and very rainy side of historical averages, here in the Great NorthWet.

Science or Fiction
Reply to  J Mac
May 1, 2017 9:28 am

Mannopause …

May 1, 2017 9:48 am

I wonder how they will try to bust it this time – Karl II? Basically cooling the past temperatures to reflect a new ice age actually occurred in the 70s.

richard verney
May 1, 2017 10:04 am

The fall in temperatures may be only short lived. According to the ENSO meter, it looks like we may be in for a double El Nino.
If so, one may envisage an increase in the temperature anomaly,within the next few months. It looks as if 2017 may shape up to be another warm year. Of course, this may be the result of a natural event (ie., El Nino), rather than CO2 driven, but that will not stop the alarmists spinning the warmest year on record, or perhaps the second warmest year on record (2017) following on from the warmest year on record (2016).
The timing of a double El Nino (if that is what happens) is unfortunate given that we will soon be in the run up to AR6. It would have made the job of the IPCC far more difficult if 2017 had been a La Nina year.

richard verney
Reply to  ptolemy2
May 2, 2017 1:50 am

I have. Thanks for your observation, but see my further reply.

Chimp
Reply to  richard verney
May 1, 2017 5:26 pm

NOAA has rated 2017 as a Weak La Nina year so far.

Richard M
Reply to  richard verney
May 2, 2017 10:58 am

It is now looking like there will be no El Nino. Cooler waters showing up in Nino 1-2.

mellyrn
May 1, 2017 10:16 am

I tried to explain the temperature-anomaly graphs to a friend like this:
Imagine (I said) that the vertical axis is not tenths of a degree but tenths of a gallon, and we are adding or subtracting water from a basin. 0.1gal (about a cup and a half) in, 0.2 out, 0.3 in and so on.
Then I asked, Is this a problem? When she looked confused, I pointed out, “It depends on the size of the basin we’re talking about.
“If it’s a dishpan, it might be an issue; it could overflow. But if it’s your backyard swimming pool, the ‘gallons in/gallons out’ chart would look exactly the same — but the change is downright trivial. Even if it’s your bathtub, are you worried?”
Then I told her that, in terms of degrees of temperature, what she was being shown was the gallons in/gallons out, without any information on the size of the “basin”.
The “basin”, I said, is 288 “degrees deep”, so to speak; sort of like six/6 standard bathtubs if we’re talking gallons. Is a whole gallon, or two, a problem for six/6 standard bathtubs?
She agreed that it was not. I may finally have gotten through to her. We’ll see.

MarkW
Reply to  mellyrn
May 1, 2017 10:42 am

The difference between 40F and 90F looks pretty small when mapped on a Kelvin chart, but it means wearing a coat vs shorts and flip-flops.

Man Bearpig
Reply to  MarkW
May 1, 2017 12:33 pm

Yes, we get those fluctuations on a daily basis sometimes.

Reply to  MarkW
May 1, 2017 12:46 pm

Likewise the “measured” average temperature changes would look pretty small when graphed between 5°C and 25°C.

John@EF
May 1, 2017 11:06 am

What’s withe the desperate, hyperbolic character of this thread? “The pause” is back with a vengeance?? Hahahaa.

Richard M
Reply to  John@EF
May 1, 2017 1:53 pm

You are so right. In reality, the pause never went away. ENSO neutral months show no warming for over 20 years.

Roscoe
Reply to  Richard M
May 1, 2017 6:39 pm

Sure they do. Trend in ENSO neutral months is 1.1 deg C per century.
Here is the datacomment image

Reply to  Richard M
May 1, 2017 7:09 pm

how many centuries?

Richard M
Reply to  Richard M
May 2, 2017 11:00 am

Sorry Roscoe but your link fails. However, I suspect you are using surface data and not the much higher quality satellite data over the past 20 years which is what I used.

Roscoe
Reply to  Richard M
May 2, 2017 1:15 pm

I generally use Wood for Trees data. Skeptics always want to use UAH. Warmists want to use GISS. WTI is more robust and averages 2 surface and 2 satellite sets.

Reply to  Roscoe
May 3, 2017 1:09 pm

WFT has UAH data. If you cannot find it, look harder.

May 1, 2017 11:13 am

I won’t put too much trust in what is coming from the satellites. What is the reason, exactly, why we are now in version 6? It is globally cooling at a fairly constant rate looking at minimum and maximum temperatures.
[but for some reason nobody looks a global maxima and minima]
Minima are falling at an average rate of ca. -0.01K per annum since 2000.

MarkW
Reply to  henryp
May 1, 2017 12:29 pm

Corrections for orbital drift and adjustments for the instruments as they change over time.

Reply to  MarkW
May 1, 2017 1:18 pm

MarkW
As the sun’s polar magnetic fields fall, so would the escape of the most energetic particles also intensify a bit.
Earth’s atmosphere is protecting us against this by forming more ozone, peroxides and N-oxides. Hence, the global cooling. Unfortunately the probe material measuring your beloved data sets has no such protection. How many times can you correct for degeneration of the probes’ material until it is completely burned up?

MarkW
Reply to  MarkW
May 1, 2017 1:52 pm

My beloved?
Are you really going to go there?
Just because the data isn’t showing what you want to see is not sufficient to prove that the data is bad.
PS: You quite clearly have no idea what you are talking about. Satellites don’t degrade in the manner you describe.

Editor
Reply to  MarkW
May 2, 2017 5:29 am

From Roy Spencer’s V6 post (see above):
One might ask, Why do the satellite data have to be adjusted at all? If we had satellite instruments that (1) had rock-stable calibration, (2) lasted for many decades without any channel failures, and (3) were carried on satellites whose orbits did not change over time, then the satellite data could be processed without adjustment. But none of these things are true. Since 1979 we have had 15 satellites that lasted various lengths of time, having slightly different calibration (requiring intercalibration between satellites), some of which drifted in their calibration, slightly different channel frequencies (and thus weighting functions), and generally on satellite platforms whose orbits drift and thus observe at somewhat different local times of day in different years. All data adjustments required to correct for these changes involve decisions regarding methodology, and different methodologies will lead to somewhat different results. This is the unavoidable situation when dealing with less than perfect data.
After 25 years of producing the UAH datasets, the reasons for reprocessing are many. For example, years ago we could use certain AMSU-carrying satellites which minimized the effect of diurnal drift, which we did not explicitly correct for. That is no longer possible, and an explicit correction for diurnal drift is now necessary. The correction for diurnal drift is difficult to do well, and we have been committed to it being empirically–based, partly to provide an alternative to the RSS satellite dataset which uses a climate model for the diurnal drift adjustment.

Reply to  henryp
May 1, 2017 4:45 pm

What is the reason, exactly, why we are now in version 6?
A total of about 16 satellites used over time and different sensor systems. And in the case of UAH errors in their algorithms.

Roscoe
Reply to  Phil.
May 1, 2017 6:56 pm

The 4 main temp data series have diverged wildly since 2000. UAH RSS GISS HadCrut. The fact that they are so different yet all purport to measure the same thing is telling. Bottom line, the errors bars in global temperature measurement are much bigger than claimed. If they weren’t, all would show essentially the same thing. They don’t.

Editor
Reply to  henryp
May 2, 2017 5:25 am

If you compare the changes in UAH version 6 to the changes introduced by Karl et al, you may see why I was stuck that V6 changes are carefully considered small adjustments, whereas Karl et al felt like another “hide the decline” “do whatever it takes” to get rid of the pause. They did have to sacrifice the rate of temperature increase, but that may have directly led to the Paris CoP attempt to reduce the rate of temperature increase from 2C° to 1.5°
The V6 changes are at http://www.drroyspencer.com/2015/04/version-6-0-of-the-uah-temperature-dataset-released-new-lt-trend-0-11-cdecade/

Joe Bastardi
May 1, 2017 11:24 am

Most of the warming is in the arctic regions in their winters anyway. Where humans live warming has been much less in the past 50 years but the global temp skewed by the arctic. This provides a huge hint as to why its water vapor, since increases in water vapor make have a much larger effect on where its cold and dry. So warming of the oceans, which is handled nicely in Grays paper,
http://tropical.atmos.colostate.edu/Includes/Documents/Publications/gray2012.pdf
and is a product of scales as long as centuries in the making, with yearly oscillations such as enso events, releasing more water vapor into the air which gets transported into the arctic ( and antarctic) are causing the global temps to be skewed since the increase in the arctic temps in winter time ( see DMI) vs summer are actually telling the true story! ( MUCH ADO ABOUT NOTHING) You know when it comes down to it, it seems as usual this by Mencken is spot on “The whole aim of practical politics is to keep the populace alarmed — and hence clamorous to be led to safety — by menacing it with an endless series of hobgoblins, all of them imaginary.” And, “The urge to save humanity is almost always only a false face for the urge to rule it.”
the problem of course is we have a media and committed despotic zealots that have another agenda and are simply using this for it

J Mac
Reply to  Joe Bastardi
May 1, 2017 11:47 am

Thanks for the link, Joe!

Chimp
Reply to  Joe Bastardi
May 1, 2017 11:55 am

Well said, and thanks!
RIP Dr. William M. “Bill” Gray, Father of Hurricanology and brave climate change skeptic, gone just over a year now (1929–2016). A huge loss to the world and science.

Reply to  Joe Bastardi
May 1, 2017 12:34 pm

Joe
true enough
warming in the Arctic has been more than normal, but in Antarctica there has been no warming lately.
My results are also showing that there was no warming in the SH but warming in the NH was about 0.024K/annum giving me an average of 0.012K/annum over the past 40 years.
My point is that the warming is – and never was – ‘global’ and it probably won’t last for too much longer.
Hence the theory of global warming [by man] is fake.
Let me tell you what my theory is.
Come down 1 km into a gold mine here and notice the sweat coming down your face. How big is that elephant in our room? It is big. Real big. Going by the movement of the magnetic north pole, that elephant has been moving. Quite a distance. North east……

MarkW
Reply to  henryp
May 1, 2017 1:53 pm

You aren’t going to try and push that core moving nonsense yet again?

Richard M
Reply to  Joe Bastardi
May 1, 2017 1:59 pm

The biggest reason for the warmer arctic ocean is the positive phase of the AMO which started about 1995.comment image?itok=1Kdwhlgn
One could also give an assist to volcanism along the Gakkel Ridge.
https://www.nature.com/nature/journal/v409/n6822/full/409808a0.html

Socalpa
Reply to  Joe Bastardi
May 1, 2017 5:49 pm

Joe, have you seen this new “pause” paper ? Not ,not that “pause” .although it is also mentioned .. The pause in atmospheric fraction CO2 remaining from our emissions .. Planetary Biomass growth of past decades big enough to start wiping out our emissions faster than we pump em out !

Am I reading this correctly ?

Recent pause in the growth rate of atmospheric CO2 due to enhanced terrestrial carbon uptake
Nature Communications 7, Article number: 13428 (2016)
doi:10.1038/ncomms13428
https://www.nature.com/articles/ncomms13428/figures/1
“Since the start of the twenty-first century, however, the airborne fraction has been declining (−2.2% per year, P=0.07; Fig. 1b), despite the rapid increase in anthropogenic emissions (Fig. 1b).”

RockyRoad
Reply to  Socalpa
May 2, 2017 5:43 am

Yes, some day governments will wake up to the benefits of CO2 and REQUIRE the burning of fossil fuels to keep CO2 levels high.
The current benefit of elevated CO2 in the past 50 years is ~$200 per person on the earth just in foodstuff production alone.

Roscoe
May 1, 2017 11:31 am

Not so fast, my friends…
The headline and data presented here are misleading. First, the CFS data that Maue is referencing only dropped 0.18 deg from March to April on a monthly average basis.
Temps in Feb and March were really hot. All the April cooling did was take us back to levels from last summer and fall.
………………
Also, since Jan 1, 2000, these are the temperature trends in deg C per century…
HadCrut 1.59
GISS 2.24
RSS 1.01
UAH 1.12
CFS 0.15
………………
It is obvious there was a “pause” in the warming somewhere in the 1998-2014 window but the el nino spike in 2015-2016 was pretty impressive and it’s not obvious yet if that will abate completely or be a “step up”.
………………
Since Jan 1, 1979, these are the temperature trends in deg C per century…
HadCrut 1.72
GISS 2.18
RSS 1.35
UAH 1.26
CFS 0.90
………………
Interesting that the warming rates are so different. Calls into question our ability to accurately measure global temp. Is the noise greater than the signal?
……….
A couple of other hot items
… global sea ice dropped more than 3 std deviations below mean last year for the first time ever.
… the CRN data… pristine data network of sensors in the USA, has a trend line of +6.2 deg C per century since Jan 1, 2005.
I see no reason for skeptics to be jumping for joy here. The data are still pretty hot.

Mark T
Reply to  Roscoe
May 1, 2017 2:53 pm

There’s never a reason to jump for joy when temperatures are falling. A warmer world is a better world for life to thrive. This is why I was a bit baffled by Ryan Maue’s statement “Some good news to end April.” I don’t think this is good news at all.

Another Scott
Reply to  Roscoe
May 1, 2017 8:05 pm

We’re not jumping for joy. It’s just that CO2 activists are an oppressive bunch trying to control the world, literally.

Ted
Reply to  Roscoe
May 1, 2017 8:06 pm

The IPCC models said that the best estimate of warming with the current scenario of increasing CO2 levels was 4.0 deg Celsius this century, with a likely range of 2.4 to 6.4 degrees C per century. Even with the just completed El Nino, the data sets show none of the trends are within the lower bounds of the projections. If “pretty hot” is colder than the minimum warming expected by dozens of different models created based on the same hypothesis, shouldn’t the skeptics at least feel validated?
https://www.ipcc.ch/publications_and_data/ar4/wg1/en/spmsspm-projections-of.html

Roscoe
Reply to  Ted
May 1, 2017 8:48 pm

My point is that the temperature trend is higher despite claims to the contrary here. Model performance is a whole different animal.

HAS
Reply to  Roscoe
May 2, 2017 12:14 am

I was curious about the CRN report, so I went and eyeballed it and put a trend line through the annual averages. You can rest assured there is no significant trend at 90% confidence levels, although the residues don’t look well behaved.
You can sense this just by looking.

Roscoe
Reply to  HAS
May 2, 2017 6:24 am

The trend is +6 deg C per century. I didn’t eyeball it. I calculated it. I have not calculated the significance. It is only 12 or 13 years old.

HAS
Reply to  HAS
May 2, 2017 6:27 pm

I guess the point is we are agreed that the trend you cited as a “hot item” isn’t significant. It also appears that you understand that short time periods that bounce around are unlikely to be particularly meaningful, so why present it as such?

Rex Wellington
May 1, 2017 12:01 pm

When there are reports of rising temperatures, do they mean rising
temperatures, or do they mean rising mean temperatures? There is
a difference. After all, if night times are less cold than before, this
will result in an increase in the mean temperature. And consider Day 1
with a range of 10-20, and Day 2 with a range of 12-19. Day 1 has the
higher maximum temperature, and Day 2 has the higher mean temperature.
Perhaps someone can tell me which of these two is the ‘hottest’, a term
now much favoured by climate scientists, to their eternal discredit.

Reply to  Rex Wellington
May 1, 2017 12:16 pm

When there are reports of rising temperatures, do they mean rising
temperatures, or do they mean rising mean temperatures? There is
a difference.

I’ve been asking this for years. They are only reporting mean temps. Plus, we can have the same issue during the changing seasons.

john harmsworth
Reply to  micro6500
May 1, 2017 4:02 pm

I will answer with a question of my own. Which has more heat, bare ground at -10C or 2 feet of snow in the same location at -5C? A greater combination of increased air temp and sunshine will be required to warm the -5 situation but IPCC geniuses don’t think about this very hard. I think it probably matters when Antarctica is adding billions of tons of snow every year. This mass is a huge reserve of negative enthalpy. Recent reports indicate that Greenland is also adding mass. Higher air temperatures add moisture to the air which falls as rain and snow. Rain saturated ground likewise offsets higher air temps but the IPCC seems unaware of phase change impact on short term readings, preferring to think everything is worse than they thought.

Reply to  john harmsworth
May 1, 2017 4:55 pm

I got a logging ir thermometer, and a logging weather stationcomment image to go with the air force’s daily station data

Reply to  Rex Wellington
May 2, 2017 5:00 am

Global minimum and maximum land temperatures have increased at a similar rate since 1970, but TMin increased more than TMax earlier on. pic.twitter.com/QL3pZALyiz— Zeke Hausfather (@hausfath) April 20, 2017

//platform.twitter.com/widgets.js

Chimp
May 1, 2017 12:41 pm

Here are the UAH anomalies for Aprils since the last super El Nino:
1997: -0.26
1998: 0.74
1999: 0.01
2000: 0.05
2001: 0.20 Warmer
2002: 0.23 W
2003: 0.15 Cooler
2004: 0.14 C
2005: 0.33 W
2006: 0.07 C
2007: 0.14 W
2008: -0.13 C
2009: -0.01 C
2010: 0.32 W
2011: -0.04 C
2012: 0.11 W
2013: 0.05 C
2014: 0.11 W
2015: 0.08 C
2016: 0.71 W
2017: 0.27 C
For April at least, the 2016 El Nino was cooler than the 1998. In this century (2001-17, incl), eight years have been warmer than the preceding year, while nine have been cooler.
Median for this century is +0.14. Aprils ranked from coolest to warmest:
2008: -0.13
2011: -0.04
2009: -0.01
2013: 0.05
2006: 0.07
2015: 0.08
2012: 0.11
2014: 0.11
2007: 0.14
2004: 0.14
2003: 0.15
2001: 0.20
2002: 0.23
2017: 0.27
2010: 0.32
2005: 0.33
2016: 0.71

Chimp
Reply to  Chimp
May 1, 2017 12:55 pm

Note that the eight coolest Aprils of the seventeen all occurred 2008-15, ie later in the century. Of the nine warmest Aprils, most were weak (2004-05 & 2006-07), moderate (2002-03 & 2009-10) or very strong (2015-16) El Nino years..
http://ggweather.com/enso/oni.htm

Chimp
Reply to  Chimp
May 1, 2017 1:00 pm

And, yes, I know that the peak heat of the 2016 El Nino (Feb) was higher than for 1998 (Apr).

Chimp
Reply to  Chimp
May 1, 2017 1:25 pm

Thirteen-month drop after 2016 El Nino peak (Feb): 0.64 degrees.
Thirteen-month drop after 1998 El Nino peak (Apr): 0.78 degrees.
Setting aside the fact of different months, note that the 2016 peak was 0.09 degrees warmer than in 1998, and the drop 0.06 greater in 1998 than 2016. If these differences be entirely due to manmade GHGs, which of course they aren’t, then the fingerprint is tiny and of no concern. It’s a good thing.
Warming of 0.09 degrees in 18 years means 0.5 degrees per century.

Chimp
Reply to  Chimp
May 1, 2017 2:15 pm

ENSO between the VSENs:
1997-98: Very Strong El Niño
1998-99:
1999-2000:
2000-01: Weak La Niña
2001-02:
2002-03: Moderate El Niño
2003-04:
2004-05: Weak El Niño
2005-06:
2006-07: Weak El Niño
2007-08: Moderate La Niña
2008-09:
2009-10: Moderate El Niño
2010-11: Moderate La Niña
2011-12: Weak La Niña
2012-13:
2013-14:
2014-15:
2015-16: Very Strong El Niño
2016-17: Weak La Niña
http://ggweather.com/enso/oni.png
Nine La Nadas, four La Niñas (not Las Niñas) and four El Niños between the two VSENs. That the 2016 VSEN was followed by a La Niña rather than a La Nada is IMO noteworthy.
Also a longer time between VSENs. Eighteen years from 1998 to 2016, versus fifteen years from the previous one in 1983.
Not what you’d expect to see in a warming world, IMO.

James at 48
May 1, 2017 12:43 pm

We had a terrible April here on the US West Coast. Finally, a few days of warmth to kick off May. Until Th … then … back to more dreary conditions again.

Chimp
Reply to  James at 48
May 1, 2017 12:56 pm

Dreary, cold, rainy and windy, even here in the Intermountain West.

Dyugle
May 1, 2017 1:34 pm

Alarmist: Come on, the heat has gone into the oceans!!!
Denier: But if it goes into the oceans it will take thousands of years for the energy balance that you calculated to heat them a couple of degrees. So we got lots of time to wait and see.
Alarmist: NO, I meant the heat only goes into the atmosphere and just the very surface of the oceans.
Denier: But with no heat in the oceans how will the oceans rise without thermal expansion?
Alarmist: NO you are not listening, we separate out our arguments so that we can win each one independently but if you insist on putting them together and pointing out contradictions then we fall back to, “97% of scientists bla bla bla” and good old character assassination so no one will take you seriously. So we still win. Have a nice day.
Denier: Crap, I didn’t know that was how it worked, silly me.

Mark
May 1, 2017 1:49 pm

This is all [ridiculous]. It cooled from 1940 to 1975 and now has rebounded back to 1940 temperatures. Someone needs to explain how human co2 is involved…

jon
Reply to  Mark
May 1, 2017 2:21 pm

That’s easy Mark, if people don’t manufacture CO2 in their blood they stop breathing and die. Then there is no measurement of temperature and all that is left is the climate models still running on the computers powered by nuclear energy. So, NO CO2>NO PEOPLE>NO AGW

jon
May 1, 2017 2:17 pm

Bad Andrew “Mat, the line squiggled downward. Isn’t that cooling? Or is everything warming no matter which way the line goes?”
Yes it is so long as you compare it with a temperature lower than the squiggly line eg pre-1998.
Until the temperature drops below 1998 then all that changes is the rate of warming. That rate is falling and will do so even if the line temperature still. That is because the longer the temperature “pauses” the lower the angle of the trend line (from 1998) on the graph is.

Reply to  jon
May 1, 2017 4:18 pm

“Yes it is so long as you compare it with…”
Oh I see. As long as you compare it THIS way. So why 1998? Is there no history before then?
Andrew

Crispin in Waterloo
May 1, 2017 2:20 pm

This is too funny:
http://www.breitbart.com/environment/2017/05/01/monster-snowstorm-colorado-climate-change/
During the round of protests about global warming this event was cancelled because of the severe snowstorm warning.
“The event, organized by local environmentalist group 350 Colorado Springs, was also a protest against the Trump administration’s policies on climate change.
“However, the march was postponed until Sunday after weather forecasters predicted heavy snowfall and possible blizzards.”

Resourceguy
May 1, 2017 2:28 pm

It’s not real unless HuffPo says so.

David S
May 1, 2017 3:35 pm

I’m waiting for the warmists to claim that the measures taken so far in relation to reducing emissions is starting to impact on the climate as evidenced by this latest fall in temperature.

1sky1
May 1, 2017 3:39 pm

Given the volatility of monthly anomalies, it’s much too early to infer any substantial change in longer-term climatic status for the globe. In the LT data, the anomaly continues to fluctuate around ~0.25 C. Noteworthy change would require, at the very least, a sojourn of several months consistently below that level. We have not seen such behavior for nearly a decade now.

Chimp
Reply to  1sky1
May 1, 2017 4:03 pm

Temperature has been flat for at least the past 20 years. Here are the Aprils, a good month to choose as in the spring and by chance to height of the 1998 El Nino, which awards an automatic extra “Warmer” YoY change. Please note lack of trend:
1998: 0.74 Warmer
1999: 0.01 Cooler
2000: 0.05 Warmer
2001: 0.20 Warmer
2002: 0.23 Warmer
2003: 0.15 Cooler
2004: 0.14 Cooler
2005: 0.33 Warmer
2006: 0.07 Cooler
2007: 0.14 Warmer
2008: -0.13 Cooler
2009: -0.01 Cooler
2010: 0.32 Warmer
2011: -0.04 Cooler
2012: 0.11 Warmer
2013: 0.05 Cooler
2014: 0.11 Warmer
2015: 0.08 Cooler
2016: 0.71 Warmer
2017: 0.27 Cooler
Ten Aprils warmer than the previous year’s April and ten cooler. For the past decade, six cooler Aprils and four warmer, despite the super El Nino last year.
Given the rise in CO2 during these two decades and the previous five or six decades, during most of which time the globe cooled, AGW can be considered well and truly falsified. Or would be if “climate science” were actually science.

Chimp
Reply to  Chimp
May 1, 2017 4:08 pm

By chance “to include the” height. Sorry.

Chimp
Reply to  Chimp
May 1, 2017 4:32 pm

1) Wait for the temporary effect of the super El Nino to wear off. As noted above, 2016 was just 0.09 degree C warmer in its peak month than the 1998 super El Nino, with flatness between them. IOW, no statistically significant warming for at least 20 years.
2) GISTEMP is a pack of lies, so doesn’t count.

Chimp
Reply to  Chimp
May 1, 2017 4:35 pm

Oops! Forgot to mention that starting in 1997 is bogus, since that was a cool year. Its April anomaly was -0.26. I said 20 years, not 21.

Chimp
Reply to  Chimp
May 1, 2017 4:55 pm

Nope. I’m right right now.
A gain of 0.09 degrees C in 18 years is not statistically significant, as I said. Hence, no trend.
In any case, even if you consider that tiny increase to be SS at some confidence level, how can a rate of 0.5 degrees C in a century be a worry to any sane person?

Chimp
Reply to  Chimp
May 1, 2017 5:01 pm

I should have said Spring in the NH and Fall in the SH. Same applies to both seasons, being neither hot nor cold.

Socalpa
Reply to  Chimp
May 1, 2017 6:06 pm

Emissions have risen ,but the increasing biomass sinks have been wiping the airborne fraction out …Mother Earths appetite …stimulated . Any way another “pause” to think about ! I found this about a week ago cross referencing on the increasing marine phytoplankton ..enjoy !

From: Recent pause in the growth rate of atmospheric CO2 due to enhanced terrestrial carbon uptake
“Since the start of the twenty-first century, however, the airborne fraction has been declining (−2.2% per year, P=0.07; Fig. 1b), despite the rapid increase in anthropogenic emissions (Fig. 1b).”
https://www.nature.com/articles/ncomms13428/figures/1

Roscoe
Reply to  Chimp
May 1, 2017 6:50 pm

If you plot just Aprils for the last twenty years, the trend is still up.comment image
It is up in just ENSO years. It is up for just April. It is up for all months. The trend is just up.

Chimp
Reply to  Chimp
May 2, 2017 1:45 pm

Roscoe May 1, 2017 at 6:50 pm
As I already pointed out, that is 21 Aprils, and 1997 was unusually cold, so it’s a cherry pick.

David
May 1, 2017 4:38 pm

We have been paused essentially since the start of a warm AMO. Remind me again of what happens when the AMO turns cold again?

Chimp
May 1, 2017 4:59 pm

Same principle applies. To be 20 years, I need 20 Aprils. April 1997 was a freak, colder than any subsequent April by .13 degrees C, ie -0.26 v. -0.13 in 2008, ie twice as negative an anomaly.

Chimp
Reply to  Chimp
May 1, 2017 5:18 pm

No need for you to keep trying. You can’t get a statistically significant plot.
Here’s mine:
http://woodfortrees.org/graph/uah6/from:1998/plot/uah6/from:1998/trend
The lack or trend is my friend.

Roscoe
Reply to  Chimp
May 1, 2017 5:50 pm

Starting point bias AND data set bias and you still get an uptrend.
We had a pause. The overall trend clearly is up.

Chimp
Reply to  Chimp
May 1, 2017 5:28 pm

Obviously, I can’t do that using annual data.
But if you plot a trend from April 1998 to April 2017 in monthly data, it will look more like the one I posted. As I said, using 1997 is cherry picking, due its coolness.

Roscoe
Reply to  Chimp
May 1, 2017 5:54 pm

1998 is cherry picking due to its warmness
Virtually any period of time to the present using a robust data set (WTI) shows a clear warming trend

Roscoe
Reply to  Chimp
May 1, 2017 6:58 pm

so does thiscomment image

Reply to  Chimp
May 2, 2017 5:38 am

“We had a pause.”
AGW is intermittent, then. If it stops once, it will stop again.
Andrew

Reply to  Chimp
May 2, 2017 11:48 am

No, if your premise is “in the past 20 years”, then April 1998 IS the starting year. You can reject the premise for other reasons, however, changing the time frame to 21 years is not conforming to the original premise of “the past 20 years”.
You are wrong.

Richard M
Reply to  Chimp
May 2, 2017 12:53 pm

UAH6 only goes through October 2016. It appears many people are unaware of this problem.

Reply to  Chimp
May 3, 2017 1:24 pm

20. He is counting ONLY Aprils. Use your fingers and toes. You will find 20 Aprils from April 1998 to April 2017.
1st grade math.

Stan
May 1, 2017 5:14 pm

“Good news”??? I prefer it when it is warmer! (And history has shown that civilisation advances and living standards improve when it is warmer.)

Chris Hanley
Reply to  Stan
May 1, 2017 6:43 pm

To the climate cultists it’s unequivocally bad news because they are longing for their cherished climate catastrophe millenarianist-style, behinds they so want to be right — for a change.

Chris Hanley
Reply to  Chris Hanley
May 1, 2017 8:30 pm

I thought I typed ‘besides’ but this computer has a mind of its own.

Socalpa
May 1, 2017 6:17 pm

New to posting here , has this been reviewed ? The other “pause” ? In Airborne CO2 .. bio mass increases ,absorbing CO2 . from the air,much faster than predicted .. If this effect continues to rise ,who needs /Paris ? .
Excerpt ‘
“Since the start of the twenty-first century, however, the airborne fraction has been declining (−2.2% per year, P=0.07; Fig. 1b), despite the rapid increase in anthropogenic emissions (Fig. 1b)”
From: Recent pause in the growth rate of atmospheric CO2 due to enhanced terrestrial carbon uptake

Figure 1: Changes in the airborne fraction and the CO2 growth rate.
https://www.nature.com/articles/ncomms13428/figures/1

If already covered , on WUWT ,send a link ,please ..you guys are usually way ahead of the curve ..

May 1, 2017 7:11 pm

If of interest, since 2008 I’ve maintained a rolling monthly update of temperatures at the 32 oldest weather stations in Western Australia and compared the results with averages recorded at those locations in the late 19th to early 20th century.
My update yesterday showed the averaged minima across WA from May 2016 to April 2017 was 0.1C warmer than the consistent baseline average circa 1900. Averaged maxima were 0.36C warmer, resulting in a mean temp 0.23C warmer than a century ago.
Compared to the 12 months of 2013, the averaged minimum in WA at the 32 stations in the 12 months to yesterday was 1.13C cooler and average max was 1.11C cooler. WA hasn’t been anywhere near this chilly since my circa 1900 comparisons began with the 12 month average to March 2009.
Sea surface temperature anomalies in the Indian Ocean to the west and the Southern Ocean to south of WA have consistently been from 1C to 2C below the NOAA baseline average since early last year. BoM data suggest the September 2016 monthly mean temperature averaged from WA’s 25 ACORN station was the coldest on record for that month.
Yesterday’s calculation of the 12 month rolling average had a start month of May last year, by which time the late 2015 El Nino heat had pretty well been washed out, and it’ll be interesting to see if the chill continues.
According to the BoM, the south of WA had well below average rainfall in April with the north and interior of the state above average. Officially, the statewide maximum was 0.15C above average and minima were 0.33C below average. i.e. the mean temp in WA was -0.09C below average in April.
The Eyre weather station abutting the Southern Ocean had its lowest April mean daily minimum temperature since records began 57 years ago.
According to the most recent ACORN data, the mean temperature across WA was -0.07C below the 1961-90 average in the six months from September 2016 to February 2017.

Reply to  waclimate
May 1, 2017 8:56 pm

Cold here in northeast Texas
Lots of hail and tornados from cold fronts blowing through

Reply to  fobdangerclose
May 3, 2017 4:14 am

I am from down under , down the bottom of down under, autumn, it is bloody cold at night, plenty of rain and wind, many days not pleasant. Where is this global warming we are told about, my Harley is rusting in the shed from lack of use.

May 1, 2017 7:24 pm

you KNOW the gig is up when the NSIDC is forced to admit that the arctic is again within 2 SD of mean while heir Trump is in office. and, of course, while the danes claim arctic temps are…..average.

Roscoe
May 1, 2017 7:31 pm

Let’s do the best cherry picking we can…
Pick the hottest el Nino month for the start. April 1998.
Now, choose the coldest data series you can find. That is UAH.comment image
Amazingly, still warming trend.

Richard M
Reply to  Roscoe
May 2, 2017 1:04 pm

Roscoe, since the 1998 El Nino is followed by 3 La Nina years there is no way it can be a cherry pick. You get all or none. Simple math. The trend is the same from 1998 as it is from 2001.
http://www.woodfortrees.org/plot/rss/from:1998/to/plot/rss/from:2001/to:2015/trend/plot/rss/from:1998/to:2015/trend
You also seem oblivious to the fact that your links return the following error ….
This site can’t provide a secure connection
i53i.imgup.net sent an invalid response.
You also clearly don’t know WFT does not track UAH6 after 10/2016.
You really should try and get your act together.

Roscoe
Reply to  Richard M
May 2, 2017 1:23 pm

Sorry for the broken link. Worked fine yesterday.
I would love it if somebody here would post a trend line of global temperature data that is negative with the following parameters…
…at least 3 years in length
… ending at the current time
… in the fossil fuel era
I can’t find one. All periods with all data in the fossil fuel era have rising temperature trends.

Roscoe
Reply to  Roscoe
May 2, 2017 1:27 pm

I clicked on the link to data. Works fine for me.
We internally calculate Wood For Trees (WTI) using simple average of GISS HadCrut UAH RSS
Did WTI drop UAH from their calculation as of Oct 2016? Why? Did they replace it with something else?

Roscoe
Reply to  Roscoe
May 2, 2017 1:39 pm

Richard M …
I thought I did the best cherry-picking possible starting from the hottest el nino month in 1998. But you are an amazing cherry picker… posting a graph from the height of 1998 el nino to the bottom of the trough in 2015 before the 2016 super el nino. Impressive.
http://www.woodfortrees.org/plot/rss/from:1998/to/plot/rss/from:2001/to:2015/trend/plot/rss/from:1998/to:2015/trend
Try generating a graph… any graph longer than 3 years in the fossil fuel era that ends in 2017… that shows a negative trend line.
“Simple math. The trend is the same from 1998 as it is from 2001.”
The trend changes every time you change the period of data which, of course, makes cherry picking very possible as you have proven so astutely.

Reply to  Roscoe
May 3, 2017 6:42 am

Roscoe, its actually ever so slightly negative going back from 2016.
http://www.woodfortrees.org/plot/rss/from:1998/to/plot/rss/from:2001/to:2016/trend/plot/rss/from:1998/to:2016/trend
You repeatedly say this is cherry picking but there are two important points about this. At the time in 2016 it wasn’t cherry picking, it was simply looking backwards from the “present” for “as far as one could” to see how far one could go with no warming. That no longer applies and it is now a cherry pick to choose the period.
But more importantly Ben Santer did an analysis of warming trends as seen in the GCMs and found that for unforced runs, it was very unlikely that 17 years of satellite observations could pass with no warming because the unforced model runs didn’t show it 95% of the time. The period (cherry picked or not) represents a period of observation that the models didn’t predict because they always showed warming.
The period of 18 years of zero warming (or slight cooling) no matter how its chosen, falsifies the models.

Brett Keane
May 1, 2017 8:24 pm

All those trolls above are wrong of course, because our no-significant warming period is calculated BACKWARDS from the present. ‘Cherry-picking is not possible, it just runs as far as it can. Trolls, you are out of your depth. Now, back under your bridge….

Roscoe
Reply to  Brett Keane
May 1, 2017 8:52 pm

Of course cherry picking is possible. The temp trend depends on start date and data set.
Can you demonstrate a period of time, going backwards, where the trend is not positive?

Reply to  Roscoe
May 1, 2017 9:32 pm

CO2 is a plant food
Prove it’s not !

Roscoe
Reply to  fobdangerclose
May 2, 2017 6:22 am

Yes, CO2 is a proven plant food. I said nothing about CO2

tony mcleod
Reply to  Roscoe
May 2, 2017 4:30 am

Such a silly statement. Almost a silly as: Oxygen is animal food. Meaningless.

Roscoe
Reply to  tony mcleod
May 2, 2017 6:28 am

“Can you demonstrate a period of time, going backwards, where the trend is not positive?”
In other words, you cannot.

Reply to  tony mcleod
May 2, 2017 2:11 pm

Silliest – Experiencing a global temperature.

May 1, 2017 9:47 pm

Late spring snow damage to USA wheat causes s record increase in wheat futures on the Chicago exchange:
https://www.iceagenow.info/wheat-futures-surge-freak-snowstorm-blankets-midwest/
That’s a record that matters.
Up to 100 million bushels of production will be lost.
According to the old Chinese saying. “there is only one reality and that is hunger”.

Sara
Reply to  ptolemy2
May 2, 2017 9:39 am

Damn! There goes my bread budget! How much is that going to drive up the cost of raisin bread??? And in France, they’re having a frost on the wine vines. Does the mean the end of Beaujolais Villages?

TA
Reply to  Sara
May 2, 2017 11:34 am

The vanilla bean crop just took a hard hit, and prices are expected to soar.

Chimp
Reply to  ptolemy2
May 2, 2017 1:24 pm

Zero Hedge is not a reliable source.
The markets today show no follow through:
https://www.ams.usda.gov/mnreports/jo_gr110.txt

Rob
May 1, 2017 10:15 pm

I’ve been noting consistent, and rather spectacular cold across Russia, all of Europe and the Mediterranean throughout April in the twice daily NCEP GFS outputs. Looks to
continue. With unseasonably chilly conditions spreading to the Eastern U.S. in May.

May 1, 2017 11:03 pm

Some good news to end April, global temperature anomaly has fallen to only +0.1°C today (snapshot) … graphic is like stock market trace.
Ain’t that good news!

May 2, 2017 5:48 am

“Amazingly, still warming trend.”
And this is the reason Warmers dismiss the squiggles. Their marketing m.o. is to use a generalized trend as their sales pitch. Of course, a generalized trend could be caused by many different things. So the more general you choose to get, the farther away from science you go.
Andrew

mountainape5
Reply to  Bad Andrew
May 2, 2017 3:02 pm

Well the warming trend is up, it’s probably natural and has nothing to do with CO2 but denying it makes you the other side of the same coin aka warmists.

crackers345
Reply to  mountainape5
May 2, 2017 3:59 pm

why is it “probably natural?”
naturally caused by what?

Reply to  crackers345
May 2, 2017 7:17 pm

naturally caused by what?

decadal ocean cycles. Alters the distribution of water vapor across the various land masses, and min temps just follows dew point temperature.

mountainape5
Reply to  crackers345
May 3, 2017 2:54 pm

It’s “natural” until we find the real scientific reason since obviously CO2 is not the cause.

Reply to  mountainape5
May 3, 2017 5:43 am

mountainape5,
I’m not denying a warming trend. But a generalized warming trend by itself (no context or verifiable explanation) doesn’t really mean anything. If you believe the squiggly lines indicate something (I don’t necessarily think they do) there’s lots of warming and cooling squiggling going on that needs a scientific explanation, and climate science doesn’t provide any. It provides speculations. Big deal. Any half-wit can do that.
Andrew

Sara
May 2, 2017 9:43 am

I do make notes on daytime temps, especially when they seem to lag behind the ‘average’ (and they do now, consistently, and I’m in northeastern Illinois). I also note when I start the furnace and when I shut it off. It’s May 2nd, the furnace is still on, and it was snowing in Wisconsin when I got up this morning.
Now, about that wheat problem: is that hard red winter wheat? That’s rather durable, starts sprouting in late January or February, but I guess it depends on where it’s planted. At least the cost of butter is down.

crackers345
Reply to  Sara
May 2, 2017 4:13 pm

if you only make notes when temperatures are below average, aren’t
you getting a biased
picture?

Matt G
May 2, 2017 10:47 am

With no La Nina currently this indicates that the strong El Niño recently has not caused a step up in global temperatures and may in the near future cause a step down. The energy loss from the El Nino to the atmosphere and eventually space, does look greater than the energy intake over the recent period.

Donald
May 2, 2017 3:04 pm

That’s odd… usually around this time of the month, the UAH numbers and analysis are re-posted.
So, instead of seeing the UAH analysis, and an increase in April of 0.08C over the March number, we get this.
Odd.

crackers345
Reply to  Donald
May 2, 2017 3:58 pm

any port in
a storm

Chimp
Reply to  Donald
May 2, 2017 4:29 pm

Why odd?
March-April Change in UAH Temperature Anomaly, Degrees C
1998: 0.27
1999: 0.03
2000: 0.06
2001: 0.15
2002: -0.01
2003: 0.00
2004: -0.21
2005: 0.14
2006: -0.09
2007: -0.12
2008: 0.01
2009: -0.04
2010: -0.19
2011: 0.14
2012: 0.15
2013: -0.05
2014: 0.02
2015: -0.09
2016: -0.02
2017: 0.08
Nine coolings or negative anomalies, one no change, five warming single hundredth digits and five warming double hundredth digits, ie positive anomalies. This year’s change isn’t unusual. Five of the 20 years showed more warming from March to April.

crackers345
May 2, 2017 3:57 pm

april’s temperature anomaly increased according to uah.
if maue wants a say, he can try and publish his methodology in the peer reviewed literature.
and let’s not pretend that one month defines a “pause.” jesus, talk about desperate.

May 2, 2017 4:13 pm
Chimp
Reply to  co2islife
May 2, 2017 4:32 pm

Four and 13-month moving averages are used in financial market analysis, too. Thirteen includes both the latest month and the same month in the prior year.

May 2, 2017 8:29 pm

If you use “believe” and “science” in the same argument, then you have probably constructed an oxymoronic argument. You might have a certain level of conviction based on the evidence, but if the evidence changes (which invariably it does) you better be ready to change the level and basis of your conviction. Otherwise, well, it’s called religion.

Reply to  Kurtis Fechtmeyer (@Fechtmeyer)
May 4, 2017 4:59 am

Perfect.

May 2, 2017 9:08 pm

Ashok Patel May 2, 2017 at 1:59 am ……Correction
In reply to richard verney May 1, 2017 at 10:13 am
2015-16 El Nino was followed by a weak La Nina JAS 2016 to NDJ 2017 and hence there is no question of a back to back El Nino. In 2017 there has not been and 3-monthly seasonal period with ONI index +0.5 C or more. In fact the last available ONI index is JFM 2017 which is yet -0.2 C.

May 3, 2017 4:46 am

With all the tooing and froing of believers and non believers it was quite a read to get through all the posts.
This short term stuff really pisses me off, I am in my eighth decade and have ridden motor cycles all my life.
The weather is important when you ride motor cycles and in my life I have seen warm times wet times, cold times and drought. These changes were not caused by the emissions or the loud noise of my motor cycles, they were natural.
Now that I am all grown up I still ride motorcycles, but have had a large interest in science of all persuasions, history also is of interest and oddly in some genres they fit together nicely. Climate science is on of those subjects were they fit. The history of our world and the climate go hand in hand and our modern period it would seem is not as warm as the past. This flies in the face of the true believers who fail to read history, I see their propaganda everywhere polluting the minds of our young and not so young.I do hope your new president puts a stop to the BS.

May 3, 2017 6:04 am

So once upon a time a salesman made a graphical presentation to the owners of his company that showed his sales figures going through the roof. Right before he accepted incoming congratulations, the accountant stood up and said the increase was due to an accounting error.
Moral of the story, just because people make graphs, doesn’t mean they represent anything real.
I would require meticulous data verification and protection perpetually before I started believing any graph.
So you see the issue here with climate science.
Andrew

Roscoe
May 3, 2017 6:13 am

My gut instinct was dead wrong about one thing. Statistical significance. Janice Moore linked to this article.
(Source: Werner Brozek, ed. by J. T. Facts, https://wattsupwiththat.com/2017/04/11/la-nina-puzzle-now-includes-february-and-march-data/ )
The article has these conclusions…
For UAH: There is no statistically significant warming since December 1993;
For RSS: There is no statistically significant warming since October 1994;
For Hadsst3: There is no statistically significant warming since May 1997.
I noted the following data and expressed doubt that they could have easily occurred by chance and must be significant, especially with all four in the same direction and highly correlated.
///////////////////////////////////////////
Actual temp changes 1993 to 2017
HadCrut +0.43 deg
GISS +0.61 deg
RSS + 0.30 deg
UAH +0.28 deg
///////////////////////////////
But when I ran a Monte Carlo simulation, I found that Nick Stokes’ was spot-on in the Werner Brozek link (posted above). The 1993-2017 changes can easily be generated by random numbers. So easily, in fact, that I was convinced I made a calculation error. But I didn’t.
In 1000 random simulations, 349 produced warming greater than what has actually occurred. That is not even one standard deviation.
We have beaten and tortured the data on this thread like a dead horse, so I will leave it with these takeaways
(1) the drop in temp that prompted this article is small and insignificant and all the trend lines ending in 2017 in the fossil fuel era remain higher
(2) the warming in the last quarter century is not statistically significant. Not close.
(3) our ability to measure a mean global temperature sucks. If that wasn’t true, then all the main data sets would have very similar results. They don’t.
Cheers everyone.

Phil
May 3, 2017 11:25 am

Recent article from Nature that is relevant to the discussion – Reconciling controversies about the ‘global warming hiatus’.
Abstract – Between about 1998 and 2012, a time that coincided with political negotiations for preventing climate change, the surface of Earth seemed hardly to warm. This phenomenon, often termed the ‘global warming hiatus’, caused doubt in the public mind about how well anthropogenic climate change and natural variability are understood. Here we show that apparently contradictory conclusions stem from different definitions of ‘hiatus’ and from different datasets. A combination of changes in forcing, uptake of heat by the oceans, natural variability and incomplete observational coverage reconciles models and data. Combined with stronger recent warming trends in newer datasets, we are now more confident than ever that human influence is dominant in long-term warming.
http://www.nature.com/nature/journal/v545/n7652/full/nature22315.html
Following link should get one to the full article.
https://www.nature.com/articles/nature22315.epdf?referrer_access_token=OeMbCwpHKLOjgu01gzqo9NRgN0jAjWel9jnR3ZoTv0NuFtYPLl1PUnqxUYbpB1uVru_rIjRyseUxK8YNRXQS4y9DvcRW-sYTMVJXTCE8YE6_rgwvcIsZOxcoqkyQ4VYwLgGHKO9VdTjsskndvtNw8S3pRoA9yrKECTNtNA930WdXolxaUw0hq3-H5BCXjD2ohYl1VggjZW_qln4y8wYZK7YhEZytCSoISaXFCsonMK1Ixts9BgPFeALa5MlipSEO3q8tu85kzkSSB2u3xIp1mncXIZwgIuIh_ffdxIgeM0cCKEiQ6WW_Oww_dfjjHi7SCbizTQtHvYYEQ4PVR2b3uL8qpJTDaETNsF05t6gaFJp58myaID7FMIqNrQl8k8otqZhHnO9J49r8rNR-MRgxk-woeluqbYMMtq30InBKdeg%3D&tracking_referrer=www.nature.com

Reply to  Phil
May 3, 2017 12:30 pm

“Here we show that apparently contradictory conclusions stem from different definitions of ‘hiatus’ and from different datasets.”
Sounds pretty cut and dry.
Andrew

Mary Brown
Reply to  Phil
May 3, 2017 12:55 pm

Wow. Can’t believe that paper ever got published.
First, the entire purpose seems political and doesn’t really try to hide this.
Second, they somehow don’t seem to know anything about satellite data. Amazing.
Love the conclusions…assumes CAGW is reality and proven and puts the burden of proof on anything that disagrees with CAGW. Any real scientist knows the opposite should be true.
////////////////////
The hiatus no doubt was, and still is, an exciting opportunity to learn for many research fields. Social sciences might find this an interesting period for studying how science interacts with the public, media and policy. In a time coinciding with high-level political negotiations on preventing cli-mate change, sceptical media and politicians were using the apparent lack of warming to downplay the importance of climate change. It is easy to paint a controversial picture, but as often the devil is in the detail. A few years of additional data are unlikely to overturn the vast body of evidence that supports anthropogenic climate change. But science requires time to analyse, test hypotheses and publish results, and engaging in fast-paced communication is challenging for scientists in such situations. This will not be the last time that weather and climate will surprise us, so maybe there are lessons to be learned from the hiatus about communication on all sides.From a climate point of view, with 2015 and 2016 being the two warm-est years on record, the question of whether “global warming has stopped” that climate scientists had been facing for many years in the public has largely disappeared. Whether there was a hiatus or slowdown at some point is still debated, with some arguing strongly for it25,31 and others saying it lacks scientific basis30,36,37,39. The conclusions unsurprisingly depend on the time period considered, the dataset and the hypothesis tested, so the diverging conclusions do not need to be inconsistent.

barry
May 4, 2017 8:12 pm

The pause since 1998 has not returned. El Nino has ended with cooler temps than a year ago, but the trend since 1998 is still upwards.
Have to say, it’s rather odd that skeptics claim that the data was ‘fudged’ while we had warmer temps, but as soon as we get cooler monthly anomalies, suddenly the data is fine?
Perhaps it would be well for skeptics to nominate a data set they think is valid. I guess that will be the UAH lower troposphere data set?

Richard Barraclough
Reply to  barry
May 5, 2017 2:23 am

It was always UAH which was used by Monckton to calculate the length of his “Pause”. As somebody else commented, this was up slightly from March to April, and so the focus in the headline switched to a short-term (20 days) fall in another dataset.
December 1997 was the last month to vanish when the Pause died, and would probably be the first month to re-emerge if it were ever to be resurrected. The effect of this month’s anomaly is to increase the decadal slope from Dec 1997 to the present from 0.051 to 0.052. Minuscule for sure, but still increasing, rather than decreasing.

barry
Reply to  Richard Barraclough
May 5, 2017 5:24 am

Richard Barraclough.
It was always UAH which was used by Monckton to calculate the length of his “Pause”.
Monckton used RSS, not UAH.
Here’s a link to his website. First graph.
http://www.lordmoncktonfoundation.com/temp_trend_series
The skeptic community seemed to switch to UAH (Monckton didn’t) last year when the adjusted version 6 came out with a slightly cooler trend than RSS. The previous version had a higher trend than RSS, nearer to surface trends.

barry
Reply to  Richard Barraclough
May 5, 2017 5:25 am

Beg pardon, it was 2 years ago in April that UAH v6 (Beta) data was first posted by Roy Spencer.

crackers345
Reply to  Richard Barraclough
May 6, 2017 5:56 pm

agw is a long-term phenomena.
trying to interpret
individual months as evidence for
or against
is a fool’s errand.
too much noise underneath
the signal (natural
variability)

Chimp
Reply to  Richard Barraclough
May 6, 2017 6:03 pm

crackers345 May 6, 2017 at 5:56 pm
What do you mean by “long-term”?
CO2 rose from 1945 to 1977 without any warming, but instead pronounced cooling, far deeper than the following slight warming was higher. The world did accidentally warm from 1977 to c. 1997, while CO2 still increased, but that was correlation without plausible causation. Then from the late ’90s until this decade, temperature at best stayed flat, despite even more rapid CO2 growth.

Richard Barraclough
Reply to  Richard Barraclough
May 8, 2017 8:52 am

Barry,
You may be right – I was just quoting from my memory of his articles. I was merely drawing attention to the fact that the headline of this article pounced on a sudden very short downturn in a completely different dataset, which has now, incidentally, has moved up by a quarter of a degree this month (but without any excited headlines!)
Regards
Richard

richardscourtney
Reply to  barry
May 5, 2017 2:57 am

barry:
You say

Perhaps it would be well for skeptics to nominate a data set they think is valid.

No. Each and every of the time series for global average surface temperature anomaly (GASTA) is pseudoscientific nonsense; none of them is scientifically valid.
The reasons are that
(a)
there is no agreed definition of GASTA so each team that provides values of GASTA uses its own definition and often changes the definition it uses with e.g. this effect, and
(b)
if there were an agreed definition of GASTA then there is no possibility of a calibration standard for GASTA.
For more full explanation of these matters read this especially its Appendix B.
The purpose of assessing the ‘Pause’ is NOT to support the pseudoscience of GASTA time series.
The purpose of assessing the ‘Pause’ is to reveal the uselessness of the climate models by comparing them to the data they are purported to emulate and project.

Richard

barry
Reply to  richardscourtney
May 5, 2017 3:17 am

Each and every of the time series for global average surface temperature anomaly (GASTA) is pseudoscientific nonsense; none of them is scientifically valid.
If they are no good they cannot invalidate (or validate) models.
Bye-bye pause. The observations are no good.

richardscourtney
Reply to  richardscourtney
May 5, 2017 4:37 am

barry:
I find it hard to believe you are as stupid as you are pretending to be.
I said,

The purpose of assessing the ‘Pause’ is NOT to support the pseudoscience of GASTA time series.
The purpose of assessing the ‘Pause’ is to reveal the uselessness of the climate models by comparing them to the data they are purported to emulate and project.

You have replied to that by saying

If they are no good they cannot invalidate (or validate) models.
Bye-bye pause. The observations are no good.

What is true, but your reply says you are incapable of understanding it, so I will rephrase it.
The GASTA time series are all bunkum but pseudoscientists say their computer games are intended to emulate and project those time series. Scientists are challenging the nonsense of the pseudoscience by comparing the GASTA time series with the outputs of the computer games. That does NOT mean the scientists would agree with your demand for them to agree that any of the bunkum is valid.
Richard

barry
Reply to  richardscourtney
May 5, 2017 5:17 am

You have replied to that…
No, Richard, I replied to this:
Each and every of the time series for global average surface temperature anomaly (GASTA) is pseudoscientific nonsense; none of them is scientifically valid.
by saying:
“If they are no good they cannot invalidate (or validate) models.
Bye-bye pause. The observations are no good.”
I quoted you in my post above, so there can be no doubt about what I was replying to.
It’s very straightforward. If the observations are nonsense, they can’t be used for anything at all. Not for prognostication on pauses (or cooling or warming or any temp evolution). Not for comparing with models.
Observations are rubbish? Then so is any analysis that is based on them.
There’s no way to twist this. Unless you would like to qualify your first statement – the one I replied to?

Reply to  richardscourtney
May 5, 2017 8:23 am

So Barry, I see you are talking to my father and not quite catching the drift.
So perhaps a narrative will help. It might entertain, at least. Here is a tale for you.
All the sailor’s in the village used to watch the clouds before setting off of a morn to go fishing. Because if the clouds turned dark, the wind came up and down they went to Davy Jones locker (where they suffered eternal renditions of “I’m a Believer”).
But old Uncle Gammer swore he could tell the weather despite being blind because of the twinge in his right knee.
On day, the clouds turned dark and the sailor’s stayed in, feeling hungry. But Uncle Gammer told them to go out to sea on the assurance of his knee.
They all drowned.
Now were the widows of the village angry at old Uncle Gammer?
NO!
If Uncle Gammer’s knee could not predict the weather then it’s meaningless. And so any decisions made on Uncle Gammer’s knee are also meaningless. Uncle Gammer’s knee is not the cause of the drowning. It’s the decision to go out to sea without looking at the sky that is to blame.
Do you see how this relates to your decision to trust the models?
Do you see how models that try to replicate Uncle Gammer’s knee are not worth making decisions on?

richardscourtney
Reply to  richardscourtney
May 6, 2017 3:32 am

Matt:
Your “narrative” is an excellent analogy but ‘barry’ will continue “not quite catching the drift” because people don’t understand when they refuse to understand .
Dad

crackers345
Reply to  richardscourtney
May 6, 2017 7:13 pm

richard, science isn’t about “analogies,” it’s about science.
you got any of that?

richardscourtney
Reply to  richardscourtney
May 6, 2017 10:27 pm

crackers345:
YOU ask

richard, science isn’t about “analogies,” it’s about science.
you got any of that?</blockquoteYES, OF COURSE!
Read this esapecially its Appendix B.
Science is also about integrity, you got any of that?
Richard

richardscourtney
Reply to  richardscourtney
May 6, 2017 10:30 pm

I apologise to all for the formatting error in my rebuttal of the anonymous troll who appropriately posts as ‘crackers 345’.
Richard

crackers345
Reply to  richardscourtney
May 6, 2017 10:55 pm

richard: put on your big boy pants
you can’t answer my questions,
which were good questions,
so you hope to eliminate me as a “trool.”
come on, richard,
are you some kind of professional
so start acting like it
instead of like a poorly
educated amateur.

richardscourtney
Reply to  richardscourtney
May 6, 2017 11:11 pm

crackers345:
You continue your egregious trolling by writing

richard: put on your big boy pants
you can’t answer my questions,
which were good questions,
so you hope to eliminate me as a “trool.”
come on, richard,
are you some kind of professional
so start acting like it
instead of like a poorly
educated amateur.

I answered your question specifically put to me.
You have answered the question I added to that reply by demonstrating you have no integrity.
chimp refuted your silly questions and I say “ditto” to his answer which is in this sub-thread here.
Now crawl back under your bridge. As usual your posts are wasting electrons.
Richard

crackers345
Reply to  richardscourtney
May 11, 2017 9:32 am

richardscourtney:
“there is no agreed definition of GASTA so each team that provides values of GASTA uses its own definition and often changes the definition it uses with e.g. this effect”
GASTA is, like any average of a function, the integral of the function
over its entire surface, divided by the area of the surface.
in practice the integral is replaced by a sum over
small areas. easy peasy.
the fact that all groups gets the same results shows
the particular choice of areas and thermometers don’t matter all
that much.
and as long as this methodology is consistent, present values
can be compared to past values
to detect changes in temperatures.
there are good reasons for the adjustments of past raw data, to
correct for biases,
which anyone with a science background should be able to
understand.

Reply to  crackers345
May 11, 2017 11:51 am

GASTA is, like any average of a function, the integral of the function
over its entire surface, divided by the area of the surface.
in practice the integral is replaced by a sum over
small areas. easy peasy.
the fact that all groups gets the same results shows
the particular choice of areas and thermometers don’t matter all
that much.
and as long as this methodology is consistent, present values
can be compared to past values
to detect changes in temperatures.

Total nonsense, they all follow (except possible BEST) the same basic process of adjusting the data, normalization, and infilling. What you see is they all do about the same thing. Not that they in anyway produce a number based on the actual measurements.
This is an average of what’s measuredcomment image
NCDC GSoD, the Air Force’s daily summary.

Mary Brown
Reply to  crackers345
May 11, 2017 7:08 pm

I agree that GASTA calculation is a pretty straightforward scientific statistical exercise. Those who claim it can’t be done and that the number has no meaning are barking up the wrong tree.
I disagree that the major data sets all basically agree. The month-to-month differences between them give me a good idea the errors involved. It is hard to argue that we know GASTA within 0.20° … and that is 20 years worth if warming.
Many of the temperature adjustments such as site changes and time of day changes are appropriate. However, there are a lot of adjustments that may not be warranted. Just cleaning and painting a dirty shelter box can lead to global warming with the current adjustment methods.
Also, the temperature adjustments have a shockingly high correlation to carbon dioxide (Robert Brown, Duke Univ). One would guess that the correlation would be near zero. The complexity of the adjustment process and the lack of transparency and the suspicious correlation are all problematic to my blanket acceptance of the adjusted data

richardscourtney
Reply to  richardscourtney
May 11, 2017 10:23 am

Ignorant troll posting as crackers 345:
You stupidly write of global average surface temperature anomaly (GASTA)

GASTA is, like any average of a function, the integral of the function
over its entire surface, divided by the area of the surface.
in practice the integral is replaced by a sum over
small areas. easy peasy.

In this subthread I have already twice linked to this which explains how and why all your comments about GASTA are pure bollocks!
But you again demonstrate that you cannot read. You can only parrot what your paymasters instruct you to post.
It is simply true that
(a)
there is no agreed definition of GASTA so each team that provides values of GASTA uses its own definition and often changes the definition it uses with e.g. this effect, and
(b)
if there were an agreed definition of GASTA then there is no possibility of a calibration standard for GASTA.
Since you have again demonstrated that reading is beyond your capabilities, I point out that I have demonstrated the reality with pictures and I yet again repeat that if there were an agreed definition of GASTA then this would not happen.
Richard

Chimp
Reply to  barry
May 6, 2017 6:05 pm

barry May 4, 2017 at 8:12 pm
A year ago the mounting El Nino was already in effect.
Give it a little more time. There is still not statistically valid human fingerprint in valid temperature “data”.

crackers345
Reply to  Chimp
May 6, 2017 7:18 pm

Chimp May 6, 2017 at 6:05 pm wrote:
“There is still not statistically valid human fingerprint in valid temperature “data”.”
then how about explaining where
all the warming has come
from — atmosphere (surface, LT)
all the melting ice
the huge increase in ocean heat content.
that is your burden

Chimp
Reply to  Chimp
May 6, 2017 7:25 pm

Crackers,
The burden is light as a small, downy feather.
The warming since c. AD 1690 is entirely within normal bounds. It is just barely measurable within margin of error, although proxy data suggest it is real.
Even greater centennial-scale warming over similar cycles is evident in the Holocene and prior interglacials. There is thus no need to posit an unusual source, such as human GHG emissions.
And every reason to reject the repeatedly falsified hypothesis of AGW, whether beneficial, as Arrhenius and Callendar thought, or “catastrophic” as today’s trough-feeding bureaucrats try to scare taxpayers into believing. That is, the null hypothesis of nothing unusual happening cannot be rejected.

Mary Brown
Reply to  Chimp
May 7, 2017 8:14 am

That is the best post in this entire, mostly useless, thread

Chimp
Reply to  Chimp
May 6, 2017 7:25 pm

There is scarcely any real increase in ocean heat content, let alone “huge”.

Mary Brown
Reply to  Chimp
May 7, 2017 8:13 am

About .01 deg warmer since ARGO launch in 2004

crackers345
Reply to  Chimp
May 11, 2017 9:34 am

Chimp, have you looked at the data on ocean heat content? or the
papers on earth’s energy imbalance?

crackers345
Reply to  Chimp
May 11, 2017 9:44 am

Mary Brown:
“About .01 deg warmer since ARGO launch in 2004”
from the surface to 2 km depth
it’s 280 MJ/m2 warmer, or 0.7 W/m2.
(the ocean’s heat capacity is so large that, for atmospheric warming, the important variable is ocean heat gain, not ocean temperature change.)

Mary Brown
Reply to  crackers345
May 11, 2017 6:49 pm

I agree with your basics on ocean heat but my point is the temperature change is so small that we can’t accurately measure it.
So I see claims of massive ocean heat content increases and giant energy imbalances but when you get right down to it, we’re talking about 0.01°
And we get these figures from a bunch of floating stations that move around and each is responsible to sample a massive area
Anybody who claims there’s any statistical significance to this warming in ARGO dsta is delusional. I have heard the argument as to why it is significant, but that doesn’t remotely pass the sniff test

crackers345
Reply to  Chimp
May 11, 2017 9:45 am

Chimp:
“The warming since c. AD 1690 is entirely within normal bounds.”
what are the
normal bounds?
and why?

Richard Barraclough
Reply to  barry
May 10, 2017 2:54 am

Barry,
I was just reading with amusement your next discussion. I think you have made the mistake of trying to be logical and polite to someone for whom those virtues are somewhat alien.
Don’t discourage him, though. It’s always entertaining to see just how worked up he can get.