Interdisciplinary studies reveal relationship between solar activity and climate change

INSTITUTE OF ATMOSPHERIC PHYSICS, CHINESE ACADEMY OF SCIENCES
The solar flux is considered the fundamental energy source of earth’s climate system on long time scales. In recent decades, some studies have noted that the tiny variations in solar activity could be amplified by the nonlinear process in climate system. Therefore, the astronomy factors, such as solar activity, present intriguing and cutting-edge questions to better understand climate change.
Due to the interdisciplinary nature of this subject, studies in this field were insufficient in China. In 2012, China’s National Basic Research Program examined the impacts of astronomy and earth motion factors on climate change. Led by Prof. Ziniu XIAO (Institute of Atmospheric Physics, Chinese Academy of Sciences), this five-year research program that involved scientists in different research fields has greatly advanced understanding of this topic.
One of the major achievements by the multidisciplinary team is that a robust relationship between solar wind speed and North Atlantic Oscillation was found not only on a day-to-day time scale but also from the perspective of year-to-year variation, suggesting a much faster mechanism of solar influence on atmospheric system compared to the ozone destruction. Moreover, the team improved the collision and parameterization scheme and qualitatively evaluated the effects of solar energetic particle flux on cloud charge. Hence the team proposed that the solar wind and electric-microphysical effect was the key mechanism of solar activity on climate.
With the help of observations and model simulations, the team also found that the solar signal is more significant and detectable on an interdecadal time scale in some more sensitive regions, especially the tropical Pacific (eg. lagged dipolar convection pattern in tropical western Pacific; lagged El Nino Modoki-like pattern on tropical ocean surface) and monsoon regions (eg. rainband during the Mei-Yu season; north boundary of East Asian summer monsoon). Then a physical model is developed by the team to depict the interdecadal response of the air-sea system to solar activity.
The results above have been published in Atmospheric and Oceanic Science Letters, Journal of Applied Meteorology and Climatology, Journal of Geophysical Research, Journal of Meteorological Research, Journal of the Meteorological Society of Japan, Journal of Climate, and Advances in Space Research.
The follow-up research by the team is currently in progress and focuses on two main aspects: one is the effects of solar radiative forcing and solar energetic particles on climate in middle-high latitudes through modulating polar stratospheric-troposphere coupling, and the other is the response of a tropical Pacific air-sea system to interdecadal variation in solar activity and how this response propagates into middle latitudes through East Asian monsoon activity.
A program report is recently published in Atmospheric and Oceanic Science Letters.
I wonder what Leif Svalgaard will think of this. While it seems to be on an interaction between solar variation and climate patterns, it matters a great deal if the solar variation is not even there. i formerly believed that there was a good relationship between sunspot numbers and solar activity and temperature, but the evidence for that is rather lacking.
The paper does not really present any evidence. It seems to be a sort of ‘progress report’ to the Chinese Government justifying more funding.
So, it is not a paper, but a “progress report”.
That explains why it has been “published” in more than one journal.
Hi Dr. Svalgaard
Sorry that my question is somewhat off topic but since you are an expert in all things related to the sun, I will try my luck in asking you a question which has puzzled me for years and I have found no answer yet (not even here among the wuwt readership some weeks ago):
Why has Planet Venus such a dense atmosphere but nevertheless only a rather small magnetic field? Since many scientists believe that Planet Mars lost its formerly dense atmosphere due to erosion by solar wind and the missing protection of a magnetic shield, the dense atmosphere of Venus seems to be rather odd. Do you know an answer for this curious contradiction?
Many thanks in advance for your expertise!
Regards, GT
missing protection of a magnetic shield, the dense atmosphere of Venus seems to be rather odd.
For one, the surface gravity of Venus is almost three times larger than that of Mars, so it is more difficult to escape from Venus.
Also, Google is your friend
https://en.wikipedia.org/wiki/Atmospheric_escape
The level of solar wind experienced by Venus is quite a bit higher as well.
Things are not simple. The solar wind impacting the MUCH denser Venus atmosphere creates a STRONG conducting layer very high in the atmosphere which in turn helps to deflect the solar wind and its eroding effects.
Hi Dr. Svalgaard and other panelists,
Thank you for your answers and remarks. Of course did I google this question before but must have missed this article due to some reason. Maybe I did not use the needed search word “escape”.
But after reading it, I must say that I’m not quite convinced. It sounds like a auxiliary hypothesis in order to overcome the contradiction and not like a finally proven fact. But I can be wrong of course…
Regards, GT
Just from what is written here, it comes across as a lot of hand waving.
Waves are important in physics, the most important ones are Sound Waves, Alfven Waves, and Hand Waves; with the last one being the very most important one…
GT ,an interesting question .according to my information gravity of venus is 0.9that of earth &mars is 0.378 of earth, taking earth as 1.So, as you say,” why has venus a MUCH denser atmosphere ”?it is said to be 96 percent CO 2.(varies between 96&98 depending on scource of info) CO 2 is 1.67Xdenser than that OF EARTH ‘s atmosphere .at stp. ???
I don’t want to sound like a total nut case here, but filing this in the “Universe is weird” file, does this actually have the potential to give some merit to astrology? Something that I have consistently poo-poo’d all my life. Astrology purports to predict the future of individuals based upon the date and time of their birth and the alignment of the planets. Since we know the planets do influence solar activity to a degree based on gravitational forces, and solar activity influences weather and climate on earth, and said weather and climate has a historic relationship to famine/plenty, wars, etc.; is it theoretically possible that based on a knowledge of a person’s date and time of birth, you could calculate planetary positions, their gravitational effects on the sun, then the likely solar response and ultimately whether temperature drops would effect crop yields, famine, migration, war, etc.?
Seriously though, it seems such a “model” would almost certainly be as accurate if not more accurate than the current climate models.
No, this doesn’t show how astrology could work.
Yes, astrology is better than climate models.
LOL
U R correct Sir !
Good one! Made my day. By the way there was an interesting book called “Astrology: The Evidence of Science” by Dr Percy Seymour (doctorates in astronomy and astrophysics) that I found quite interesting. Way beyond my pay grade to judge its accuracy but a fun read and I learned a bunch.
There’s liable to be something in almost anything. Astrology has one pretty big problem right from the start however. The signs of the Zodiac have moved since the supposed associations between them and human personality traits and fates were first formulated. We also know more about planets now than then.
Which is not to say that birth date doesn’t affect various kinds of performance. I know from my own grade school class to a fairly high p value that it does. However:
Cassius:
“The fault, dear Brutus, is not in our stars,
But in ourselves, that we are underlings.”
Julius Caesar (I, ii, 140-141)
Glad you all were amused, anyway.
Climastrology all the way. GIGO GCMs are arguably worse than goat entrails, let alone astrology.
I was born under the sign of the D⊚nut.
Astrology purports to predict
==================
We predict the ocean tides years in the future with great precision using Astrology. Trying to predict the ocean tides using physical laws (first principles), as is done in climate forecasting, does not work.
We predict the tides similar to how early humans predicted the seasons, without even knowing what caused them. When the sun at noon is high in the sky, it will be on average warm. When the sun at noon is low in the sky, it will be on average cold.
We see cyclical patterns in the ice age history, suggesting that long term climate predictions are much more likely to be solved via Astrology than by Thermodynamics.
The chaotic nature of both the tides and climate prevent present day mathematical solutions using first principles. We do not have a practical solution to the n-body problem, which mimics the orbits of a chaotic system around the attractors.
Your birth date definitely has an effect on your life. Professional athletes, for example, tend to be born at certain times of the year. That means they will be larger and more mature when junior sports teams are selected. link
The trouble is that people will take small facts (like the one above) and extrapolate like crazy. That’s how we get astrology and economics. link
Also, if you have a winter birthday, you tend to get indoor activity presents, whereas summer gets the opposite.
Astrology much more likely to be of relevance in times when winter brought hardship and ‘the hungry gap’ of May and June meant precisely that. When in your mothers womb, the chemicals you receive/are exposed to will depend on temperature, availability of food and general health of the mother. The question as to whether such forces shape character, temperament etc is the key one determining whether astrology has any validity or not.
It would also depend hugely on the hemisphere you live in and the latitude you live at, as climates are so different across the globe.
Interestingly, chinese astrology has a 60 year cycle (5*12 year cycle), which is vaguely equal to the length of multidecadal oscilation cycles. It is totally different to Western astrology, which focusses solely on the annual cycle (but the western approach has hugely interesting cycle lengths if you also evaluate the signs of all planets in the solar system at birth).
The biggest issue with astrology is the effect of knowing your astrological make up at a young age (will you be brainwashed by the message, rebel strongly against it etc?) vs being ignorant about it until the age of 40.
“That’s how we get astrology and economics.”
LOL! +1.
But from the article at the first link: “In 2009, professional English youth academies (aged 16-20 years) were grossly over-represented by players with birthdates in a three month period. 57% of youngsters were born in September, November or December whilst only 14% celebrated their birthday in June, July or August…. This observation is known as the Relative Age Effect (RAE) and is determined by the cut-off date for age group competition. In English football, as is the case at school, children are placed into year groups based on whether they are born before or on 1 September…”
Uh, what happened to October?
Birthdate also has impact on long term academic performance. Texas’ cutoff for date entry into kindergarten is September 1. A few years back, they surveyed all of the valedictorians in the Dallas/Ft. Worth area. All but one was born in September – December.
@Dave Burton – darned good question. A quick answer would be fewer births in October, but no… About the same as the three months mentioned. The UK data I looked at shows about a 10% difference for one month – but that month is February.
Not to mention homeopathy.
“is it theoretically possible that based on a knowledge of a person’s date and time of birth, you could calculate planetary positions, their gravitational effects on the sun, then the likely solar response and ultimately whether temperature drops would effect crop yields, famine, migration, war, etc.?”
=================================================================
What you are describing is the long term environment during each person’s formative years. If significant events during a person’s life determined personality, how would an hour’s difference in the time of birth matter? Or even a month’s difference? Would it make a difference if a famine started during one person’s 37th month instead of their 38th month?
I had 7 siblings. All of us had the same parents and lived in the same household. We experienced the same climate and world events. We are all different. Strong evidence for the lottery which is genetic variability being the major determinant of personality, as it is of physicality. Studies of twins separated at birth confirm the role of nature over nuture.
Now, back to the thread.
SR
THIS ASTROLOGY JUNK IS WILDLY OFF-TOPIC – FURTHER COMMENTS WILL BE DELETED.
“All truths are easy to understand once they are discovered; the point is to discover them.” Galileo Galilei
I sometimes wonder what Copernicus, Galileo, Newton and dozen’s of other ‘astrologers’ of the day would think of their efforts in understanding all the knowledge that laid our foundations for science today. All studied astrology intensely, although in a perverse way, they were extrapolating truth out of the mathematics of predicting the science of planetary motion. And it led to the Scientific Method that some of us today practise.
Or what a cave man sitting on the beach one fine evening 10,000 BC as he watched the sun/moon cycles above and the ocean tides in front of him/her. The point is, understanding our roots where our collective knowledge came from is very important today. It is ironic, at least to me, that some of the same people today who would be so quick to dismiss what these giants of science were thinking then, are so quick to dismiss celestial astrology of any kind and just dismiss it as pure pseudoscience. It kind of reminds me of present day skeptics vs. alarmists in the climate debate. Both think each other nuts.
I think we are in for some very interesting scientific studies in the next 100 years regarding this ancient practise that for so long was the basis for our scientific quest to understand our place in the cosmos. There is much more to this than meets the eye, and parts of it will some day help explain relative climate change, as well as predict it, in so far as celestial matters are concerned between the cosmos and earth.
Astrology was part of medical studies when Copernicus was in school. He eventually however got a doctorate in canon law.
“Or what a cave man sitting on the beach one fine evening 10,000 BC as he watched the sun/moon cycles above and the ocean tides in front of him/her. ”
Funny you should pick that date.
http://dailycaller.com/2017/04/24/ancient-temple-shows-comet-struck-earth-in-11000-bc/
Referencing
http://maajournal.com/Issues/2017/Vol17-1/Sweatman%20and%20Tsikritsis%2017%281%29.pdf
Sometimes the stars do influence things!
Two things that I noticed that are weird
When Swarm met Steve
http://www.asdnews.com/news-70144/When_Swarm_met_Steve.htm
http://www.asdnews.com/data_news/ID70144_600.jpg
Prof. Donovan said, “As the satellite flew straight though Steve, data from the electric field instrument showed very clear changes.
“The temperature 300 km above Earth’s surface jumped by 3000°C and the data revealed a 25 km-wide ribbon of gas flowing westwards at about 6 km/s compared to a speed of about 10 m/s either side of the ribbon.”
Solar storms can DRAIN Earth’s electrical charge, creating regions in the atmosphere where electrons are ‘almost vacuumed out’
http://www.dailymail.co.uk/sciencetech/article-4402326/Solar-storms-DRAIN-Earth-s-electrical-charge.html
I was unaware that they had correlated ozone destruction to solar activity. But it does seem to make sense. The big ozone scare and the Antarctic hole was during the solar ‘modern maximum’
UV light flux causes variation in ozone. UV is the part of the solar spectrum that fluctuates the most, much more so than TSI over all.
No, it does not, since UV is just a small part of TSI.
It is like you want to judge a man’s total wealth by the amount of loose change in his pockets.
The point is that it varies much more than does TSI, indeed by about 100%.
The fluctuation is significant if for no other reason than its effect on ozone.
The percentage variation is irrelevant. What matters is the actual variation. And ozone varies a lot for other reasons. Here is the total ozone amount variation the last forty years. There is no solar cycle variation rising above the other natural variations:
http://www.cpc.ncep.noaa.gov/products/stratosphere/winter_bulletins/nh_05-06/figure_11.gif
I think that it would be more accurate to say that the percentage change for UV is greater than the percentage change for the rest of the spectrum during the sunspot cycle.
It is far different to say that there is no effect than that an effect cannot yet be demonstrated. Dogma deteriorates inquiry.
==================
It is far different to say that there is no effect than that an effect cannot yet be demonstrated
Observations trump blathering…
Isvalgaard,
Your NOAA graph is dominated by the annual variations. For starters, I think that one should pay attention to the annual Winter lows and Summer highs to see if there might be some trends.
As if observations were all explanatory so far.
===========
EUV varies by even more, about 567% during a solar cycle:
ftp://ftp.ngdc.noaa.gov/STP/SOLAR_DATA/SOLAR_UV/SOLAR2000/E10_5_cycle_v120.jpg
EUV is measured in milliWatts. A milliWatt is about one millionth of the Sun’s output.
Formation of ozone by UVC:
http://ozone.meteo.be/meteo/view/en/1547746-Formation+of+ozone.html
http://ozone.meteo.be/meteo/download/en/19014675/image/scaletomax-0-0/ozone_formation.png
UV destroys ozone:
http://www.atmo.arizona.edu/students/courselinks/spring13/atmo170a1s1/1S1P_stuff/stratospheric_ozone/ozone_layer_01.jpg
lsvalgaard April 24, 2017 at 11:12 am
Going from 60 of something to 400 of something that is known to affect the chemistry of the atmosphere is not a trivial change.
“EUV is measured in milliWatts. A milliWatt is about one millionth of the Sun’s output.”
The sun’s only putting out 1000 Watts? I thought it felt chilly this morning.
I thought it was not necessary to mention that the outputs be measured over the same area, e.g. one square meter, but, apparently it was necessary…
The scientific illiteracy is sad.
Heh, Leif wins that one, but tiny changes in clouds can make large changes in albedo, and in energy absorbed.
=========
but tiny changes in clouds can make large changes in albedo, and in energy absorbed.
No, tiny changes in clouds make tiny changes in albedo, and large changes in clouds make large changes in albedo.
OK, vapour to liquid is a large change.
================
not much to do with albedo…
No, much change to albedo, and one which doesn’t require much energy input.
=============
Evidence, data, observations, links to your bald assertion.
Surely you’ll admit that formation of a cloud involves a large change to albedo.
===============
No, formation of a large cloud [or many small ones] causes a change in albedo.
The current cloud cover accounts for something like an albedo of 0.25. A doubling of cloud cover [i.e. a LARGE change] would add another 0.25 to the albedo. A 1% change of could cover add 0.0025 to the albedo, not very large.
lsvargaard: No, tiny changes in clouds make tiny changes in albedo, and large changes in clouds make large changes in albedo.
How much change in cloud cover can result from the observed changes in UV? Almost all of the changes that we discuss with respect to CO2 effects on global temperature are small in the absolute scales; a small change in cloud cover could be larger than the effect of doubling CO2 concentration, especially at times of highest insolation. Can the UV changes produce that much cloud cover change?
How much change in cloud cover can result from the observed changes in UV?
I don’t have a handy number for that. Let all the cloud-UV enthusiasts provide a number [if they can].
by my account its effect on world T minima seems to be around
-0.009K/annum since 2000
I cannot think of anything but the change in UV is causing the cooling
[unless it is the added CO2 to the atmosphere?]
UV may be a small portion of total energy from the sun, however it’s the only portion of that spectrum that creates ozone.
Leif would be one of the first to jump all over anyone who made the type of mental short cut he just criticized me for pointing out.
True, MarkW, and with even more disdain.
Thanks, Leif, as always. You’ve taught me more than the narrator for ‘Our Mr. Sun’, the estimable Frank Baxter. Hemo, the Magnificent worth a watch, too.
=========
And please, hp, perish the CO2 cooling thought. It’s run through my mind and gives me an awful chill. Fortunately, it’s likely, if real, to have only a small effect, fingers crossed behind back. After all, cooling does always follows a rise in CO2 in the paleontological record. How long after cooling follows CO2 rise, even kim doesn’t know.
=============
EUV goes from 124 nm to 10 nm. It can do things that longer wavelengths can’t (as you well know). The amount of UV that can give you a sunburn is also measured in milliwatts per square meter. link
MarkW humorously pointed out your error in omitting area. Accusing him of being scientifically illiterate doesn’t actually make his point less funny. 🙂 ROTFL
lsvalgaard April 24, 2017 at 11:24 am
UV also creates ozone. As Mark and Bob have pointed out, UV is qualitatively different from the longer waved, less energetic but quantitatively greater portions of the solar spectrum. It alone can make and destroy ozone. It penetrates farther in the ocean. Among other distinctions.
To ignore its role in climate change seems to me to require blinkers.
To ignore its role in climate change seems to me to require blinkers.
Nobody is ignoring anything. The point is that there is no evidence for a significant role of ozone in climate change.
The fluctuating part of the spectrum you’re referring to is the EUV which is a very small part of the total and is absorbed above 80km and forms the ionosphere. The wavelengths involved in O3 production and destruction are longer UV wavelengths.
Kim,
Just wanted to say it never crossed my mind that you meant global albedo might change because “a cloud” formed . . but hey, I’m not an expert ; )
Leif,
That ozone affects climate is not a controversial finding.
Ozone and climate: With the HALO research aircraft to the North Pole
https://www.sciencedaily.com/releases/2015/12/151210092853.htm
“Its impact on climate near the ground is highest in the tropopause region, the transition zone between stratosphere and troposphere at 7 to 17 kilometers altitude.”
Blocking all the UVC, 90% of the UVB and half of the UVA obviously affects climate, as does the effect on air pressure. This and more has all been studied with robust results.
Blocking all the UVC, 90% of the UVB and half of the UVA obviously affects climate
For the simple reason that those bands make up 10% of the incoming energy. Remove 10% and the temperature drops 2.5% = 7 degrees… If you only remove half of that, the temperature drops 3.5 degrees…
Phil. April 24, 2017 at 5:20 pm
While EUV can vary by a factors of ten or more, the UV wavelengths that do make ozone also fluctuate far more than TSI.
NASA on “Solar Variability and Terrestrial Climate”:
https://science.nasa.gov/science-news/science-at-nasa/2013/08jan_sunclimate/
One of the participants, Greg Kopp of the Laboratory for Atmospheric and Space Physics at the University of Colorado, pointed out that while the variations in luminosity over the 11-year solar cycle amount to only a tenth of a percent of the sun’s total output, such a small fraction is still important. “Even typical short term variations of 0.1% in incident irradiance exceed all other energy sources (such as natural radioactivity in Earth’s core) combined,” he says.
Of particular importance is the sun’s extreme ultraviolet (EUV) radiation, which peaks during the years around solar maximum. Within the relatively narrow band of EUV wavelengths, the sun’s output varies not by a minuscule 0.1%, but by whopping factors of 10 or more. This can strongly affect the chemistry and thermal structure of the upper atmosphere.
Several researchers discussed how changes in the upper atmosphere can trickle down to Earth’s surface. There are many “top-down” pathways for the sun’s influence. For instance, Charles Jackman of the Goddard Space Flight Center described how nitrogen oxides (NOx) created by solar energetic particles and cosmic rays in the stratosphere could reduce ozone levels by a few percent. Because ozone absorbs UV radiation, less ozone means that more UV rays from the sun would reach Earth’s surface.
Isaac Held of NOAA took this one step further. He described how loss of ozone in the stratosphere could alter the dynamics of the atmosphere below it. “The cooling of the polar stratosphere associated with loss of ozone increases the horizontal temperature gradient near the tropopause,” he explains. “This alters the flux of angular momentum by mid-latitude eddies. [Angular momentum is important because] the angular momentum budget of the troposphere controls the surface westerlies.” In other words, solar activity felt in the upper atmosphere can, through a complicated series of influences, push surface storm tracks off course.
This can strongly affect the chemistry and thermal structure of the upper atmosphere.
Yeah, above 100 km altitude where the density is less than a millionth of that at the surface. A very tiny tail trying to wag a humongous dog.
lsvalgaard April 24, 2017 at 6:40 pm
You seem to be missing the point that it’s not just the total energy that matters. UV is qualitatively different from visible and IR light. It can do things and have effects that the less energetic portions of the spectrum can’t.
Please see my reply to Phil for some of the processes by which UV flux affects climate.
lsvalgaard: Let all the cloud-UV enthusiasts provide a number [if they can].
Fair enough. I hope to read that some day.
Meanwhile, how do you know that it is so small as to be negligible?
Because when we try hard to look for it, it is very hard to find. If it were large it should jump right out at us.
It appears to be small
according to my measurements its effect on global minima [which are supposed to be increasing as CO2 is increasing]
is about -0.01K/annum since 2000.
don’t trust anyone
even the satellites are wrong because currently [with the sun at its lowest SSN and the lowest magnetic field strengths] no material or probe can withstand what is coming from the sun [unless protected by an atmosphere like we have on earth]
\
Kim
I doubt that the [extra] CO2 is cooling the earth
since the curve on the speed of cooling [of global minima] as observed by me is 100% natural.
There is no chaos?
lsvalgaard: “Let all the cloud-UV enthusiasts provide a number [if they can].”
I’m not an enthusiast, merely a consumer of scientific papers.
That UV light promotes the condensation of water vapor into droplets in the air is an observation, ie a scientific fact, confirmed experimentally.
CLOUD FORMATION & ATMOSPHERIC RAINMAKING BY ENDOTHERMIC REACTION DUE TO PLASMA LASER & UV RADIATION IN THE ATMOSPHERE
http://www.jitbm.com/21st%20volume/5shivshankar.pdf
The reaction 4 also occurs by photochemical reaction due to
ultraviolet rays. The energy from uv rays is absorbed by
the oxygen molecule and leads to reaction 4. As a result,
the atmosphere is cooled below the condensation
temperature of water vapor. The water vapors particles
come close enough, due to condensation, and natural
seeding takes place. Means, this cooling will create CCN
(clouds condensation nuclei) in cloud parcel and produce
tiny water droplets in the atmosphere. These tiny water
droplets then act as natural seed for the formation of rain
drops in the atmosphere (Drake 2006). These water
droplets may also shift to other places due to flow of air
motions and form another set of rain drops there.
Chimp
you forgot
As the temperature differential between the poles and equator grows larger due to the cooling from the top, very likely something will also change on earth. Predictably, there would be a small shift of cloud formation and precipitation, more towards the equator, on average. At the equator insolation is 684 W/m2 whereas on average it is 342 W/m2. So, if there are more clouds in and around the equator, this will amplify the cooling effect due to less direct natural insolation of earth (clouds deflect a lot of radiation). Furthermore, in a cooling world there is more likely less moisture in the air, but even assuming equal amounts of water vapour available in the air, a lesser amount of clouds and precipitation will be available for spreading to higher latitudes. So, a natural consequence of global cooling is that at the higher latitudes it will become cooler and/or drier.
lsvalgaard: Because when we try hard to look for it, it is very hard to find. If it were large it should jump right out at us.
That does not show that it is too small to be “negligible”, only that the order of magnitude of the effect is not around 4%. The magnitude of the CO2 effect is approximately 1%, and it is not “negligible”.
Oh, that is just great…The Chinese are doing REAL science while the West continues to do “Pseudo Science”…. D’oh !!
Someone has to lead the way, and the US of A seems to has lost its way.
What? Not a single mention of CO2?
Sunspot cycles are accompanied by a number of other cycles such as TSI, solar wind speed, magnetic field strength and whether positive or negative, microwave signal amplitude, etc. Also, within the relatively small changes in TSI, there are quite substantial changes in UV output.
The result is that the earth and its surrounds are bathed in a number of changing conditions, some electromagnetic, some charged matter. As well as Svensmark’s cosmic ray influence on cloud formation, there are other possibilities such as chemical effects or even changes in the quantities of cosmic dust entering earth’s atmosphere. Many climate scientists disregard solar effects but if they can modulate cloud formation, it does not take much change in albedo to influence climate.
Also, within the relatively small changes in TSI, there are quite substantial changes in UV output
Since UV is but a small part of TSI, any changes in UV are a lot smaller than the changes in TSI.
Percent changes matter.
==================
No. Actual changes matter.
Well, obviously, both matter, but absent mechanism, we’re both just blathering.
=========
and absent any significant variation the blathering continues…
Surely you’ll not argue that a ‘percent change’ is not an ‘actual change’. Look, we’ve already pretty well established that total energy is not the question. It’s the nuances of other changes which intrigue.
============
What is important is the actual change in ozone and that shows no solar cycle variation.
As if ozone were the only way.
==============
The various ozone regional data show minute variations of atmospheric movement and direction.
Perhaps you may be looking a ozone for the wrong conclusions
UV is at the high energy end of the TSI spectra.
UV penetrates into water further. UV is damaging to the biosphere, i.e. a 1% increase in UVB has shown to increase certain cancer cells by 2-3%. UV breaks down dissolved organic matter faster than visible light. Just to name a few ways it could affect climate.
Just to name a few ways it could affect climate.
More important than what it could is what it actually does and there are so many other things affecting ozone that the solar contribution is in the noise.
Thanks, Leif, as always. Noise conceals signals, especially ones difficult to detect.
===========
In the past the solar cycle length changed and the sun spots count got pretty low ,then the L.I.A. happened.
The sun seems to be on a similar path will we get colder? or has the sun got nothing to do with climate variation.
Well, SOMETHING is causing the Earth to warm and cool and warm and cool over hundreds of years. And since almost all of the energy coming inbound is from the giant thermonuclear device ~93M miles away, my guess it has a lot to do with it.
As we put up satellites and ground stations that can measure wavelengths of in and out bound energy, solar wind, cosmic ray interactions and lots of other things, I think we will rule things in and out and someday get close to the holy grail.
As discussed on his blog number of years ago
http://www.vukcevic.talktalk.net/AMO-0.gif
Variability in the geomagnetic east component is directly correlated to changes in solar activity (Dr. S. used data for the reconstruction of the ‘Svalgaard’s Sunspot Number’ now ‘accepted’ as the international standard for measure of the past solar activity)
“As discussed on this blog”
https://wattsupwiththat.com/2014/12/17/good-news-from-agu14-arctic-sea-ice-is-holding-up-to-global-warming-better-than-expected/#comment-1816189
Vuc, Even Nikola Tesla ended up homeless, and feeding pigeons. …there was Eugene Parker… so…don’t feel bad.
https://en.wikipedia.org/wiki/Parker_spiral
I think the sun might just have something to do with the temperature of the earth. This seems to be a reasonable line of inquiry for solar/environmental scientists to get under the variability in terrestrial temperatures. China isn’t popular at the moment, but I am still interested in what is done there that contributes to the planetary scientific knowledge bank.
Paul – China is not popular.
That’s news to me. Not popular with who, or what country. Let me guess.
Hi Paul
Tesla’s advice from the end of XIX century may be very appropriate for one today’s dilemmas:
“Exploiting waterfalls’ power is the most efficient way of harnessing solar energy”,
he also said that ‘the sanity is essential for thinking clearly’, however, feeding pigeons sadly doesn’t tell us much about person’s sanity.
Eugene Parker did lot of good work, regretfully didn’t have the spark of Tesla’s instinct. If only he made a modest step and subjected his spiral to the Tesla’s theory of the rotating magnetic fields, he could have perceived the phenomenon controlling solar activity manifested in the appearance of the regular sequences of the odd/even sunspot cycles
as shown in this short animation .
Hi Paul
Tesla’s advice from the end of XIX century may be very appropriate for one today’s dilemmas:
“Exploiting waterfalls’ power is the most efficient way of harnessing solar energy”,
he also said that ‘the sanity is essential for thinking clearly’, however feeding pigeons sadly doesn’t tell us much about person’s sanity.
Eugene Parker did lot of good work, regretfully didn’t have the spark of Tesla’s instinct. If only he made a modest step and subjected his spiral to the Tesla’s theory of the rotating/orbiting magnetic fields, he could have perceived the phenomenon controlling solar activity manifested in the appearance of the regular sequences of the odd/even sunspot cycles
as shown in this short animation .
Thank-you Vuk.
Solar 11 year cycle correllates strongly to Norwegian current which is offshoot of Gulf stream :
http://static-sls.smf.aws.sanomacloud.net/tiede.fi/s3fs-public/styles/medium_main_image_no_upscale/public/discussion_comment_image/pilkut.png
solar ap-index correllates very strongly too to Gulf stream heat transport headed to Arctic ocean :
http://static-sls.smf.aws.sanomacloud.net/tiede.fi/s3fs-public/styles/medium_main_image_no_upscale/public/discussion_comment_image/ap_index.png
Is Gulf stream position modulated by sun ?
You can read more from here :
https://translate.google.com/translate?sl=fi&tl=en&js=y&prev=_t&hl=fi&ie=UTF-8&u=http%3A%2F%2Fwww.saaforum.tk%2F2016%2F08%2F25%2Fgolf-virran-reitti-ja-sen-muutokset-ja-taman-vaikutussuomen-saahan-suomen-saatilastoihin%2F&edit-text=
Why just the NAO? Are other parts of the Earth immune?
They probably didn’t have the funding to correlate anything else
“(T)he team also found that the solar signal is more significant and detectable on an interdecadal time scale in some more sensitive regions, especially the tropical Pacific (eg. lagged dipolar convection pattern in tropical western Pacific; lagged El Nino Modoki-like pattern on tropical ocean surface) and monsoon regions (eg. rainband during the Mei-Yu season; north boundary of East Asian summer monsoon).”
Tom the NAO is pivotal and directly linked to the sun’s activity. As we speak the NAO is positive and AO negative, but they should both be negative in the coming weeks producing a cool damp summer across Europe.
Its a regional cooling signal and I draw your attention to the excellent work (co-authored by Schmidt and Mann) ‘Solar Forcing of Regional Climate Change During the Maunder Minimum.’
“…..robust relationship between solar wind speed and North Atlantic Oscillation was found not only on a day-to-day time scale….”
Please excuse my ignorance, but what is it about the NAO that is measured on a day-to-day timescale? Are we talking about DAILY measurements of atmospheric pressure being robustly related to solar wind speed? That would be quite something, would it not?
I have not got a clue what they measured but looking at UV at sea level would seem to be a good beginning for me, since I think that a lot of the actual evaporation of water occurs on top of the oceans. [TOC} by the amount of UV allowed through the atmosphere.
I don’t see any data measured by these people?
The ozone layer stops all of the UVC, around 90% of UVB and half of UVA.
https://www.bing.com/th?id=OIP.XigsrHlsiz_Y4EzMVxlEXgEsDi&pid=3.1&cb=&w=300&h=300&p=0
I agree that the UV which gets through must have an effect on the oceans. Studies have been written on how far it penetrates under differing conditions.
This is obviously for open ocean, rather than shallow coastal or estuarine conditions:
http://media.midcurrent.com.s3.amazonaws.com/wp-content/uploads/2013/08/depth_distance_640.jpg
Which of course is why the deep sea looks blue. The longer wavelengths of visible light are absorbed shallowly.
@ur momisugly 2:57 Blue?
If all wavelengths are absorbed by an open ocean, it should appear black, although the scattering in the atmosphere causes a blue look.
Or something — it has been a long day.
True, yet the residence time of disparate solar input into the oceans is not quantified, but can likely be years or decades, thus a persistent change, positive or negative, can accumulate daily for years.
Correlation is not cause. It is however a good clue as to where the cause might be hiding.
leif says
What is important is the actual change in ozone and that shows no solar cycle variation
henry says
showing that ozone declines due to human activity (linear) is not that much correlated than natural reasons…
(Sine wave?)
Has the science rat-pack gone after this Ziniu XIAO fellow’s reputation yet? I’m sure they’ll turn to that first.
Surely they’re funded by Big Fortune-Cookie.
Leif says
https://wattsupwiththat.com/2017/04/24/robust-relationship-between-solar-wind-speed-and-north-atlantic-oscillation-discovered/#comment-2484139
Henry says
this looks to me like a circular argument. Chimp is right. The ozone, peroxides and nitrogenous oxides are manufactured by the most energetic particles from the sun [there are more of them during lower solar polar magnetic field strengths]
In its turn, once formed, the ozone, peroxides and N-Oxides back radiate a bit more UV to space. Elementary. Go take a peek at the spectra of peroxide and ozone and get wise.
[hint: there never was a man made ozone hole]
With the help of observations and model simulations, the team also found that the solar signal is more significant and detectable on an interdecadal time scale in some more sensitive regions, especially the tropical Pacific (eg. lagged dipolar convection pattern in tropical western Pacific; lagged El Nino Modoki-like pattern on tropical ocean surface) and monsoon regions (eg. rainband during the Mei-Yu season; north boundary of East Asian summer monsoon).
So, …, how robust and stringently tested is the model? Is this one or two results selected from many analyses?
All the standard problems have to be addressed.
So how small is small? That doesn’t look very scientific.
UVR is the only part of the spectrum that has an effect on ozone creation and destruction, so ozone levels respond to changes in UVR. And UV variability is 37% of TSI variability.
Solar Spectral Irradiance shows that 400-700 nm visible and 1000-2400 nm near infrared are actually out of phase with the solar cycle. And that UV shows larger variability than models can account for. So UV could be most of TSI variability in phase with the solar cycle.
According to Harder et al., 2009, based on SIM observations, 200-400 nm change in irradiation could amount to 1 W/sq m. Not negligible at all.
See for example Tom Woods presentation of 2014
http://www.pages-igbp.org/download/docs/meeting-products/presentations/2014-2nd-solar-forcing-wshop/presentation_Woods.pdf
Plenty there to account for an important role on climate variability, specially since the rarified stratosphere requires very little energy to show significant changes in ozone, temperature and geopotential heights.
Er, not true.
http://i.imgur.com/bjTrU2H.png
Bad science. First the correlation is weak, second the changes are tiny [of the order of 1%], so there is no significant variation with the solar cycle.
lsvalgaard: First the correlation is weak, second the changes are tiny [of the order of 1%], so there is no significant variation with the solar cycle.
Why is 1% not significant? CO2 is alleged to raise Earth surface temperature ca 1% per doubling, or less. Global mean temperature change is almost uncorrelated with CO2 concentration, but that doesn’t mean CO2 is unimportant; why should other low correlations be automatically dismissed because they are equally low?
We dismiss what has but small effects. Starlight from Sirius certainly warms the Earth, but the effect is so small that we dismiss it as nothing to worry about.
Yes, everything that disagrees with your beliefs is bad science.
Other things like stratospheric volcanic eruptions affect O3, but the correlation is clear.
You didn’t look at the data. Is about 4% in all the different types of measurements.
The noise is of the order of 4%.
As usual you are ill informed (or trying to deceive) about things outside your specialty field.
“CHAPTER 3 Global Ozone: Past and Present
3.4.4 Solar Cycle Variations
A decadal variation of total column ozone is observed to be in phase with the solar cycle, with an amplitude of 2-3% from solar minimum to maximum in the tropics (Figure 3-4) and over the 60°S-60°N band (Figure 3-1).
Analyses of SAGE II and UARS HALOE data (Soukharev and Hood, 2006), as well as comparisons between SBUV and TOMS data (e.g., Hood, 1997), suggest that most or all of the apparent total ozone solar cycle variation originates primarily in the lower stratosphere. Thus the observed variation in the ozone column of 2-3% (as discussed above) can be taken to represent the integrated values below about 25 km and 30 km for the 55°S-55°N and 25°S-25°N bands”.
Lead Authors:
M.P. Chipperfield V.E. Fioletov
Coauthors:
B. Bregman J. Burrows B.J. Connor J.D. Haigh N.R.P. Harris A. Hauchecorne L.L. Hood S.R. Kawa J.W. Krzys ́cin J.A. Logan N.J. Muthama L. Polvani W.J. Randel T. Sasaki J. Stähelin R.S. Stolarski L.W. Thomason J.M. Zawodny
Contributors:
G. Bodeker P. Demoulin W. Feng L. Flynn S. Frith S. Guillas M. Ilyas B. Knudsen B. Liley A.J. Miller R. McPeters R. Müller S. Oltmans Y. Orsolini I. Petropavlovskikh W. Steinbrecht H. Struthers D. Tarasick Y. Terao
http://www.iup.uni-bremen.de/~weber/vorlesung_ss07/WMO2006/04_chapter3.pdf
Keep it up. You have decreased the variation from 4% to 2-3%. Keep on going down.
The point is that the variation is SMALL compared to the total amount. The atmosphere is very good at balance production and destruction. Such small imbalances have equally small effect.
Don’t pretend you know anything about this.
lsvalgaard: Starlight from Sirius certainly warms the Earth, but the effect is so small that we dismiss it as nothing to worry about.
That is not close to relevant. Things whose effects are close to the estimated effects of CO2 need better reasoning that that to be dismissed.
Many people here are trying yo convince me that CO2 has absolutely no effect whatsoever so that seems to be in the league of Siriuslight. And you just assume that the UV has a sizable effect. Here is the UV since the 1740s. The climate record looks quite different.
http://www.leif.org/research/EUV-Reconstruction-Long-Term.png
First we should get you to raise yours from 1% to 2-3%, which is a 100-200% increase.
It isn’t hard to know more than you, just by reading about it.
First you said:
“What is important is the actual change in ozone and that shows no solar cycle variation.”
And we know that was not true.
Then you said:
“the changes are tiny [of the order of 1%]”
And we know that it is 2-3%.
All you are left with is with your unbacked claim that surely that must not have any significant effect.
And your fallacious argumentation that for UV variation to have a climatic effect climate variation should look like UV variation. A clear non sequitur fallacy because a forcing can have a significant effect on climate without climate variation looking as the forcing variation. After all there are quite a few forcings and internal variation acting on climate at any moment.
Your bias just shows.
“the changes are tiny [of the order of 1%]”
And we know that it is 2-3%.
‘of the order of’ means that it is not five or more times larger or five or more times smaller.
Point is that the effect is small, i.e. not significant.
forcing can have a significant effect on climate without climate variation looking as the forcing variation. After all there are quite a few forcings and internal variation acting on climate at any moment.
If the forcing signal doesn’t show, then the forcing is insignificant.
And my bias is clear: to show what is significant and not be carried away by the wishful thinking of a converted believer.
“Point is that the effect is small, i.e. not significant.”
You say it is insignificant, but you do not know that. You are just inventing that. There is no way you can know what is significant about things we know so little. Your confidence about things you don’t know is the trademark of the snake oil salesman.
“If the forcing signal doesn’t show, then the forcing is insignificant.”
Again you don’t know that. There is evidence that one of the effects of below average solar activity is to slowly push the AO/NAO towards negative phase. The forcing for that would be hard to spot, but the effect would be huge.
“not be carried away by the wishful thinking of a converted believer.”
You err your shots. I only believe in evidence published in scientific literature. Your opinions are worth nothing to me. The way you talk so sure and so full of it as if you are the ultimate authority about things so complex of which we know so little is completely non-scientific. Everybody here should have alarms ringing about the way you assert your opinions as if they were the truth. I certainly do.
There is no way you can know what is significant about things we know so little.
We do know that the effect is hard to find, therefore not of significant interest.
The forcing for that would be hard to spot, but the effect would be huge.
‘would be’ is just yet another weasel word for not having a clue.
I only believe in evidence published in scientific literature.
Most of scientific papers are wrong, including the ones you elect to believe in.
The difference between us is that I not only read the scientific literature, I write it too.
https://scholar.google.com/citations?hl=en&user=qFdb2fIAAAAJ&pagesize=100&view_op=list_works
Show me yours…
things so complex of which we know so little is completely non-scientific
That covers just about every honest scientist. We do the best we can. Most of it wrong, but some of it good and of lasting value. At every point we believe that what we do is right. If not, it shouldn’t be published against better knowledge.
There are, of course, people who actually don’t know much, but pretend to [“believe in the scientific literature” carefully picked to bolster their agenda. There is little one can do about such people They are lost.
“We do know that the effect is hard to find, therefore not of significant interest.”
Non sequitur. Changes in clouds are hard to find because they are hard to measure, and that doesn’t mean they are not of significant interest.
“‘would be’ is just yet another weasel word for not having a clue.”
You seem to have trouble with the scientific language:
“This is the disadvantage for science communication. Do you listen to the scientific analysis – which is full of probably, maybe, possibly, roughly, estimated, hypothesised – or do you just agree with someone who sounds convincing and shouts down/shuts down dissenting opinions?”
https://www.theguardian.com/science/2017/feb/01/facts-are-the-reason-science-is-losing-in-the-current-war-on-reason-science-communication
You are using the same arguments as anti-science. How sad.
“The difference between us is that I not only read the scientific literature, I write it too.”
You are as wrong on that as on the issue discussed in this thread. Your appeal to authority fallacy is added to the count.
“There are, of course, people who actually don’t know much, but pretend to “believe in the scientific literature” carefully picked to bolster their agenda.”
Now you pretend to read people’s minds and know their intentions. You are really full of it.
Well, there is a difference between people who actually produce science pushing the frontier and expanding our horizon and people who merely consume their biased cherry-picked morsels of what the think is science.
Between people who know and people who don’t.
Javier: According to Harder et al., 2009, based on SIM observations, 200-400 nm change in irradiation could amount to 1 W/sq m. Not negligible at all.
See for example Tom Woods presentation of 2014
http://www.pages-igbp.org/download/docs/meeting-products/presentations/2014-2nd-solar-forcing-wshop/presentation_Woods.pdf
Thank you for the link. Has that been published?
This is an ongoing debate. The general opinion is that the effect is instrumental and not solar. The spectral irradiance is VERY difficult to measure. There is good evidence that UV [and everything else solar] simply varies as the magnetic field and that there is not some unknown cause for the variations:
http://www.leif.org/research/EUV-F107-and-TSI-CDR-HAO.pdf
lsvalgaard: This is an ongoing debate.
I am glad to learn that.
Harder, Jerald W., et al. “Trends in solar spectral irradiance variability in the visible and infrared.” Geophysical Research Letters 36.7 (2009).
http://www.leif.org/EOS/2008GL036797.pdf
Check figure 3.
Old tentative data. The current consensus is that the effect is instrumental. Mainly because an unknown cause must be invoked to ‘explain’ it.
And we all know that following the consensus is the way to go when controversial evidence is found.
Tom Woods shows that SOLSTICE version 12 data partially supports SORCE SIM findings by Harder et al., 2009. You are not on solid ground here. The evidence is being rejected because it doesn’t fit current understanding, not because anybody has demonstrated anything wrong with it.
It is not evidence. And in any event: “extraordinary claims require extraordinary evidence”.
There are good reasons to believe that the SORCE TIM and SIM measurements suffer from unmodeled degradation: http://www.leif.org/research/EUV-F107-and-TSI-CDR-HAO.pdf
Experimenters will continue to defend their bad measurements long after the “sell by date”.
It is well-known that there are calibration problems with the SIM data, e.g.
“Figure 9a shows that the SIM instrument tends to be systematically lower than the SOLSPEC instrument; the disagreement is about 8% for wavelengths greater than 1500 nm. As discuss in Section 4.3, this decreased level of agreement amounts to 30.5 W m−2, a difference too large to be accounted for by any other means besides an instrumental effect” [https://hal-insu.archives-ouvertes.fr/hal-00485170/document].
In short, not all of the instrument properties are known.
lsvalgaard: Many people here are trying yo convince me that CO2 has absolutely no effect whatsoever so that seems to be in the league of Siriuslight.
Not I! I suggested that all effects potentially as potent as CO2 not be dismissed based on supercilious reasoning or outright idiocy. The target article certainly needs backing from future research before it can be “accepted” or “relied upon”, but the claim that 1% is too small an effect to be taken seriously is thoughtless. The net global surface warming since about 1880 is about 1.25 C. It is likely, surely possible, that every real cause has a low correlation.
I suggested that all effects potentially as potent as CO2
What is your evidence for ‘potentially as potent’?
How potent do you think CO2 is?
lsvalgaard: How potent do you think CO2 is?
Doubling CO2 concentration will increase downwelling long wave IR by about 4 W/m^2; raise global mean temperature at the effective radiating level by about 1% (most estimates are a little lower than that); and perhaps raise the Earth surface global mean temperature by about 1% (that I personally doubt, for reasons I wrote out in a short essay that is available on my ResearchGate page, and that I posted here about 2 years ago); and raise the global mean rainfall by about 3% – 6%. The increased CO2 will raise global agricultural productivity and net primary productivity of other terrestrial plant species, but I do not know those in % terms.
How about you? How potent is CO2?
<i.raise the Earth surface global mean temperature by about 1%
Which is 3 degrees. You really think so?
I don’t. And I don’t really know what the correct number is, perhaps half of that.
lsvalgaard: <i.raise the Earth surface global mean temperature by about 1%
Which is 3 degrees. You really think so?
I said “about”. You wrote “on the order of”, which you explained to mean in the interval 0.2% – 5%. I think you are avoiding a consistent standard.
Do I believe 3 degrees? No, as I have written. But the commonly reported CI for the climate sensitivity to doubling is 1.5C – 4.5C. What I “believe” is in the interval 0.2% to 5%. You?
lsvalgaard: “the changes are tiny [of the order of 1%]”
…
‘of the order of’ means that it is not five or more times larger or five or more times smaller.
Earth mean surface temperature has increased 1.25 K on a base of about 287 K, or about 0.4%. Everything relevant to that has an effect on the order of 1% [0.2 – 5%] — Right?
It seems to me that if a consistent standard of effect size is used, a lot of potential effects can not be eliminated on present evidence, weak though it all may be.
Interesting….
Let’s see where the data leads in subsequent reports… and if similar trend data is recorded by independent groups.
I gave the 5 equations from Lief (above at 11.24am) a rate constant , k1, k2 …k5.
Working through the rate equations , ignoring the possible destruction from natural or human generated molecular or atomic species , and assuming that the concentration , or partial pressure of O2 far exceeds that of O3 or the reactive radical O , one gets , for an equilibrium state :
Concentration of O : [O] = approx : k1*Ia * [O2] where Ia is the intensity of the UV in reaction 1
One can then substitute into the equation for [O3] . If as Lief state the intensity of UV is low then the term involving [O2] dominates and the simplified equation for O3 ( at equilibrium ) is
[O3] = 2k* Ia * [O2] ,
ie only the first reaction , the generation, is significant and the ozone concentration is directly dependent on the intensity of incident UV .
This conclusion depends on the relative value of terms like k4*k1*Ia /k2 and k3*Ib ( where Ib is the Intensity of the UV that reacts with O3 – being possibly of different frequency) and one somehow feels that if O2 is one of the major components of the atmosphere, and the UV is , as Lief says , of low intensity , then the O radical and ozone are such minor components that the radiation reaction with the ozone must be much less likely than that with the major component , O2.
So I am inclined to believe those who consider ozone equilibrium levels to be a measure of the incident UV levels even if not the most practical sensor.
Correction ( cannot read my original handwritten scrawl):
[O3] = SQRT (2k1*Ia*[O2])
NO NO NO
The NAO is influencing solar wind speed!
We’re screwing up the sun, too!
Received April 6.
Accepted April 17.
Published April 20.
I’m in Beijing today. I will ask the research department what [they] think of this journal. I suspect the report has no peer review.
“I suspect the report has no peer review.”
This succinct report is the synthesis of a collection of many peer-reviewed papers. For example, 15 citations for recently-published papers appear in these two literature-summary paragraphs.
Xiao et al., 2017
http://www.tandfonline.com/doi/pdf/10.1080/16742834.2017.1321951
Solar wind and electric-microphysical process is the key mechanism that affects climate
We investigated the influencing mechanism of high-energetic particle precipitation modulated by solar wind on the Arctic Oscillation (AO) and North Atlantic Oscillation (NAO). On a day-to-day time scale, Zhou, Tinsley, and Huang (2014) and Huang et al. (2013) found that the minima in AO and NAO indices only lagged 0~2 days of the solar wind speed (SWS) minima during years of high stratospheric aerosol loading, which suggests a much faster mechanism of solar influence on the atmospheric system compared to the ozone destruction process,/b>. From the perspective of year-to-year variation, Xiao and Li (2016) and Zhou et al. (2016) showed a robust relationship between SWS [solar wind speed] and NAO in boreal winter. These aforementioned studies indicate that the wintertime Iceland Low in the North Atlantic was very sensitive to solar wind variations and played an important role in the process of solar wind and electric-microphysical effects on climate. Moreover, under the condition of a weak electric field, we have demonstrated the marked impact of cloud droplet electricity on the collision efficiency of cloud condensation nuclei. This, in turn, suggests that the collision in a cloud microphysics process constitutes the core link between atmospheric electricity and climate (Tinsley and Leddon 2013; Tinsley and Zhou 2013, 2014). Furthermore, Tinsley and Zhou (2015) improved the collision and parameterization scheme that varied with electric quantity in a cloud microphysics process and quantitatively evaluated the effects of high-energetic particle flux on cloud charge. This achievement not only supports the marked association of solar activity with weather and climate change on various time scales, but also but also avails the quantitative accession of solar impacts on climate. It is worth noting that the successful establishment development of a theoretical model regarding of the influencing process of solar energetic particles on the atmosphere improves the development of global climate models.
Solar influence on and modulation of interdecadal variation in air-sea systems
Due to the complexity in the response of air-sea system to solar variation, the full impacts of small changes in solar forcing on climate may be partly veiled. However, our research team found that, on an interdecadal time scale, the solar signal is more significant and detectable in some more sensitive regions, such as the tropical Pacific and monsoon regions. For example, a dipolar pattern of convection was firmly created in the tropical western Pacific and the maritime continent during the one to two years that followed peak years of solar cycle and was accompanied by an eastward shift of deep convection (Xiao, Liao, and Li 2016). Meanwhile, a lagged warming response was observed in the central Pacific both in sea surface temperature and in the main pycnocline of the ocean. Further work revealed that the lagged response of the tropical Pacific to solar cycle forcing can modulate the El Nino Modoki event on an interdecadal time scale through a combination of coupled atmosphere–ocean process and convection–cloud feedback (Huo and Xiao 2016a, 2016b). Interestingly, some fingerprints of the solar cycle in the East Asian summer monsoon (EASM) were detected in our studies. It was first identified that the mean latitude of the rainband during the East Asian generalized Mei-Yu season was evidently modulated by the 11-yr sunspot cycle. This time period was just characterized by a large scale quasi-zonal monsoon rainband (Zhao and Wang 2014). This study also suggested that the north boundary of EASM may be more sensitive to solar forcing than its interior, resulting in a slight northward shift during high solar activity years (Wang and Zhao 2012; Zhao, Wang, and Zhao 2012). In addition, Wang et al. (2015), in examining the relationship between solar activity and wintertime in an East Asian climate, suggested an asymmetric solar influence on the winter climate in East Asia. Further research indicated that this relationship was robust during active solar periods, while the connection was fairly weak during inactive solar phases.
It looks like review article.
It discusses findings of interest to the Chinese, such as East Asian climate and the Tropical West Pacific.
No doubt these areas are in the proximate sphere of influence for them as a nation state, politically as well as from a scientific, agricultural perspective.
It cleverly uses the unquantifiable ‘fingerprint’ term.
So if you think that the CO2 increase has a discernible fingerprint over global climate, as distinct from GCM’s, then they say, ‘so does the solar wind, here is the discussion.’
“Starlight from Sirius certainly warms the Earth, but the effect is so small that we dismiss it as nothing to worry about.”
That statement makes Isvalgaard an anti-science, “Sirius warming skeptic” by mainstream media definition. Let us march!
Global warming, global cooling, weather, climate : “It’s the sun, Stupid!”
http://astroclimateconnection.blogspot.com.au/2016/03/evidence-that-sun-has-always-had.html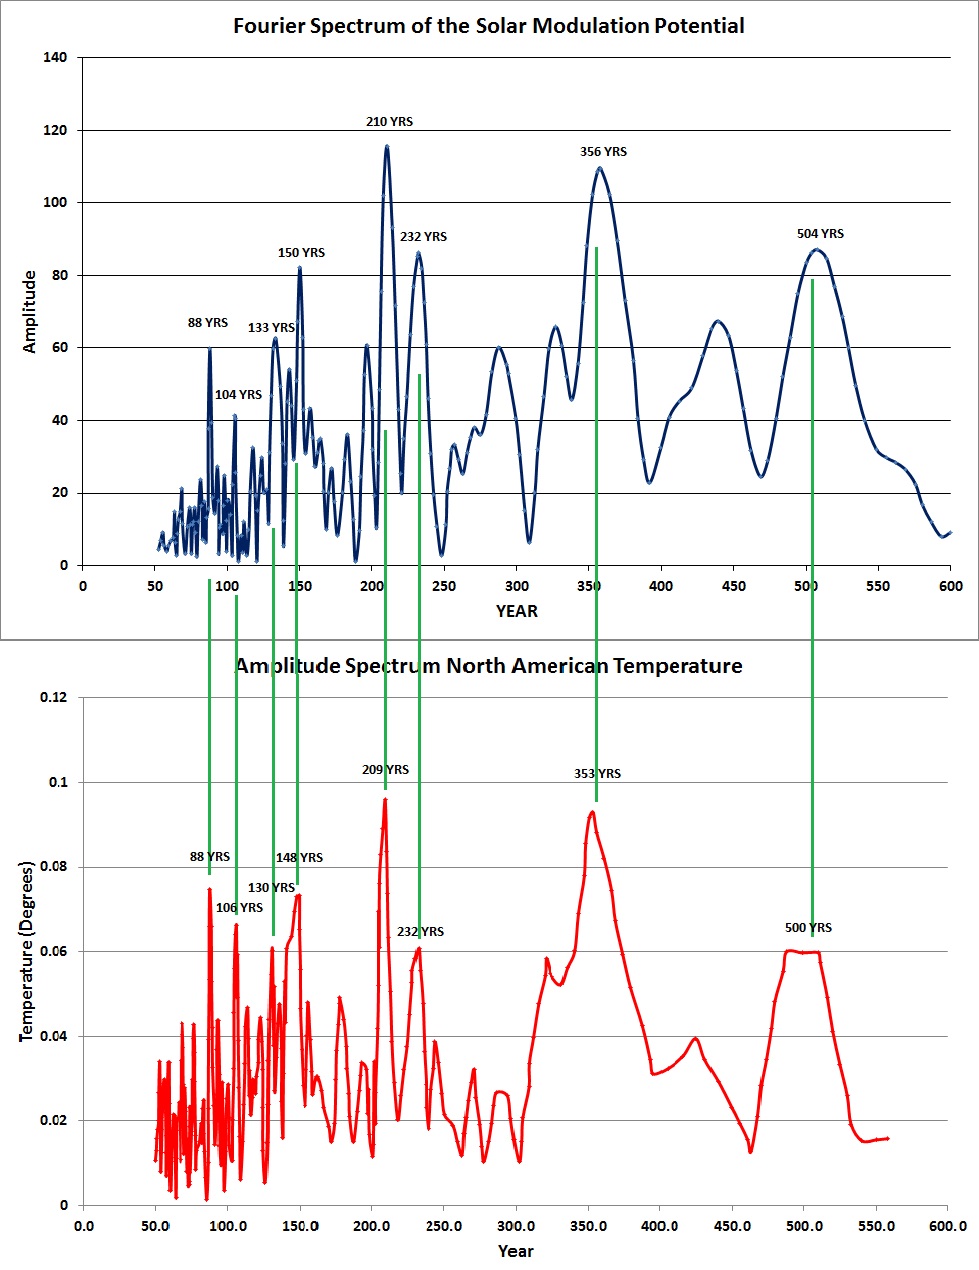
Evidence that the Sun has always had an important influence upon climate change
Abreu et al. [2012] wrote:
“The parameter that best represents the role of the solar magnetic field in deflecting cosmic
rays [and hence, the overall level of solar activity] is the solar modulation potential , which can be derived from either the 10Be or the 14C production rates.”
and
“….spectral analysis [of the solar modulation potential over the last ~ 9400 years] identifies a number of distinct periodicities (Stuiver & Braziunas 1993), such as 88 yr (Gleissberg), 104 yr, 150 yr, 208 yr (de Vries), 506 yr, 1000 yr (Eddy), and 2200 yr (Hallstatt) [cycles]…”
The top figure in the following diagram shows the Fourier transform of the variation in the solar modulation potential time series over the last 9400 years [Abreu et al. 2012]. This figure shows that potential has distinct spectral peaks at 88 years (Gleissberg Cycle), 104 years, 133 years, 150 years, 210 years (de Vries Cycle), 232 years, 356 years and 504 years.
Below this is a second figure showing amplitude spectrum of variations in the North American temperature time series over the last ~ 7000 years. The temperature time series is obtained from tree ring data obtained from Bristle Cones on the Southern Colorado Plateau [for the details of the source of this data see: Could This Be The Climate Smoking Gun? and Salzer and Kipfmeuller (2005). The lower figure shows clear spectral peaks at approximately 88, 106, 130, 148, 209, 232, 353 and 500 years.
This seems to be strong evidence that Sun has always had an important influence upon climate conditions [such as temperature] at a regional level. Why are some many people ignoring this obvious climate connection?
I read through the report. There wasn’t enough data to even begin to see if their claim is real. Science by puff piece so far …
w.
There are only 2 AMO cycles on the record books, so there’s not enough data to get any reasonable correlations for another 2 cycles or so. Let’s talk about this again in 2157 or when they find a reasonably long time period proxy for the AMO.