A ground-breaking new paper has recently been published in Earth System Dynamics that really turns the idea of direct linear warming of the atmosphere on it’s ear, suggesting a “store and release mechanism” by the oceans, which explains why there seemed to be a shift in global temperature during the 1997/98 super El Nino followed by a “pause” in global temperatures.
Remember the “escalator” graph from wrongly named “Skeptcal Science” designed to shame climate skeptics? Looks like that may have been an accidentally prescient backfire on their part based on the findings of this new paper.

The paper is: “Reconciling the signal and noise of atmospheric warming on decadal timescales“, Roger N. Jones and James H. Ricketts, Earth System Dynamics, 8 (1), 2017.
Abstract:
“Interactions between externally forced and internally generated climate variations on decadal timescales is a major determinant of changing climate risk. Severe testing is applied to observed global and regional surface and satellite temperatures and modelled surface temperatures to determine whether these interactions are independent, as in the traditional signal-to-noise model, or whether they interact, resulting in step-like warming.
“The multistep bivariate test is used to detect step changes in temperature data. The resulting data are then subject to six tests designed to distinguish between the two statistical hypotheses, hstep and htrend.
Test 1: since the mid-20th century, most observed warming has taken place in four events: in 1979/80 and 1997/98 at the global scale, 1988/89 in the Northern Hemisphere and 1968–70 in the Southern Hemisphere. Temperature is more step-like than trend-like on a regional basis. Satellite temperature is more step-like than surface temperature. Warming from internal trends is less than 40 % of the total for four of five global records tested (1880–2013/14).
Test 2: correlations between step-change frequency in observations and models (1880–2005) are 0.32 (CMIP3) and 0.34 (CMIP5). For the period 1950–2005, grouping selected events (1963/64, 1968–70, 1976/77, 1979/80, 1987/88 and 1996–98), the correlation increases to 0.78.
Test 3: steps and shifts (steps minus internal trends) from a 107-member climate model ensemble (2006–2095) explain total warming and equilibrium climate sensitivity better than internal trends.
Test 4: in three regions tested, the change between stationary and non-stationary temperatures is step-like and attributable to external forcing.
Test 5: step-like changes are also present in tide gauge observations, rainfall, ocean heat content and related variables.
Test 6: across a selection of tests, a simple stepladder model better represents the internal structures of warming than a simple trend, providing strong evidence that the climate system is exhibiting complex system behaviour on decadal timescales.
“This model indicates that in situ warming of the atmosphere does not occur; instead, a store-and-release mechanism from the ocean to the atmosphere is proposed. It is physically plausible and theoretically sound. The presence of step-like – rather than gradual – warming is important information for characterising and managing future climate risk.”
The results:

Here they outline their reasoning for finding steps in warming:
If climate changes in a stepwise manner, it would be expected that other variables would show signs of this (Test 5). Instances of step changes in the literature are widespread, and are mentioned elsewhere in this paper (e.g. Table 6). For rainfall, notable examples are a step change in the Sahel in 1970 (L’Hôte et al., 2002; Mahé and Paturel, 2009), south-west Western Australia (WA) in the late 1960s and early 1970s (Li et al., 2005; Power et al., 2005; Hope et al., 2010) and the western US in the 1930s (Narisma et al., 2007). Similar changes have been detected in streamflow records worldwide, showing that regime changes in moisture have been a long-standing aspect of climate variability (Whetton et al., 1990).
A few more recent changes have been directly attributed to increasing gases, although south-west WA is an exception (Cai and Cowan, 2006; Timbal et al., 2006; Delworth and Zeng, 2014), with large-scale shifts in synoptic types accompanying a rapid decrease in rainfall (Hope et al., 2006). The bivariate test identifies a step change in southwest WA winter rainfall in 1969 (shown in Fig. 6a), with an upward step in summer rainfall in northern Australia 1 year later. Ocean heat content of the upper ocean also shows step changes occurring in 1977, 1996 and 2003 (Fig. 6b).
Changes in long-run tide gauge records also show a stepladder-like process of sea level rise, with the San Francisco record, quality controlled and dating back to 1855, being a good example; it shows step changes in 1866, 1935, 1957 and 1982 (Fig. 6c). Step changes in the Fremantle tide gauge data records, one of the longest in the Southern Hemisphere, shows that most of the decline in the average return intervals of extreme events noted by Church et al. (2006) before and after 1950 occurred in two events (Fig. 6d) in the late 1940s and the late 1990s. This variation in rise was noted by White et al. (2014). None of the internal trends in Fig. 6a–d attain p < 0.05, showing the dynamic nature of change and limited trend-like behaviour in these examples.

They did quite a bit of testing to separate the idea of steps from trends, and identified specific dates of steps, and in the case of the 97/98 super El Nino, a regime change:
Table 6 summarises the major tests undertaken with expected outcomes for htrend and hstep. While objections could be made to each of these on an individual basis, collectively they show that for externally forced warming on decadal scales, hstep is better supported than htrend.
In summary, these tests show that hstep is a close approximation of the data when analysing decadal-scale warming. Over the long term, this warming conforms to a complex trend that can be simplified as a monotonic curve, but the actual pathway is step-like. As outlined in Sect. 3.3, this rules out gradual warming, either in situ in the atmosphere or as a gradual release from the ocean, in favour of a more abrupt process of storage and release. This conclusion supports the substantive hypothesis H2 over H1, where the climate change and variability interact, rather than varying independently.

Here, they defend the step mechanism as be part of the Earth climate system, but ignored in favor of searching for linear trends:
Proposed mechanisms for step-like warming The correlation between step-like warming and ECS in the models, between the timing of steps in model hindcasts and observations and between steps and known regime changes in observations (Table 6), provides strong evidence that warming is non-gradual on decadal timescales.
The high correlations of steps and shifts with model ECS indicate that atmospheric feedback processes respond to abrupt releases of heat into the atmosphere. The presence of negligible internal trends occurring over some oceanic regions, the region 30– 60◦ N, and in tropospheric satellite temperatures, suggests that little of the heat being trapped in the atmosphere by anthropogenic greenhouse gases actually remains there. One justification given for rejecting externally driven steplike warming is that it is presumed that there is no plausible physical mechanism for this (Cahill et al., 2015; Foster and Abraham, 2015). However, to suggest that the stepwise release of heat energy is physically implausible overlooks the energetics of the ocean–atmosphere system. Hydrodynamic processes are quite capable of supplying the energy required (Ozawa et al., 2003; Lucarini and Ragone, 2011; Ghil, 2012).
The atmosphere contains as much heat energy as the top 3.2 m of ocean (Bureau of Meteorology, 2003). About 93 % of historically added heat currently resides in the ocean (Levitus et al., 2012; Roemmich et al., 2015), whereas the atmosphere contains about 3 % of the total. A similar amount of the heat has been stored within the land mass (Balmaseda et al., 2013) and on an annual basis a similar flux is absorbed in melting ice (Hansen et al., 2011). A physical reorganisation of the ocean–atmosphere system, as part of a regime change, is therefore large enough to provide the relatively small amount of energy required to cause abrupt sea surface and atmospheric warming (Roemmich et al., 2015; Reid et al., 2016), as shown by rapid changes in shallow ocean heat content (Fig. 6b; Roemmich and Gilson, 2011; Reid, 2016).
For example, Reid et al. (2016) in describing the late 1980s regime change, show it was associated with large-scale shifts in temperature and multiple impacts across terrestrial and marine systems, mainly in the Northern Hemisphere. Changes in the North Pacific in 1977 were considered even more extensive (Hare and Mantua, 2000), as were those in 1997/98 involving both the Pacific and Atlantic oceans (Chikamoto et al., 2012a, b). In developing tests for detection and attribution, Jones (2012) noted two types of regime change over land: one where codependent variables such as maximum temperature and rainfall undergo a step change but remain in a stationary relationship, and the other, nonstationary change, where warming undergoes a step change independent of rainfall change. This suggests that although regime changes are a normal part of internal climate variability, they can be enhanced, releasing extra heat. The step changes summarised in Table 6 coincide with El Niño events but the heat emitted by other El Niño events dissipates and is absorbed back into the ocean within months; thus, an added mechanism is required.
We propose that there is negligible in situ atmospheric warming and that almost all of the added heat trapped by anthropogenic greenhouse gases is absorbed by and stored in the ocean. It is subsequently released through the action of oscillatory mechanisms associated with regime shifts. Most heat (long-wave radiation) is trapped near the ground or ocean surface and much of that is radiated downwards (Trenberth, 2011). The atmosphere as a whole has little intrinsic heat memory and does not warm independently of the surface.
This is supported by observations on land where the overpassing air mass takes on the characteristics of the underlying surface, achieving energy balance within a 300 m distance (Morton, 1983). When passing from land to water, this will see all of the available heat energy taken up by water if the temperature of the air mass exceeds that of water (Morton, 1983, 1986), with the temperature of the overpassing air mass reaching equilibrium with the water beneath within a very short time. Very little of the heat trapped over land can be absorbed by the land surface, but will be transported from land to ocean within a few days to a few weeks, where it can be absorbed (the high latitudes being an exception).
Given that the atmosphere interacts with the top 70 m of ocean over an annual cycle (Hartmann, 1994), there is ample opportunity for the majority of available heat trapped over land that is not absorbed by land, lakes and ice to be absorbed by the ocean.
That’s a serious and credible argument. Here is an exceprt from their conclusion discussion:
Our conclusion that the atmosphere does not warm in situ will challenge many who consider that to be a basic part of the greenhouse effect. However, an exhaustive search of the literature failed to find any direct evidence that this actually takes place. We find it hard to perceive how an additional increment of long-wave radiation on the order of ∼ 0.2 Wm−2 (direct forcing and feedback derived from Schmidt et al. 2010) can behave differently to the ∼ 155 Wm−2 produced in the atmosphere year to year without being absorbed by the wider climate system.
Given that climate models exhibit step-like warming, where the abrupt component carries the greater part of the signal than internal trends, they produce emergent behaviour that is not identified by mainstream analytic approaches. Overwhelmingly, model- and statistically based studies represent the global warming signal as changing gradually. Some are prescriptive because of their structure or because they apply simplified assumptions about a more complex climate system, other models examine a small part of the system, and some have a historical legacy bestowing familiarity and reliability.
Modern climate models are almost as complex as the climate, and thus need to be understood through simpler models (Held, 2005; Benestad, 2016), forming a nested modelling approach from simple through to complex (Schneider and Dickinson, 1974; Ghil, 2015). The linking of trend analysis methods with gradual change may overlook the distinction between process-based and diagnostic models.
A diagnostic model may identify a trend without necessarily indicating a gradual process. A large part of the climate wars has been fought over this very point. Nonlinear responses in climate are being investigated by researchers, with an interest in complex system behaviour via dynamical systems and related theory. Our conclusions suggest that the processes of radiative transfer and subsequent warming take place in two separate domains of the climate system, separated by a delay. The absorption of radiation is a linear process that is quite separate from the behaviour of turbulent dissipation of heat energy within the climate system, which is fundamentally nonlinear (Ozawa et al., 2003). Developments based on deterministic nonlinear and stochastic linear behaviour originating from work by Lorenz (1963) and Hasselmann (1976) respectively explore a range of interrelated phenomena, such as non-equilibrium stable states, oscillators, strange attractors, bifurcations and entropy production, in order to develop a unified theory of climate (Ozawa et al., 2003; Lucarini et al., 2014; Franzke et al., 2015; Ghil, 2015). Studying how the free and forced aspects of change combine to alter the statistical properties of climate is a specific goal (Lucarini and Sarno, 2011; Ghil, 2012, 2015).
Our focus is on understanding the role of linear and nonlinear behaviour in changing climate risk over decadal timescales, specifically how initial condition and boundarylimited uncertainties (as described by Lorenz, 1975 and Hasselmann, 2002) combine. Initial-condition uncertainty is boundary limited, varying within a certain amplitude, with the outcome depending on the pathway taken within those limits (Lorenz, 1975).
There is also a time-dependent window that serves as a predictability barrier. Changing boundary conditions are intransitive, with the outcome being insensitive to initial conditions. The nested nature of climate phenomena over different timescales results in decadalscale climates being both an initial-condition and intransitive process, combining to produce stochastically driven step changes in warming that integrate into a long-term complex trend.
The coincident timing of step changes in both observations and models (Fig. 7) suggests that other factors, such as short-term volcanic forcing, can also influence the timing of step changes. Lorenz (1968) referred to the outcome of forced climate change on century timescales as almost intransitive. The “almost” is due to initial condition uncertainties operating within the boundary limitations of decadal variability. The almost-intransitive model (Lorenz, 1968) is described via linear response theory (Lucarini et al., 2014; Ragone et al., 2016) and shown to be robust for concepts such as effective radiative forcing (Hansen et al., 2005) and effective climate sensitivity (Andrews et al., 2015), although these phenomena would be sensitive to bifurcations if they were to occur (Hasselmann, 2002).
This is the first paper I’ve ever read that ties together models, observations, and chaos theory of the atmosphere from Lorenz. It makes many excellent points, and it will be interesting to see if those at the top of the climate science food chain like Mann, Trenberth, and Schmidt accept these new ideas, or dismiss them and call anyone who believes them “linear trend deniers“.
Besides these new findings, what is refreshing is that the paper had open peer review, with both editor and reviewer comments published here.
The final revised paper is available here. Well worth a read! I look forward to seeing the reactions.
And, they published data and code! Code is included with the Supplement as a zip file (Python and R modules). Data availability. Included with the Supplement as Excel files.
h/t to Larry Kummer of Fabius Maximus who has a long list of papers on the subject of testing models (with links) at the end of this post.
Discover more from Watts Up With That?
Subscribe to get the latest posts sent to your email.
I have long suspected that heat from chemical reactions of calcium carbonate have a major effect on Ocean temperatures. I cannot prove how it works; it will take a senior chemist with good computer support to figure out the details. The chemical reactions and their effect would be as follows:
1. The limiting of open ocean water and inland lakes to 30 -31C is caused by the inorganic deposition of calcium carbonate, this process has been known for over a century; but, no one understands how the process works. Currently, the limitation of the temperature is attributed to other processes; however, the process is global and appears to be a chemical process. My suspicion is that as water warms to near 30C carbon dioxide is released and reacts with calcium compounds to form calcium carbonate. Sufficient heat is removed to effectively limit the temperature to 31C. This process is present in all bodies of water both fresh and salt except the Persian Gulf, a lake in Southern Russia, and mud flat areas along coastlines.
2. As calcium carbonate in hard forms such as shells or in powder form from chemical reactions fall to the bottom of the Ocean, they are “dissolved” at the Carbonate Compensation Depth CCD. The “dissolving” is generally attributed to weak carbonic acid in the Ocean; however, when a compound dissolves in water it does so by water molecules attaching to the substance and the compound becomes hydrated. Calcium carbonate hydrates in steps generally forming Calcium hexahydrate , although higher hydration is possible. Calcium Carbonate dissolved by carbonic acid is energy favorable to forming calcium hexahydrate and the Calcium hexahydrate forms directly. The forming of the hexahydrate removes up to 75 kilojoules of energy per each mole formed. Calcium hexhydrate is stable only at low temperatures and reverts back to calcium carbonate and water at 4-6C. The energy is released when ocean currents bring the calcium hexahydrate near the surface. the 4-6C temperature is exceeded and additional heat is released warming the Ocean as described above.
Bob Tisdale suggested this stepwise heating when studying Ocean temperatures.
https://bobtisdale.wordpress.com/2017/01/10/december-2016-sea-surface-temperature-sst-anomaly-update/
Thanks for link, oppti. I also discuss the processes that cause the upward steps in my free ebook “Who Turned on the Heat? – The Unsuspected Global Warming Culprit, El Niño-Southern Oscillation”
https://bobtisdale.files.wordpress.com/2016/05/v2-tisdale-who-turned-on-the-heat-free-edition.pdf
Cheers
“Modern climate models are almost as complex as the climate, ”
Nice
🙂
It’s a casual backhand that my Irish grandfather would have enjoyed tossing into a conversation. If the models are that complex, then they can never be validated or trusted. Their confidence will always be too low for decision making. So, at best, they are useful for designing experiments, more likely academic toys. At least they’ve justified some continued investment in high performance computing.
I’ve always said that such models are useful for helping you to figure out what it is that you don’t know.
Put all that you know into the model, then compare the model to the real world. Figure out where the model results differ from the real world. Then try to figure out why the model differs from the real world.
Once you have that figured out. Put your new understanding into the model.
Lather rinse repeat.
Another thing, stay humble, just because your model happens to match the real world for the period of time being studied, could always be just a coincidence.
As some say, “almost” only counts in horseshoes and hand grenades.
Except when “almost” means +/- 1000 miles.
It will be worse than we thought, it will now be humanity at risk of being trampled by the steps of the anthropogenic climate jackboot.
excellent.
My point is that CAGW believers are not people who understand much of anything unless it is demonstrated in such a manner as to leave them speechless which is what happens(algore movies anyone).
See Khwarzmi question about evaporation – how does the air(moving) heat water and at the same time
evaporate it(releasing heat)?
It is a relief to read, at long last, a proposal that fits exactly with my own view on climate (especially temperature) time series.which I have held and believed in since discovering it in the early 1990s. The climatologists that I have contacted about my beliefs, and supplied them with graphics evidence for them, have, I have to presume, simply binned my efforts, since I have never had a reply.
If you know how to look at data in a manner that does not blindfold you with long-term linear modelling, you will find that almost every single site series contains strong evidence for step changes. Vinther’s S W Greenland data contains a blatant example that he entirely missed and presumably does not wish to know about even after I pointed it out to him.
Linear fitting is perfectly good and natural for series that are inherently linear underneath their noise components (what is this noise, by the way?), but NOT when the series spans a step change. How to spot a step change? Using formal statistical methods it is a bit of a computational bore, especially when insisting on 95% levels of significance, but there is a really simple method long known to SQC people that works perfectly well in practice, otherwise they would not use it.
Look up “Cusums” and find out what you’ve missed!
Here’s a hint:- look at temperature data for any site in NW Europe, from Brest to Moscow, and Tromso to Lausanne and concentrate on late 1987, or perhaps a little later. That’s when the pause for this part of the world began.
Another hint! Averaged data from a wide-ranging geographical area are less likely to display step changes, since these changes are not necessarily simultaneous, and might be displaced from one another by a few months, blurring the sharpness of the change.
If you want to know more you’ll have to contact me via email – ask Anthony – and I’ll send you some plots. I can’t put plots on this blog.
Robin
Cusum is a standard 6sigma quality control technique. It works because a production machine/process in proper calibration will still produce acceptable small random variations. The cumulative error will wander around zero. If it goes out of quality calibration, the cusum will rapidly grow to a large positive or negative number. But this is because the acceptable minor production process error is statistical white noise ( normally distributed per the central limit theorem around a mean of zero). Most climate data, especially temperature data, is autocorrelated so contains red noise rather than white noise. Therefore cusum is unreliable and should not be used.
What do you think about multiple climate series by independent observers in the same country (Switzerland) at various levels 2600 m to little above sea level, (ski resorts to summer holiday spots) with accompanying widely different average temperatures? The observers will certainly be professionals, and the data come from Meteo Suisse. /All/ the sites produce cusum plots that are remarkably similar, all with what I choose to call a step change in the autumn of 1987, in essence the same month. Would you expect all the sites to have the same autocorrelation, and thus I suppose inevitably lead to effectively identical red noise? (And effectively identical cusum plots). I find it very strange.
Just asking for some advice.
Robin
Robin, just got back here. In a small country like Switzerland, excepting things like summer thunderstorms the main site temperature difference is going to be the altutude lapse rate. That can be washed out by comparing site anomalies from a universal baseline. The temps or their anomalies are still going to have red noise. Red noise can automatically produces spurious steps. Perhaps autumn 87 is one. Was there some change in reporting (like TOBS in the US)?
But I am sure Qusum relies on a white noise assumption for its quality control utility. Had the full 6sigma training at Motorola.
Ristvan, Thanks for responding. I appreciate your concern over “red noise” and have done a bit more reading on the subject, as well as some practical tests. First, please note that I /never/ make any mention of forecasting. Trying to use cusum values for that would clearly be nonsense. I write solely about historical data, anywhere from recent months back to the 17th century in some cases.
I view a cusum plot as simply a technique for displaying time series in a manner that disguises nothing. It uses all the data, and it can be back-transformed to the original series by simple subtraction sums. There is no smoothing of any type in the primary cusum. I am not fitting a curve, just simply displaying what the observing/reporting scientist released from his research. There can surely be no objection to this. Other plots, whilst displaying the original data, seem to be aimed at devising simplifications and explanations for them. This sort of work is the province over those who are convinced that climate data are inherently cyclic in nature, which may well be the case, or of those whose thinking tends towards identification of potential forcings. Again, this may be a soundly based technique or belief. I don’t know about either of these underlying climate drivers, but I do think that I can detect the effect(s) that they may have.
My very general conclusion is that climate observations are prone to very sudden step changes that may give no hint of their imminence. As far as I can see (so far), such things simply happen. And when they do the predictions of the projectionists fall apart.
I mentioned my simple findings on temperatures recorded in Switzerland – specifically the ubiquitous step change in late 1987. Such a clear-cut effect cannot be laid at the foot of happenstance or correlated residuals, red or otherwise. It is a highly self-supporting comment on assiduously measured scientific data, collected by independent laboratories or observation posts over a long time period. It just has to be real!
I have been adding red noise to the CET monthly data. Even with a noise signal that is comparable in magnitude (standard deviation) to the Std Dev of monthly differences (anomalies?) the form of the cusum of the adulterated series is preserved, with all its major features intact. Can’t simply be the underlying problems of forecasting using cusums, which are real. My advice is not to try to forecast climate time series beyond three or four observations, by which time your mistakes will still be undetectable!.
If you wish to spend a relaxed half hour just pick a temperature time series from north west Europe, generate the monthly differences if that’s a simple task, and then the cusum of the new series. Bingo, an obvious sharp angle at a change point (in late 1987), with little if any change since then.
There, I’ve made a prediction :-))
The most important part of this paper is the quoted paragraph:
There have been many essay’s here and at Judith Curry’s making this point, some by myself. (see here and here, here, here and here.)
The step-change concept is covered most specifically in Chaos & Climate – Part 2: Chaos = Stability
. As external factors slightly change the non-linerar system, it can shift to a new stable-level output. Each of these levels are self-enforcingly stable — thus the stair-step effect.
If the system is pushed too hard, it will eventually hit the chaotic realm for that system….but before it gets there, we will see a bifurcation — oscillations between two (or more) values.
The Earth climate system may exhibit this chaotic oscillation in what we know as Ice Ages and Interglacials, but it does not appear in the modern temperature of record of the current interglacial.
Thanks for this. I must follow the links, but not just now because it is too late for me. I am particularly interested in your penultimate paragraph. Robin
The authors in figure 3 used the highly “tampered” with temperature data that makes early 20th century a warming insignificant relative late 20th century “warming”. Not a statistician but I wonder what effect the non-cooled data would have on their results?
Robin
I wrote on this very subject over 3 years ago
https://judithcurry.com/2013/06/26/noticeable-climate-change/
The climate steps (especially the 50 year ones) are very clear in this study, that used CET, which allows us to go back hundreds of years.
These steps were observed by scientists of the past as well, so whilst this recent study may update our knowledge it is not telling us anything new.
Incidentally, my own reconstruction back to 1538 from the official 1650, illustrates an intriguing step up again, after the step downs we can observe that heralded the intermittent little ice age.
tonyb
Tonyb, the climate regime steps in your analysis of CET on order of multidecades are believable. The more numerous shorter steps illustrated above are statistically dubious. See my longer comment below.
robin
you can contact me at tonyATclimatereasonDOTcom
please let me know you have seen this
tonyb
Here is what’s really going on. We are just past a millennial and 60 year natural ( solar activity driven ) temperature peak.
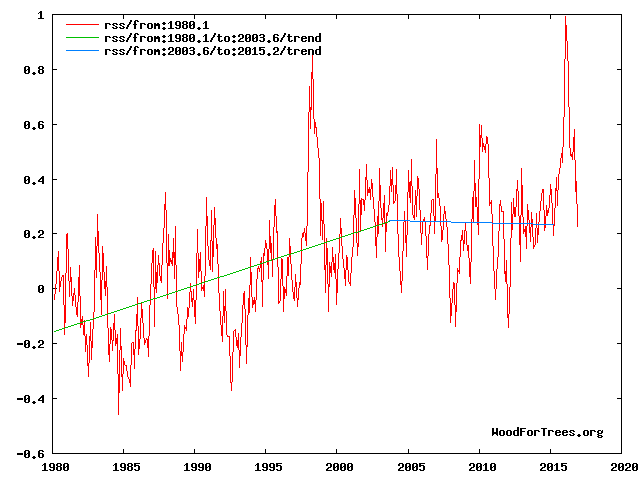
The RSS cooling trend in Fig. 4 (above) was truncated at 2015.3 , because it makes no sense to start or end the analysis of a time series in the middle of major ENSO events which create ephemeral deviations from the longer term trends. By the end of 2016, the strong El Nino temperature anomaly had declined rapidly. The cooling trend is likely to be fully restored by the end of 2019.
Here is the 100 year forecast
Fig. 12 (above) compares the IPCC forecast with the Akasofu (31) forecast (red harmonic) and with the simple and most reasonable working hypothesis of this paper (green line) that the “Golden Spike” temperature peak at about 2004 is the most recent peak in the millennial cycle. Akasofu forecasts a further temperature increase to 2100 to be 0.5°C ± 0.2C, rather than 4.0 C +/- 2.0C predicted by the IPCC. but this interpretation ignores the Millennial inflexion point at 2004. Fig. 12 shows that the well documented 60-year temperature cycle coincidentally also peaks at about 2004.Looking at the shorter 60+/- year wavelength modulation of the millennial trend, the most straightforward hypothesis is that the cooling trends from 2004 forward will simply be a mirror image of the recent rising trends. This is illustrated by the green curves in Fig. 12, which shows cooling until 2038, slight warming to 2073 and then cooling to the end of the century, by which time almost all of the 20th century warming will have been reversed

The temperature inflexion point at 2004 corresponds with a 12 year +/- lag to the Solar activity high ( Neutron low) at 1991.
The same inflexion point is also seen in the global temperature and tropical cloud cover data.
For the Published paper on this see http://journals.sagepub.com/doi/full/10.1177/0958305X16686488
for the Blog version see
http://climatesense-norpag.blogspot.com/2017/02/the-coming-cooling-usefully-accurate_17.html
About 50% of months are either ENSO + or -. This provides so much noise that it is easy to visualize steps. Unskeptical Science used this noise to create their silly stepladder. Hence, anyone can manufacture steps to their hearts content. It doesn’t mean anything. I think Bill Illis corrects the data for ENSO and gets a much smoother curve with a slight warming trend of about .04 C / decade.
Sorry but I just don’t see anything useful here.
I am a pH.D level econometrician, and do not think very highly of this paper’s findings. Temperature times series are autocorrelated. That means the error ‘noise’ around the true ‘signal’ is red noise, not white noise. This means that spurious ‘steps’ will be automatically be found by most step detection methods that do not exist in reality. This is not new news. For a fuller discussion specific to climate, see Radionov, ‘The Problem of Red Noise in Climate Regime Shift Detection’ at http://www.beringclimate.noaa.gov. I sought a specific pertinent reference, took about 20 minutes to find using google-fu.
This is also a major problem in econometrics on matters like persistent unemployment, inflation, and capital investment. Easy to generate pseudosteps from autocorrelated economic data with red noise that do not at all reflect the underlying systemic drivers. Learned that long ago at university.
Incidentally, this same red noise property is why Mann’s centered principal components technique automatically generates hockey sticks from red noise paleoproxies. See the McIntyre and McKittrick( who is an econometrician) paper for details.
ristvan ==> Before passing judgement, you should read the full paper (which I assume you have done) AND the review materials and the discussion for the paper available from this page. Radionov is fully covered and accounted for.
This is a very serious paper and very important for the advancement of climate science in general.
I hear that we will be seeing a technical piece on this at Climate Etc. sometime soonish.
To dismiss this paper and its implications for the larger field of climate dynamics would be a huge mistake.
Kip, I think not. Went back and double checked both the methods section and all the footnotes. Nowhere is Radionov mentioned. Which means their statistical methods section is faulty for the reason stated that Radionov treats with mathematical detail.
ristvan ==> Rodionov is taken into account in the final paper, specifically mentioned in the text and referenced twice.
Same for the original discussion paper.
In the Author’s Comments (response) to reviewers, Jones states they use the “Rodionov test”.
“Mann’s centered principal components technique automatically generates hockey sticks from red noise paleoproxies.” … No matter how many times you repeat that falsehood, it won’t make it true: http://onlinelibrary.wiley.com/doi/10.1029/2005GL022753/full
I refer to McIntyre and McKittricks peer reviewed paper, which despite several efforts has never been properly refuted.
Not only was it refuted in the the link I provided (which you may not like because it was a “comment”) it was “properly” refuted here: http://link.springer.com/article/10.1007%2Fs10584-006-9105-7 The problem that your criticism has is that there are a wealth of subsequent studies that have confirmed Mann’s initial findings. So, you’d best stop focusing on Mann’s work, and focus instead on the fact that many different reconstructions, using data from many different sources and proxies, all show the same thing.
Ristvan, in science its called “reproducible,” the hallmark of scientific fact.
Steve,
No valid science has confirmed Mann’s HS. It’s a complete and total fr@ud and statistical nonsense.
PS, Mann himself addressed all of MM05 here: http://www.pnas.org/content/105/36/13252.full
Here’s what Tricky Mickey’s crime looks like when the decline isn’t hidden:
https://www.ihatethemedia.com/global-warming-hockey-stick-debunked
Gloateus: http://environmentalforest.blogspot.cz/2013/10/enough-hockey-sticks-for-team.html
Steve @ur momisugly 2:53,
And McIntyre demolished Mann’s pathetic response:
http://www.powerlineblog.com/archives/2014/05/michael-mann-is-a-liar-and-a-cheat-heres-why.php
Gloateus, got something better than a blog post?
Steve @ur momisugly 2:55,
The valid studies don’t say what you claim they do.
The borehole paper says it takes a century for surface temps to affect the boreholes, but finds that over the past 500 years, there has been a 1.1 K rise in the NH and 0.8 K rise in the SH. Since earth has been coming out of the depths of the LIA for the past ~320 years, this finding supports man-made global warming, how exactly?
Yes. It links to Climate Audit’s refutation of Mann’s lies and drivel.
Gloateus, I provided you with a list of over 30 subsequent papers that confirm Mann’s work. You comment about a borehole in one of the studies. First of all, if you want to refute a paper, please cite the paper that refutes it……your “comment” isn’t worth much in the world of science, unless it’s published in some reputable publication. Even if I concur with your borehole objection, you now have 29 more papers to refute…… I’ll gladly wait for them.
.
PS…..citing “Climate Audit” doesn’t mean much, as I’m pretty sure it’s not peer-reviewed.
Also Gloateus, you say: “Since earth has been coming out of the depths of the LIA for the past ~320 years”….do you have an explanation why this is happening? You know, like a physical, measurable reason this has happened?
SH, you avoid the core Mann criticism because there is no legitimate response. MHB 99 is thoroughly illegitimate.
You segue to its ‘replication’ and cite Pages2k. Your problem is that those ‘replications’ suffer many of the same technical problems as Mann.
McIntyre has been tireless in exposing these across many posts. Upside down Tiljander in Pages2k, for gosh sakes. Most greviousmwas the ‘newest’ Gergis contribution, after themoriginal was withdrawn before publication after a single simple SM comment. If Gergis is the level of paleoclimate sausage making you find acceptible, begone. Because you then agree effect precedes cause. Not in my world.
Oh, and your ‘not peer reviewed’ classical warmunist objection is priceless in light of Climategate. Objective facts are easily ascertainable independent of pal review. Not like in the old ivory tower days. Wrote a whole book about that published in 2012, The Arts of Truth. You would benefit from reading it. Hundreds of examples in multiple theme catagories like education, health care, energy before getting to the culminating climate change chapter critiqued by Lindzen himself at MIT weeks before he retired.
Ristvan, please point me to the paper that refutes pages2K. Mann 2008 addressed MM05. If you sources of refutation are blogs, please stop making me laugh. I provided a list of over 35 papers which confirm Mann’s original work. You cite a blog. Then you cite stolen emails. Then you cite a book. Do you actually have clue about science is actually done?
Steven Heins, you are relying on the classic “appeal to authority” fallacy, going on who said a given argument rather than the actual evidence. I have encountered defenses of Mann online, and so far none of the articles cited addressed the McIntyre or McKittrick objections as to method. If one repeats Mann’s technique, apparently one gets the same sort of result. The dispute is over the technique.
Ristvan, RE: Tiljander ——- https://agwobserver.wordpress.com/2010/06/28/tiljander/
Tom Halla, Mann used the PCA technique ( https://en.wikipedia.org/wiki/Principal_component_analysis ) which has been around since about 1900. What are your objections to this analytical methodology ?
PS Tom Halla, how do you address over 30+ subsequent studies that have confirmed Mann’s original work?
Steve Heins April 1, 2017 at 3:20 pm
As I told you, that list doesn’t say what you claim. Obviously, you haven’t read those papers.
Climate Audit doesn’t need to be peer reviewed. When you’re right, you’re right. Facts matter.
In corrupt “climate science”, there is pal review, as shown by the Climategate emails, a fact already evident to all who were paying attention.
No legitimate science has ever reproduced Piltdown Mann’s HS. It’s a complete fabrication, without a shred of physical reality. No wonder the little dweeb is fighting tooth and nail to hide his UVA emails and to stay out of court with Steyn.
Steve Heins April 1, 2017 at 4:27 pm
No one and nothing has ever confirmed the HS. It’s a lie hiding not only the decline but objective reality. Mann hasn’t even admitted to turning data upside down and ignoring numerous trees to focus on one outlier on the Yamal Peninsula.
His fr@aud is laughable.
” Climate Audit doesn’t need to be peer reviewed” Well if that is true, then Climate Audit isn’t science. How do we know if what is published on Climate Audit is factual? A court case involving defamation has no bearing on the 30+ papers that have confirmed Mann’s work. How come there are no paleoclimate reconstructions in the literature that show Mann’s work to be incorrect? Your citing stolen emails shows nothing, considering that all of the investigations into said emails have proven nothing outside of the fact that the emails were stolen. Oh….and the court case with Steyn is about defamation, not with paleoclimate reconstructions.
Your defense of Mann is still irrelevant. So Mann has followers among the warmists? None of this addresses McIntyre and McKittrick’s challenge to his work.
Gloateus says: “No one and nothing has ever confirmed the HS”
.
.
.
Gloateus hasn’t responded to the 30+ papers mentioned here: https://wattsupwiththat.com/2017/03/31/a-ground-breaking-new-paper-putting-climate-models-to-the-test-yields-an-unexpected-result-steps-and-pauses-in-the-climate-signal/comment-page-1/#comment-2465969
Tom Halla: http://link.springer.com/article/10.1007%2Fs10584-006-9105-7
Steve,
You keep parroting that the HS has been confirmed, but the 30 papers which you cite don’t confirm any such thing. As I said, obviously you haven’t read them.
Peer review isn’t the basis of science. The scientific method is. CACA is not science because it doesn’t rely on the time-tested and true scientific method. It was born falsified, so is not science.
Climate Audit is science because it has never been falsified.
Clearly, you have never taken even an undergrad class in the philosophy of science.
Actually, they do confirm it Gloateus, maybe you should read them. You are correct, peer review isn’t the basis of science. But when you mention “CACA” you’ve constructed a strawman, which isn’t science, but it is a logical fallacy. You need to understand that there is no “C” in “AGW” (which also hasn’t been falsified.)
…
You ought to be embarrassed for saying “Climate Audit is science because it has never been falsified.” Why? because the blog that posits “ancient aliens” ( http://ancient-aliens-were-here.blogspot.bg/ ) hasn’t been falsified either. Don’t talk to me about the philosophy of science, when you can’t even pass a basic logic class.
That was a singularly obscure abstract. I do remember what the objections to Mann were, and the abstract dealt with none of them. Pray tell, does the paywalled article deal with red noise or grafting instrumental data onto proxies data, or the claim that Mann’s program will come up with a hockey stick overall if any of the data is a hockey stick?
PS Gloateus, In line with your logic, the statement “God exists” has never been falsified. Does that make it science?
Tom Halla, Mann’s work has been confirmed in many other papers (see https://wattsupwiththat.com/2017/03/31/a-ground-breaking-new-paper-putting-climate-models-to-the-test-yields-an-unexpected-result-steps-and-pauses-in-the-climate-signal/comment-page-1/#comment-2465969 ) Many of these papers used different methods, and different proxies, but they all supported the conclusions Mann reached.
I thought you didn’t read the actual article. Your response tends to prove that assumption.
Steve,
Clearly, you didn’t read them. I showed you one which doesn’t say what you claim. Far from it.
The LIA was caused by three or four solar minima. We haven’t had one in the Modern Warm Period.
Human activity isn’t a pimple on the posterior of climate change.
Can you really possibly be so ignorant of elementary scientific method philosophy as not to understand that to be scientific, an hypothesis must make testable, falsifiable hypotheses? The God hypothesis cannot make falsifiable predictions, so is not scientific. Neither is CACA. It not only doesn’t make falsifiable predictions, but was born already falsified.
The cult of CACA has less going for it scientifically than does the God hypothesis.
Gloateus claims: “The LIA was caused by three or four solar minima.” There is abundant evidence of an 11-year solar cycle. There is NO 11 year cycle in measured global temperatures. Furthermore, Gloateus says: :We haven’t had one in the Modern Warm Period.” but neglects to mention that currently global temperatures are not related to solar activity: http://physicsworld.com/cws/article/news/2015/aug/07/new-sunspot-analysis-shows-rising-global-temperatures-not-linked-to-solar-activity
.
If as you say the LIA was caused by a lack of solar activity, please explain why global temps rise without rising solar activity?
…
There is no “CACA” hypothesis to falsify, because it’s a strawman you’ve presented. The AGW hypothesis was made in 1896, and has not been falsified. In fact the calculations resulting from it are pretty much right on the money.
…
Now because Climate Audit is a blog, and is nothing more than someone writing his “opinion”….guess what….it’s not falsifiable, so your claim that it is science is funny.
“Human activity isn’t a pimple on the posterior of climate change.” Unfortunately UHI is more than a “pimple.” That doesn’t even factor in large areas of land use changes, such as de-forestation.
Well blow me down with a feather – does this mean that the coupled chaotic non system linear linear is actually behaving in a chaotic linear coupled non system linear manner?
I’m may still be struggling with what its non-linearly chaotically coupled to, but this looks like progress.
What a gift of wonders Climate Science is………..
Pretty damned impressive if they can turn a chaotic process into endless grant money. To Hell with Chaos Theory!
I wonder if they factored in the NOAA & NASA “adjustments” like TOD and Hansen’s cooling of 1900-1950 to make the warming look more ominous?
Can I remind everyone that Zeke let the cat out of the bag when trying to prove that you could not just plot average Temperatures as Tony Heller does in this WUWT Post, Anthony did not agree with what Heller had done, but RAW DATA speaks for itself.
https://wattsupwiththat.com/2014/06/26/on-denying-hockey-sticks-ushcn-data-and-all-that-part-2/
To see the first graph you have to click on the link in Zeke’s comment
https://wattsupwiththat.com/2014/06/26/on-denying-hockey-sticks-ushcn-data-and-all-that-part-2/
Look at the 2nd graphs by Zeke, one for USHCN only

It is obvious from both of these graphs of raw data that the Temperature rises very quickly and then falls more slowly. That data looks like our history of Temperature data shown to us before the 1980s and is nothing like the smooth progressive rise in Temperatures that is currently being achieved by the “Quality Controlled”, “Adjusted” and “Homogenised” data that is currently produced by the various Climate Authorities, which is being produced to try and make it trend along with CO2.
Aha! It goes up in steps! How is this reassuring for sceptics? The take home is still “it goes up”. Skeptical Sci. I believe actually said such a thing about ‘the steps’. In discussing Tisdale’s going up in steps, I asked the obvious: well, does it go up in steps forever or does it start to step down at some point?
Don’t get too excited that it isn’t simply linear with GHG. It would be argued by the faithful that the step process operates however the climate might be warmed. “So we have some gross quantum like process operating” . So what? This may be a way to make skeptics happy with the warming. Reading the comments it would seem to be a winning strategy. Gold medal goes to Janice Moore on this one.
Mainly because you’re more interested in winning an argument than climate science.
I have mentioned upward and downward stepping many times in the past and pointed out that such phenomena follow from the ever changing interaction between solar variability and ocean oscillations.
One would see upward stepping during periods of solar induced warming and downward stepping during periods of solar induced cooling as the changing net effect of ocean oscillations works on the solar signal.
The solar signal being caused by the sun affecting the gradient of tropopause height between equator and poles such that jet stream behaviour changes and in turn affects global cloudiness which alters the proportion of solar energy able to enter the oceans.
I discussed the importance of ocean oscillations as long ago as 2008 here:
http://www.newclimatemodel.com/the-real-link-between-solar-energy-ocean-cycles-and-global-temperature/
and here:
http://www.newclimatemodel.com/the-hot-water-bottle-effect/
This new paper simply validates my earlier diagnoses.
Um.
As far as I can see, this paper says:
1 – the temperature is going up due to greenhouse gasses.
2 – but you can’t see the signal in the atmosphere because of magic.
3 – the heat hides in the ocean and come out occasionally when we least expect it.
4 – so we should still be very afraid and continue paying taxes to the climate scientists.
“continue paying taxes to the climate scientists”
No climate scientists involved in this paper. It’s an economist and his student.
All kinds of academics and strap-hangers have hopped on the “climate science” gravy train. Many of the most famous “climate scientists” are not climatologists or even scientists, but mathematicians or computer programmers. Oreskes is an historian. Cook is a cartoonist.
Thanks Nick. Are they cheaper than climate scientists ? Are they better at math?
“Are they cheaper than climate scientists ? “
The supply always meets the demand. I don’t think they are better at math.
But how much climate money was involved in commissioning the paper? Why would they write a paper like this unless they thought it good for their careers? The more money and status climate research gets the more junk science seems to come from that direction.
Dodgy Geezer:
Your summary of the paper agrees with my own except that I would include two additional points
1a – our climate models are so complex that they should not be compared to reality but must be assessed by comparison with other and simpler models which show our models work.
3a – our findings are evidenced by use of our climate models.
Richard
And all that out of a load of FABRICATED and manically ADJUSTED non-data.
Quite bizarre , really !!
“No scientists involved in this paper. It’s an economist and his student”
Sort of like most AGW scam papers.. no REAL scientists involved.
.
The stair-stepping of temperature likely results from resonate gravitational perturbations that stimulate Earth internal heat release.
Reblogged this on the world is and commented:
A serious piece of research which allows for the possibility that “skeptics” may have gotten one thing right: increases in CO2 are more a result of warmer temperatures than the primary cause. This, of course, does not imply that the greenhouse effect does not exist; it simply suggests that its more complicated than a simple linear interpolation. The denial of this intuition is exactly what has lead mainstream science to brand rational skeptics as “deniers”… for how many decades? I hate to say I told you so…
And the greening of the earth is a result of more plant food, ie CO2, in the air, regardless of source. It’s a good thing, and more is better up to the level in commercial greenhouses, ie ~1300 ppm.
CO2: food for photosynthesizers since 3.5 billion BC!
Just add water and light!
Presto, change-o, sugar!
The first photosynthetic organisms had an immeasurably greater effect on earth’s climate, atmosphere, lithosphere, hydrosphere and biosphere than humans have done and probably ever will do.
The evolution of photosynthesis is easily one of the Top Ten most important events in the history of life on earth. Maybe Top Five. It freed autotrophs to invade previously inhospitable environments. And where the autotrophs led, we heterotrophs were sure to follow.
And yet CACA acolytes think more photosynthesis on land is a bad thing.
Watts: “This is the first paper I’ve ever read that ties together models, observations, and chaos theory of the atmosphere from Lorenz. It makes many excellent points, and it will be interesting to see if those at the top of the climate science food chain like Mann, Trenberth, and Schmidt accept these new ideas,”
I think the following ideas come from Trenberth: “The role of natural variability paints a different picture than one of steadily rising global mean temperatures. Indeed, the combination of decadal variability plus a heating trend from increasing greenhouse gases makes the GMST record more like a rising staircase than a monotonic climb.”
I dont know if the paper has a very different point of view than Trenberth. The heat that comes out of the ocean to haunt us.
“This is supported by observations on land where the overpassing air mass takes on the characteristics of the underlying surface, achieving energy balance within a 300 m distance (Morton, 1983).”
Actually not.
Its been shown in UHI studies that the Air advected from a city remains warmer despite the fact that the surface is rural. It takes more than 300meters to adjust to the underlying surface.
but heck if yall like a 300 meter figure… sounds good
The BEST you can do is think UHI is insignificant…So what difference can 300 meters make. Please be consistent in your proffered delusions.
I don’t see why climate scientists would object to this. Their statements about linear trend was just mathematical. They never claimed temperatures would go up every year.
The author’s affiliation suggests economics, as pointed out in comments. But he seems to have missed a large economics literature on change point analysis. P Perron, Boston University, has numerous papers applying his own and others’ change point methods originally developed for econometrics to climate analysis (of the hysterical tendency). Methods designed to take account of autocorrelation in particular. The thesis of the paper, about the way temperatures evolve, may be right, but the methods seem poor.
Should fit right in with the rest of climate “science” then. If it’s bad enough, Michael Mann has probably used it already anyway.