Guest Post by Werner Brozek, Edited by Just The Facts
The table below ranks the warmest ten years according to the five data sets I cover. For each of these ten years, the year is given followed by the average anomaly for that year. In all cases, 2016 set a new record. The year 1998 appears on all five data sets as one of the top ten, but 2008 does not appear on any.
| Source | UAH | RSS | Had4 | Sst3 | GISS |
|---|---|---|---|---|---|
| 1year | 2016 | 2016 | 2016 | 2016 | 2016 |
| 1ano | 0.505 | 0.573 | 0.774 | 0.614 | 0.99 |
| 2year | 1998 | 1998 | 2015 | 2015 | 2015 |
| 2ano | 0.484 | 0.550 | 0.760 | 0.592 | 0.87 |
| diff | 0.021 | 0.023 | 0.014 | 0.022 | 0.12 |
| 3year | 2010 | 2010 | 2014 | 2014 | 2014 |
| 3ano | 0.335 | 0.475 | 0.575 | 0.477 | 0.74 |
| 4year | 2015 | 2015 | 2010 | 1998 | 2010 |
| 4ano | 0.260 | 0.383 | 0.556 | 0.416 | 0.71 |
| Source | UAH | RSS | Had4 | Sst3 | GISS |
| 5year | 2002 | 2005 | 2005 | 2010 | 2005 |
| 5ano | 0.217 | 0.334 | 0.544 | 0.406 | 0.69 |
| 6year | 2005 | 2003 | 1998 | 2009 | 2007 |
| 6ano | 0.199 | 0.319 | 0.536 | 0.395 | 0.66 |
| 7year | 2003 | 2002 | 2013 | 2003 | 2013 |
| 7ano | 0.186 | 0.315 | 0.512 | 0.393 | 0.65 |
| 8year | 2014 | 2014 | 2003 | 2005 | 2009 |
| 8ano | 0.178 | 0.273 | 0.508 | 0.389 | 0.64 |
| 9year | 2007 | 2007 | 2009 | 2013 | 1998 |
| 9ano | 0.160 | 0.252 | 0.506 | 0.376 | 0.64 |
| 10year | 2013 | 2001 | 2006 | 2002 | 2012 |
| 10ano | 0.132 | 0.247 | 0.505 | 0.368 | 0.63 |
| Source | UAH | RSS | Had4 | Sst3 | GISS |
Below the second year of data, I give the difference between the record setting year and the second warmest year for that data set. For the satellite data sets, 1998 is the second warmest year. The others have 2015 as the second warmest year.
The margin of error for the average yearly anomaly is about 0.1. This means that to be statistically significant, the difference must be at least 0.1. As can be seen, only the GISS record is statistically significant meaning there is a greater than 95% that 2016 is the real record. For UAH, RSS, HadCRUT4.5 and Hadsst3, we have a statistical tie between the 2016 record and the second place year. However there is still a greater than 50% chance that 2016 is indeed a record. It is something like 57% for HadCRUT4.5 and about 60% for the other three.
The year 2016 started very warm but cooled off at the end. You may find it interesting where the December anomaly would rank if the December anomaly were to be the 2017 average anomaly. Of course, that will not be the case, but just for the fun of it, here are the rankings using the December anomaly on the later table in conjunction with the table above. UAH would be ranked 5th; RSS would be ranked 13th; HadCRUT4.5 would be ranked 3rd; Hadsst3 would be ranked 4th; and GISS would be ranked 3rd.
In the sections below, we will present you with the latest facts. The information will be presented in two sections and an appendix. The first section will show for how long there has been no statistically significant warming on several data sets. The second section will show how 2016 compares with 2015 and the warmest years and months on record so far. For three of the data sets, 2015 also happens to be the warmest year. The appendix will illustrate sections 1 and 2 in a different way. Graphs and a table will be used to illustrate the data.
Section 1
For this analysis, data was retrieved from Nick Stokes’ Trendviewer available on his website. This analysis indicates for how long there has not been statistically significant warming according to Nick’s criteria. Data go to their latest update for each set. In every case, note that the lower error bar is negative so a slope of 0 cannot be ruled out from the month indicated.
On several different data sets, there has been no statistically significant warming for between 0 and 23 years according to Nick’s criteria. Cl stands for the confidence limits at the 95% level.
The details for several sets are below.
For UAH6.0: Since November 1993: Cl from -0.009 to 1.784
This is 23 years and 2 months.
For RSS: Since July 1994: Cl from -0.005 to 1.768 This is 22 years and 6 months.
For Hadcrut4.5: The warming is statistically significant for all periods above four years.
For Hadsst3: Since March 1997: Cl from -0.003 to 2.102 This is 19 years and 9 months.
For GISS: The warming is statistically significant for all periods above three years.
Section 2
This section shows data about 2016 and other information in the form of a table. The table shows the five data sources along the top and other places so they should be visible at all times. The sources are UAH, RSS, Hadcrut4, Hadsst3, and GISS.
Down the column, are the following:
1. 15ra: This is the final ranking for 2015 on each data set.
2. 15a: Here I give the average anomaly for 2015.
3. year: This indicates the warmest year on record so far for that particular data set. Note that the satellite data sets have 1998 as the warmest year and the others have 2015 as the warmest year.
4. ano: This is the average of the monthly anomalies of the warmest year just above.
5. mon: This is the month where that particular data set showed the highest anomaly prior to 2016. The months are identified by the first three letters of the month and the last two numbers of the year.
6. ano: This is the anomaly of the month just above.
7. sig: This the first month for which warming is not statistically significant according to Nick’s criteria. The first three letters of the month are followed by the last two numbers of the year.
8. sy/m: This is the years and months for row 7.
9. Jan: This is the January 2016 anomaly for that particular data set.
10. Feb: This is the February 2016 anomaly for that particular data set, etc.
21. ave: This is the average anomaly for all twelve months.
22. rnk: This is the final 2016 rank for each particular data set. All five data sets set a record in 2016.
| Source | UAH | RSS | Had4 | Sst3 | GISS |
|---|---|---|---|---|---|
| 1.15ra | 3rd | 3rd | 1st | 1st | 1st |
| 2.15a | 0.261 | 0.381 | 0.760 | 0.592 | 0.87 |
| 3.year | 1998 | 1998 | 2015 | 2015 | 2015 |
| 4.ano | 0.484 | 0.550 | 0.760 | 0.592 | 0.87 |
| 5.mon | Apr98 | Apr98 | Dec15 | Sep15 | Dec15 |
| 6.ano | 0.743 | 0.857 | 1.024 | 0.725 | 1.11 |
| 7.sig | Nov93 | Jul94 | Mar97 | ||
| 8.sy/m | 23/2 | 22/6 | 19/9 | ||
| Source | UAH | RSS | Had4 | Sst3 | GISS |
| 9.Jan | 0.539 | 0.681 | 0.906 | 0.732 | 1.17 |
| 10.Feb | 0.831 | 0.994 | 1.070 | 0.611 | 1.35 |
| 11.Mar | 0.732 | 0.871 | 1.069 | 0.690 | 1.30 |
| 12.Apr | 0.713 | 0.784 | 0.915 | 0.654 | 1.09 |
| 13.May | 0.544 | 0.542 | 0.688 | 0.595 | 0.93 |
| 14.Jun | 0.337 | 0.485 | 0.731 | 0.622 | 0.76 |
| 15.Jul | 0.388 | 0.491 | 0.728 | 0.670 | 0.83 |
| 16.Aug | 0.434 | 0.471 | 0.770 | 0.654 | 0.98 |
| 17.Sep | 0.440 | 0.581 | 0.711 | 0.606 | 0.87 |
| 18.Oct | 0.407 | 0.355 | 0.584 | 0.601 | 0.89 |
| 19.Nov | 0.452 | 0.391 | 0.526 | 0.490 | 0.93 |
| 20.Dec | 0.243 | 0.229 | 0.592 | 0.447 | 0.81 |
| 21.ave | 0.505 | 0.573 | 0.774 | 0.614 | 0.99 |
| 22.rnk | 1st | 1st | 1st | 1st | 1st |
| Source | UAH | RSS | Had4 | Sst3 | GISS |
If you wish to verify all of the latest anomalies, go to the following:
For UAH, version 6.0beta5 was used.
http://www.nsstc.uah.edu/data/msu/v6.0/tlt/tltglhmam_6.0.txt
For RSS, see: ftp://ftp.ssmi.com/msu/monthly_time_series/rss_monthly_msu_amsu_channel_tlt_anomalies_land_and_ocean_v03_3.txt
For Hadcrut4, see: http://www.metoffice.gov.uk/hadobs/hadcrut4/data/current/time_series/HadCRUT.4.5.0.0.monthly_ns_avg.txt
For Hadsst3, see: https://crudata.uea.ac.uk/cru/data/temperature/HadSST3-gl.dat
For GISS, see:
http://data.giss.nasa.gov/gistemp/tabledata_v3/GLB.Ts+dSST.txt
To see all points since January 2016 in the form of a graph, see the WFT graph below.
 - 1979 to Present")
As you can see, all lines have been offset so they all start at the same place in January 2016. This makes it easy to compare January 2016 with the latest anomaly.
The thick double line is the WTI which shows the average of RSS, UAH, HadCRUT4.5 and GISS.
Appendix
In this part, we are summarizing data for each set separately.
UAH6.0beta5
For UAH: There is no statistically significant warming since November 1993: Cl from -0.009 to 1.784. (This is using version 6.0 according to Nick’s program.)
The UAH average anomaly for 2016 is 0.505. This sets a new record. 1998 was previously the warmest at 0.484. Prior to 2016, the highest ever monthly anomaly was in April of 1998 when it reached 0.743. The average anomaly in 2015 was 0.261 and it was ranked third but will now be in fourth place.
RSS
Presently, for RSS: There is no statistically significant warming since July 1994: Cl from -0.005 to 1.768.
The RSS average anomaly for 2016 is 0.573. This sets a new record. 1998 was previously the warmest at 0.550. Prior to 2016, the highest ever monthly anomaly was in April of 1998 when it reached 0.857. The average anomaly in 2015 was 0.381 and it was ranked third but will now be in fourth place.
Hadcrut4.5
For Hadcrut4.5: The warming is significant for all periods above four years.
The Hadcrut4.5 average anomaly for 2016 is 0.774. This sets a new record. Prior to 2016, the highest ever monthly anomaly was in December of 2015 when it reached 1.024. The average anomaly in 2015 was 0.760 and this set a new record at that time.
Hadsst3
For Hadsst3: There is no statistically significant warming since March 1997: Cl from -0.003 to 2.102.
The Hadsst3 average anomaly for 2016 is 0.614. This sets a new record. Prior to 2016, the highest ever monthly anomaly was in September of 2015 when it reached 0.725. The average anomaly in 2015 was 0.592 and this set a new record at that time.
GISS
For GISS: The warming is significant for all periods above three years.
The GISS average anomaly for 2016 is 0.99. This sets a new record. Prior to 2016, the highest ever monthly anomaly was in December of 2015 when it reached 1.11. The average anomaly in 2015 was 0.87 and it set a new record at that time.
Conclusion
The three hottest years for HadCRUT4.5, HadSST3 and GISS are 2016, 2015 and 2014 in that order. So when people talk about the last three years being the hottest, they are NOT talking about the satellite data. According to the satellite data, 2016 sets a new record with 1998 dropping to second place. However the difference is so small that we could say that 2016 and 1998 are in a statistical tie.
As I indicated in my last post, I had expected HadCRUT4.5 to be very close. As it turned out, HadCRUT4.5 is the only data set of the five that I cover that went up from November to December. The other four went down from November to December. In terms of where December would rank if its anomaly were to hold for 2017, RSS is the odd man out. How long do you think that this will be the case?
As I keep pushing … it would be nicer to chart only the months that are ENSO neutral. If you do this the trend from 1997 (a total of 20 years) is about .01 C / decade and that is mainly due to ending soon after an El Nino when even neutral months show warming due to the lag.
The pause is still clearly hanging around using this approach.
This post was not about trends but about the warmest years on record.
Was hoping you would take the hint. What are the 10 warmest ENSO neutral years?
That is a major undertaking and I am not sure it would be useful. If you check out:
http://www.cpc.ncep.noaa.gov/products/analysis_monitoring/lanina/enso_evolution-status-fcsts-web.pdf
Since 2004, there is only one year, namely 2013, that does not have any blue or red in it. Then where do you draw the line due to the lag in response? For example if just the last 5 months are not neutral, does that then count as a neutral year?
So claimith: Werner Brozek – January 26, 2017 at 7:35 am
Werner B, ….. in actuality, ……. it is in fact debatable as to whether you are talking ”trends” or talking “warmest years”.
And it is of MLO that any discussion of earthly Average Temperatures is in fact a discussion about temperature “trends”, to wit:
As a matter of scientific fact there is no such thing as a “warmest year” …….. simply because there is no way one can define what a “warmest year” is ….. or whether or not the denoted “warmest year” was more “warm” or less “warm” than the year proceeding it or the year following it.
“DUH”, if there is not a “warmth” scale for assigning a “warmth” value, degree, quantity, or whatever to a specific entity …… then there is no way to determine which one (1) of several entities is or was the “warmest”.
If one looks at most any multi-year Annual Average Temperature graph it will show an increase in the Average Temperatures for the specified time frame, …… but how does one know if said increase is due to an increase in the Average Winter Temperatures or an increase in the Average Summer Temperatures?
If the Average Winter Temperatures were steadily getting less cold (warmer) over the past 60 years …. which we know is an observational fact …… and the Average Summer Temperatures remained about the same, ……. then wouldn’t that produce an increase in Average Temperatures over said 60 year time frame?
ABSOLUTELY IT WOULD.
And if so, wouldn’t that rule out the presumed “greenhouse” effect of atmospheric CO2?
ABSOLUTELY IT WOULD.
If the atmospheric CO2 is increasing but the average Summer temperatures are not getting warmer or hotter then atmospheric CO2 is not affecting near earth temperatures.
If the Average Summer Temperatures had been increasing at the same rate as the Average Winter Temperatures, …… which they should have been if atmospheric CO2 is the culprit, …… then 100+ degree F days would now be commonplace throughout the United States during the Summer months. But they are not commonplace and still only rarely happen except in the desert Southwest where they have always been commonplace.
Now, instead of saying that “the Earth is warming” it is more technically correct to say “the earth has not been cooling off as much during its cold/cool periods or seasons”.
One example of said “short term” non-cooling occurs quite frequently and is commonly referred to as “Indian Summer”.
Given the above, anytime the earth’s average calculated temperature fails to decrease to the temperature recorded for the previous year(s), ….. it will cause an INCREASE or spike in the Average Temperature Calculation results for that period ….. which is cause for many people to falsely believe “the earth is getting hotter”.
Top 10 Central England (CET), annual, high to low were. 2014, 2006, 2011, 1999, 1990, 1949, 2002, 1997, 1995, 2003.
In my introductory part, I never mention C/year or anything like that so I am not talking “trends”. However as for the reasons as to why one average is higher than another, well that is a totally different and very valid discussion. However I am not addressing those issues here.
The units used to make your comparison of the warmest year are in degrees of anomaly per year.
You’re making an order comparison one the linear trend to another – unless you’re choosing the peak anomaly of a particular year from a nonlinear signal and calling that the warmest year – which is worse then a linear trend.
I disagree. Anomalies are simply in degrees. 2016 is 0.02 C higher than 1998 for example. It is not 0.02 C/year.
If Bill is 6 feet 2 inches and Joe is 6 feet 4 inches, Joe is 2 inches taller. Period. He is NOT 2 inches taller/person.
“This post was not about trends but about the warmest years on record.”
Its very similar to the warmest 10 year averages. 1997-dec 2006 is only 0.028K less than 2007 to the present in RSS.
Not really. I do not mention any 10 consecutive year average. I list the warmest 10 years on five data sets and the years listed range from 1998 to 2016 with many in between naturally missing such as 2008 is missing from all.
Is “The margin of error for the average yearly anomaly is about 0.1. This means that to be statistically significant, the difference must be at least 0.1. Is this referring to a statistical error or physical error.
Taking into account what NASA state in https://data.giss.nasa.gov/gistemp/faq/abs_temp.html
Can we trust these figures at all?
Hopefully Nick Stokes will weigh in on this.
That is a very good question! I believe some sources are more trust worthy than others. And this topic has been covered extensively in other posts.
The question of physical error is my question as well. The difference of .02 degrees F between 1998 and 2016 quoted in the msm cannot possibly be within the capabilities of the physical equipment with any reasonable certainty.
Did you mean degrees C for the satellites? And yes, that is why Dr. Spencer considers 1998 and 2016 to be statistically tied.
Msm published .02 degree F difference, I believe, when claiming 2016 the warmest year on record. My question is not about statistical significane but instrumental accuracy within such minuscule limits. Of course, the real answer either way is “So what?” be it F or C degrees.
I believe that 1936, during the depths of the Dust Bowl in the USA, was warmer globally than 2016.
Coincidentally, this is when fossil fuel combustion accelerated strongly:
More evidence that ECS ~= ZERO (not 1.2C, 3.0C, etc.)
The recent surface temperature (ST) datasets should not be used, since they are utterly corrupted by repeated “adjustments” that exaggerate warming.
If it is absolutely necessary to use ST’s, then one should use an early version like HatCrut3 circa year 2000.
For evidence, here is one of my favorite plots, sincere thanks to Tony Heller:
https://realclimatescience.com/all-temperature-adjustments-monotonically-increase/
https://www.facebook.com/photo.php?fbid=1209281512482742&set=a.1012901982120697.1073741826.100002027142240&type=3&theater
CO2 follows temperature in real climate.
Temperature adjustments follow CO2 in fake climate.
h/t
Tony’s work is clean and understandable. All claims of warming by persons asserting a gradually rising global average temperature must be taken with the fact those purporting it have been caught engaging in M.A.S.S.I.V.E. SUBVERSION of THE SCIENTIFIC METHOD.
“Is this referring to a statistical error or physical error.”
I commented on the various uncertainties here. Quantifying uncertainty means working out how different the answer might have been if the method of finding it was changed. For the surface measures, the main component is location. Global average surface temperature is a continuum property which is assessed by sampling (stations). There is no other way. The uncertainty estimates what would have happened if different locations had been sampled.
This rather overstates the uncertainty relevant to whether 2016 was the hottest year. The unstated proviso is that there is an x% chance that 2015 might have been, if measured at different places to 2016. But if you restrict to measuring in the same places in each year, which I think is proper, then the uncertainty is much reduced.
As far as what NASA says, that is just explaining why anomaly is needed. Anomaly is what is used here.
I am sorry to come in late into this, probably noone will notice. However, I have an objection to what Nick Stokes says here. I read the linked comment. I object to the statement that “The uncertainty estimates what would have happened if different locations had been sampled.”
That is not what the uncertainty is about. In the linked comment, Nick claims that the uncertainty in measured temperature can be reduced due to the huge number of temperatures measured around the globe on a daily basis. That is wrong.
The reason it is wrong is that the prerequisite for performing a mathematical reduction of measurement uncertainty requires that you perform mulitiple simultaneous measurements on the same substance with similar instruments at the same physical location. That is when you are measuring a substance which is changing with time. Air is definetly changing with time. In addition, “air” is not a defined substance.
The measurements perfomed in weatherstations around the world are neither synchronous in time, nor place, nor do they measure the same substance. You can not reduce the inherent measurement uncertainty in these measurements. Rather, with all the massaging of measurements that is going on in producing a global average, the inherent accuracy decreases in the final product.
“for performing a mathematical reduction of measurement uncertainty requires that you perform mulitiple simultaneous measurements on the same substance with similar instruments at the same physical location”
That is for improving the uncertainty of an individual measurement. But I am talking about improving the uncertainty of a global average, estimated through sampling. Very different, and sampling error is at least a big part of it. And a basic principle is that whenever you add numbers which have errors that go either way, you get cancellation. It’s actually an obvious point; in all kinds of fields, people spend a lot of money to get large samples to average. They want to reduce the uncertainty.
But your statement is far too restrictive, even for a single point. They don’t have to be similar instruments – you can obviously reduce uncertainty a lot by bringing in a much better (not similar) instrument. Anyway, the key thing is that I’m not trying to improve the uncertainty of the individual point. It is the sampled average.
Nick Stokes,
the uncertainty inherent in the measurement does not go away magically by using the sigma over square root of number of measurements. That formula is designed to cope with the accuracy of single measurements. Your statement that you can mix types of instruments to improve accuracy is wrong in this context.
The average does not take away the basic inherent uncertainty in measurement. You claim that this can be true because such uncertainty “goes both ways”, and that is ….well…not even wrong, to use the words of a famous scientist. If you measure the temperature at one location using one or two thermometers, the measurement error does not “go both ways”. The true state of affairs is that you have absolutely no information whatsoever to determine which way the measurement error goes. If you did, the eroor would be less. This is a fundamental part of what measurement error, accuracy and precision is about.
In climate science, one takes things a few steps further by using the actual measurements in a process called homogenization. Such a process can never reduce the initial accuracy of the measurement, and it is highly unlikely that it can keep from increasing the uncertainty. Taking it even further, one uses the homogenized data in procedures involving interpolation and extrapolation to fill in a cell grid of the planet in order to have “temperatures” in all grid cells. This further increases the uncertainty.
The uncertainty of what would happen if you measured in places you did not measure before is something else completely. You can begin to appreciate that by looking at the spatial and tempral differences in temperatures around the globe. However, that would be totally uninteresting.
The fundamental measurement accuracy does not disappear through averaging, beacuse you are averaging measurments of different substances (“air”) from different locations at different times. The procedure you describe would be applicable if your were looking at static measurments of things that do not change with time and that are basically the same substance.
This is nice work on your part. Thanks.
However, is there any climate significance in one and ten year time frames?
You are welcome!
Not really. I just want to give the latest information and rankings. If you want the rankings of all 38 years on UAH6.0beta5, you can see those here:
http://www.drroyspencer.com/2017/01/global-satellites-2016-not-statistically-warmer-than-1998/
[ snip – Slayers type stuff – not going to derail the thread by allowing it, per site policy -mod]
Hey, it’s your site.
For all the assurance and insistence that “the science is settled”, what is certainly settled is the willingness to ignore and abuse statistical principles when do so advances the cause. As with all things progressive, every issue is far more about the long term goal than about this immediate issue. The vast majority of demands made by advocates of “climate change” converge on socialistic government policies:: less freedom, less prosperity, higher taxes, bigger government. And in this age of synchronized central banking, massive spending paid for by creating an ocean of money out of thin air. I can say this with at least a five sigma probability.
Then Trump is certainly a breath of fresh air! And his people certainly do not believe it is settled. See:
https://wattsupwiththat.com/2017/01/24/epa-nominee-pruitt-attacked-because-he-believes-debate-should-be-encouraged-about-the-truth-of-climate-science/
I get very nervous looking at temperature anomalies. The enthalpy problem keeps whispering in my ear. Averaging the temperature anomalies across the planet ignores enthalpy. Enthalpy is not a linear function.
That I continue to see plots of temperature anomaly and not plots of enthalpy anomaly causes my rabbit hole sensor to fly.
I like Nick Stokes layout. The only problem is, is that it seems to be limited to anomaly charts. Plot all of the data by location and look at the location data in absolute values.
Especially take time to look at the temperatures in Eastern Russia. Then take a gander at how much empty land there is there… It is fun to find the roads… There are a few, but they are hard to find and they do not exactly cover the country. In the lower 48, the furthest you can get from a road is 20 miles (there is a point inside Yellowstone where this happens.) If you were dropped randomly inside Eastern Russia, the chance that you would land within 200 miles of a road border on 0…
There are places to escape to, if the alarmist are right.
The thing is, temperature anomaly is not a good way to go. Attempting to adjust temperature anomaly to allow for enthalpy errors would just make the monkeying of data even worse. If we start using enthalpy as the plotted reference value, we lose just about everyone from the conversation. We especially lose most of the alarmists.
Then you would get a bunch of sine waves and it would be harder to tell if any given month is above or below average. All Julys would be hot and all Januarys would be cold.
Hopefully the change in enthalpy will average out over the long run so that ordinary anomalies do the job they are supposed to. But your point is very valid. The poles have a huge positive anomaly, but since it is easy to raise cold air at -30 to -20, it does not mean nearly as much as raising humid tropical air from +30 to +40.
I wondered about the enthalpy of air, so looked it up. I thought it was in interesting. The heat capacity of moist air is not very different from dry air. The water vapor in the moist air has a heat capacity almost 1.8 times as large – that is it takes 1.8 times as much energy to rise the temperature by the same amount as air. However, even humid air actually has very little water vapor in it – about 1% at 60% RH at 20C. So you have to do twice as much work on 1% of your air, or an extra 1/2 %
However, the moist air also contains the latent heat of vaporisation of that water. Heat of vaporization of water is very large. This latent heat is much higher than the energy needed to heat the moisture in the air. Moist air (100% RH) at 25C contains three times as much enthalpy as dry air at the same temperature (using 0C as reference). No real point, but an interesting observation.
Good point!
“it does not mean nearly as much as raising humid tropical air from +30 to +40.”
” However, even humid air actually has very little water vapor in it – about 1% at 60% RH at 20C. So you have to do twice as much work on 1% of your air, or an extra 1/2 %”
20C is 68F…it never gets that cool in most tropical locations. In Florida, 68 would be a record low from June to September.
And at 68 F and 60% RH, the dew point is 54F.
The dew point in the tropics never gets that low.
That would be low even in Temperate locations of the Eastern US in Summer.
A typical dew point in Florida in Summer is in the 70s. 76 is not unusual.
Tropical air has many times more moisture than 1%.
5% water content is not unheard of for marine equatorial air.
A practical example of this is difference in enthalpy relates to the wet and dry adiabatic rates, and what happens to a parcel of air as it is carried over a mountain, rains out much of it’s moisture, and then descends back down the other side.
If such a parcel at a dew point of, say, 20C, and a starting temp at 30C (for a RH of 53%) is carried over a 4,000 meter mountain range, by the time it reaches the far side of the mountain and is once again at the altitude it began with, the parcel will have a temp of 40C and a RH of 15%.
IOW, removing moisture from the air sufficient to lower the dew point from 30C to -7C, and adding the latent heat of vaporization of that moisture to the air is enough to increase it’s temp by 10C, or 18F.
As an example, the moisture capacity of air increases 1.2 grams from 0C to 5 C (3.8 grams to 5 grams), but the moisture capacity increases by 14.8 degrees from 35C to 40C (35 grams to 49.8 grams).
What about from -30 to -25?
Even less!
Sorry sir, I did not mean to be snarky, but my sense of humor sometimes gets the best of me.
The table I was using does not go that low, but perhaps this graph will help show the relationship.
At these low values of moisture content, the curve is much flatter than at higher temps.
http://3.bp.blogspot.com/_xjcwwA-nj8k/TEsOr48ui1I/AAAAAAAAAiI/8voiJsQ1-8w/s1600/x.gif
When were you snarky? ☺
Good point! So it is easy for the temperature to go down when it is extremely low to begin with. So a higher anomaly with GISS does not necessarily mean nearly as much as a higher anomaly with Hadcrut due to different polar coverage.
Then there is the fourth power law relating to heat loss that affects things as well.
The energy needed to raise your moist air with 5% moisture (100% RH at 40C from your graph, raised to 50C – extremely hot weather!) is an extra 4.5% (I got it wrong before, but the point remains the same.) Even at extreme temperatures and humidities the extra energy needed is relatively small.
The extra latent heat content of the moist air described above is roughly 125 kJ/m3. The enthalpy needed to perform the 10C rise in temperature is about 20 kJ/m3. (heat capacity air is about 1 kJ/kg.k). Thus the moisture in the air adding to the enthalpy if the heated air about 1kJ extra through increased heat capacity and about 125kJ through latent heat.
Wait…what?
Menicholas, is your “wait, what” aimed at my comment? I am not saying anything controversial, just pointing out where the enthalpy of moist air comes from. Most of the energy (enthalpy) of moist air comes from the latent heat of vaporisation of the water vapor in the air. Very little of it comes from the extra energy needed to heat moist air compared to dry air. As I said, I am not making any great point here, just reporting something I found interesting. I wondered how much extra energy was needed to heat moist air comoared to dry air. the answer is not very much difference. However, the enthalpy of moist air is very much greater than the enthalpy of dry air, but that is almost all due to latent heat of vaporisation.
People: We are still coming out of the LIA.
Did you expect something different?
+1850 !!!!!!
And on top of that, last year had a very strong El Nino. That is something we cannot let the general population overlook.
Hans,
I don’t believe there is a single scientist on either side that can answer whether or not we are still coming out of the LIA. Your comment might better be ‘If we are still coming out of the LIA why would we be expecting something different?’
Hans – What is the cause of the warming? “Coming out of the LIA” is not an explanation for why it is warming.
Why is it not?
I go a bit further back and ask people who are skeptical of my skepticism:
“Where you are standing (Toronto, Canada), was under 2km of ice 10,000 years ago.
What is the optimum level of ice you would be comfortable with?”
The 1930s would likely still be the hottest recorded decade, without “adjustments”, “readjustments”, “corrected”, “value added”, “estimated”, “in fill”, “homogenized”, “homogenised”, or other changes to the original raw, measured data.
That is the fact that does not get mentioned on the “hottest” year evah declarations. Most max temps for nearly the entire US were from the 1930s and 40s. 1936 is the year that was truly scorching. The “adjusters” have cooled that data so much that those years are not in the top 5 “hottest” years.
The real data is probably lost forever. Without the adjustment-free data available, we are just guessing.
Tony Heller currently has a post that shows that the current land temperature data should be adjusted DOWN due to the change in average latitude of reporting stations. That would blow the warmers’ minds.
Thanks again Werner for another thorough analysis.
2016 came in hot from previously high TSI in 2015, and went out cold from lower TSI in 2016.
In Dec of 2015 I said
“2016 will NOT be a record year as there will be no long outstanding solar cycle TSI peak like Feb 2015.”
Which was extremely close to being right on the money, and considering that every dataset but GISS ended within the uncertainty range, I can say, albeit with less than 50% confidence, that I was right about 2016. Of course, being right and being accepted as right are however two different animals.
From 2016 to 2015, SORCE TSI dropped by 0.4248 w/m^2, the third largest annual TSI drop since 1980 (when compared to ACRIM3 annual TSI changes).
But the 2016 TSI drop flattened out during the summer, allowing temps to barely float up, just long enough….
If HadSST3 came in at only 0.022 less per month in 2016, 2016 would have tied 2015, that’s how close it was, within the margin of uncertainty.
I learned how to make such predictions by observing and analyzing the solar and climate history.
Climate science will remain a whirlwind of ignorance until it is deeply understood how and why
The Sun causes warming, cooling, and extreme events, not CO2!
Even a weak sun is no match for a strong El Nino. So 2017 should be interesting. I agree about CO2.
The weak sun in 2016 completely wiped out the strong El Nino, which itself was caused by high TSI in 2014-2015.
If that were the case, I would think that 2016 would be no warmer than 2013.
Weak sun becomes an issue when you travel up or down the latitudes. On the equator not so much
2016 TSI was less than 2015 TSI, but was higher than 2013. However, 2013 was an important step higher in TSI during the seven straight years of annual increases until last year.
The ocean releases the high TSI heat energy that warms the ocean depths after the high TSI event period is over.
The temps in this cycle peaked one year after the TSI max in 2015, while TSI was still high enough.
Remember *** 2016 TSI came in high and went out low. *** Temps responded in 2016 to 2016 TSI.
There was a lag of about one year from high TSI to high temps for this cycle from the delayed OHC release, until TSI was too low for accumulation of ocean heat, and the ocean started cooling.
SORCE TSI:
2003 1361.0292
2004 1360.9192
2005 1360.7518
2006 1360.6735
2007 1360.5710
2008 1360.5382
2009 1360.5565
2010 1360.8027
2011 1361.0752
2012 1361.2413
2013 1361.3587
2014 1361.3966
2015 1361.4321
2016 1361.0073
2017 1360.7971
We are currently below 2010 TSI levels, so we are having a comparable winter to 09/10, except the ocean is still a little warmer now than it was in 09/10.
Analysis based on F10.7cm long-term warming and cooling threshold of 120sfu, and TSI of 1361.25W/m^2.
Here are the ENSO numbers for the first 11 months of 2016: 2.2, 2.0, 1.6, 1.1, 0.6, 0.1, -0.3, -0.6, -0.8, -0.8, and -0.8.
correction to this comment
“2016 TSI was less than 2015 TSI and 2013, but started out higher than 2013″
““2016 will NOT be a record year as there will be no long outstanding solar cycle TSI peak like Feb 2015.”
Which was extremely close to being right on the money, “
That is an odd assessment. Your prediction: 2016 will not be a record year.
Data in this post: 2016 is a record year in EVERY data set.
Your assessment: pretty close. No, actually it was dead wrong.
If this and that had happened you might have been right, but they didn’t and you weren’t.
My prediction was wrong as I mentioned last time.
I would not go that far. For four data sets there was a statistical tie. So in these cases, there is still a 40% chance that I was right. Can we agree I was 60% wrong? ☺
seaice1, I’m sure that was meant for me, but I’ll quote Werner
“So in these cases, there is still a 40% chance that I was right. Can we agree I was 60% wrong?”
That’s what I mean. There was a 40% chance I was right.
“If this and that had happened you might have been right, but they didn’t and you weren’t.”
We don’t know with 100% certainty whether 2016 or 2015 was “the” record warm year because the margin of uncertainty for all the datasets except GISS was greater than the supposed margin of the records. [and then there’s the 1930’s…]
We do know that activist Gavin Schmidt has distorted the temperature record at GISS. We do know that he and the MET office were telling us all year during 2016 that 2016 was going to be a record year.
How do we know they didn’t have their thumb on the scale considering their prestige and egos and the warmists’ pride were all on the line last year politically and scientifically? I don’t know but I don’t trust em.
2016 stats came in within the margin of uncertainty, and we don’t know one way or the other, and my example illustrates how close it was month to month. It was barely a record if it was at all by years end.
IF the 2016 datasets had been just below 2015 within the margin of uncertainty and I had claimed I was right because of it, someone here would say rightfully “it’s within the margin of error”. Be fair.
Before the HadSST3 data came in last week I had determined an error formula based on whatever the result was compared to what it had to be to not beat the record, so when the data came out, I ran the numbers and my prediction was off by a mere 2.6% (higher than 95% confidence)!
So, “No, actually it was dead wrong.”, what are you talking about?
By the way this isn’t an all or nothing thing – this was a major learning event in spite of records or not.
Werner, yes indeed it was at Bob Weber. OK, I was maybe a bit strong – it was wrong, not dead wrong. The juxtaposition of the claim that your prediction of not a record year was very nearly right when it was a record year was quite stark. Predictions of NOT being a record are nearly always correct, just taken randomly, since most years are not records. It is an enormous stretch to classify this as nearly right.
Is it a coincidence that from November to December, GISS went DOWN by 0.12 but HadCRUT4.5 went UP by 0.066? That is a net difference of 0.186 in one month. Had HadCRUT4.5 also gone down by 0.12, it would not have set a record.
Was there a thumb on the scale? Who knows? But it does look suspicious.
seaice1
I get you. I wanted to be 100% right but wasn’t. The fact is however that the temp drop made it 97.4% of the way to meeting my prediction about both temps and the sun’s activity.
This was a very important result. My solar sensitivity factor was off slightly, now I can correct it.
Science! Some of us are doing it, not just talking about it.
“Is it a coincidence that from November to December, GISS went DOWN by 0.12 but HadCRUT4.5 went UP by 0.066?”
No. It’s a result of the different treatment of the Arctic. GISS interpolates Arctic temperatures; HADCRUT does not, and so is much less responsive to them. In November, the Arctic was very warm (Siberia cold), and GISS rose by 0.04, while HADCRUT fell by 0.06. In December, both Arctic and Siberia were more normal. GISS lost the Arctic bump, but HADCRUT hadn’t noticed, but responded to Siberia improving.
I run two versions of TempLS; one interpolates (as does GISS), and one just averages grid cells, often empty in Arctic. They responded similarly.
I was aware of that from years ago. However as I pointed out in several articles over the past few years, whenever HadCRUT makes adjustments, they invariably go up with the most recent 16 years. I believe one of the reasons was that more Arctic temperatures were found. So it would appear that this Arctic gap should be closing by now.
As well, exactly how large is the “Arctic” assumed to be? Is its area relative to the whole globe even large enough to make a net difference of 0.186 in a single month?
“As well, exactly how large is the “Arctic” assumed to be? Is its area relative to the whole globe even large enough to make a net difference of 0.186 in a single month?”
I do a breakdown of that for TempLS mesh, here. This is the GISS-like version. It shows the contribution that each region made, in °C, to the month’s average anomaly. Arctic is a fairly small one; in fact, it seems I was missing the main one, which is Antarctic. That made about a 0.1°C difference, where HADCRUT would also have fallen short. The other thing that happened was that N America went from very warm to normal, and Asia became very warm. That was probably a wash in both indices.
Werner,
The two polar zones total 8.24% of earth’s area. The tropics cover 39.78% and the two temperate zones 51.98%.
Thank you for that! Which brings up a different question. Should we be talking more about polar warming than global warming?
Thank you! That would be about 1/12 of the total area. So if the difference between GISS and HadCRUT4.5 between November and December was 0.186 C, and if the difference was entirely due to the poles, then the poles would have been about 2.2 C above average in one of the months. I suppose that is reasonable.
” I don’t know but I don’t trust em.”
Smart man. Trusting people who have proven themselves to be spectacularly untrustworthy would be reckless and foolhardy.
On several different data sets, there has been no statistically significant warming for between 0 and 23 years according to Nick’s criteria. Cl stands for the confidence limits at the 95% level.
The details for several sets are below.
For UAH6.0: Since November 1993: Cl from -0.009 to 1.784
This is 23 years and 2 months.
For RSS: Since July 1994: Cl from -0.005 to 1.768 This is 22 years and 6 months.
For Hadcrut4.5: The warming is statistically significant for all periods above four years.
For Hadsst3: Since March 1997: Cl from -0.003 to 2.102 This is 19 years and 9 months.
For GISS: The warming is statistically significant for all periods above three years.
In order to claim that there is significant warming you must use a one-tail test which means a ~1.7 standard deviation range to achieve significance, therefore all the metrics show significant warming at the 95% level.
Didn’t Nick Stokes address this last time? By the way, Skeptical Science gives numbers that are very close to Nick Stokes’ numbers.
“Didn’t Nick Stokes address this last time? “
Yes. But I agreed with Phil. SkS and I give CI’s, which is the limits that there is a 95% chance you’ll be between. But that means a 2.5% chance you’ll be over, and 2.5% chance under. In the 5% chance you quote that 2016 was not within ± 0.1C of what is quoted, 2.5% is the chance that it was actually higher. Only 2.5% that it was lower. That is why Phil. says that you should revert to a t level corresponding to 90%, which would be about 0.08°C.
But it is really way more complicated, to do it properly. You’d need a joint distribution to measure the likelihood of 2015 being higher than thought, and 2016 being lower. People don’t bother, because it is just a silly issue. It is dominated by what is actually meant by uncertainty. As I said above, it is mainly location. That is an uncertainty in absolute terms, but not one that should be applied to 2016 vs 2015. It’s saying that 2016 could have been cooler than 2015 if measured in different places. But it is likely that 2015 would have been cooler there too.
Would Phil Jones use either your numbers or those of SkS to determine if warming over 15 years was statistically significant or not? That is what I was hoping your numbers would give. If that is not the case now, could you program your site to give those numbers that Phil Jones would use and I will be happy to use those new numbers when they are available.
Werner,
That’s a slightly different issue – trends vs hottest year. My usage there is the same as SkS and is conventional – 95% chance of being within CI. I think from memory that this is what PJ was using too. When you say that a trend is significant, there is a subtle difference between that and saying that it is significantly positive. based on chance, there could e a 5% chance that 0 lies within the CIs, but a 2.5% chance that is lies below. Most people in that context don’t observe the distinction. They probably should.
But that is comparing with a fixed number, 0. When comparing with another trend similar to here comparing 2016 with 2015), you really need to do the joint probability analysis. What if 2015 were 0.05 hotter and also 2016 were 0.05 cooler, etc)? And then decide if you really care.
That is good enough for me. Thanks!
I hope with the alarmist “scientists” and I use that term loosely, march on Washington, that there will be some representation of “real: scientists with backgrounds in actual physical science bringing up the statistical problems found in climate data analysis.
A while ago, I THINK, Anthony did a piece of work analysing the surface temperature measuring devices in America to show which were well sited, which suffered from urban heat problems and the work that had been done by others to account for this. If I have remembered correctly, It would be interesting to monitor the well-sited devices as another data set alongside the ones above.
The implication is that this has never occurred before. There are many well documented periods in the record of prolonged periods warmer than today. I realize this article is not focussing on that or the larger implications but it will be picked up and cited by those pushing the AGW agenda. The issues, details and discussions encapsulated here are the modern equivalent of the medieval debate over how many angels on the head of a pin.
To put it in perspective the answer to the question about Anthony Watts Surface station assessment
http://www.surfacestations.org/
reveals that in the US, supposedly with the best quality and sited instruments, the ratings allowed that only 7.9% achieved accuracy rates of <1°C. The coverage of the US is supposedly the best in the world but there at least 85 percent of the total earth's surface has no weather stations at all.
It is encapsulated in the article by Essex, Andresen and McLitrick
"Does a Global Temperature exist?"
http://www.uoguelph.ca/~rmckitri/research/globaltemp/globaltemp.html
That is why I very intentionally included the words “on Record” in my title. Unfortunately, we do not have accurate global records going too far back in time.
Therefore, you cannot say anything meaningful about anything related to global or even regional temperatures, on or off the record.
Good. We should all welcome a milder world. Too long have vast expanses of land been reduced to tundra and boreal wastelands.
Would you expect the years to be colder after the mostly-NATURAL warming since the end of the Little Ice Age ?
We would expect years to get warmer until the natural warming ends. This has little to do with the IPCC AGW theory, because the warming rate is consistent with the NATURAL warming of the last 150 years.
This should be obvious, but apparently isn’t to some people.
Everything I have ever learned regarding history and climate has told me that warmer times in Earth’s history have been beneficial for humans, more prosperous, less disease outbreaks, less wars,and basically just better for people.
Cold periods, on the other hand, have been exactly the opposite…not good for people, less prosperous, more wars, more diseases, more famines, just plain not so good.
We know that at the current time, overall the Earths populace is the most prosperous that it has ever been, by nearly every measure one might imagine.
So I guess it all makes sense and adds up.
we should all consider ourselves very fortunate to be living in such a warm and prosperous period of the Earth’s history.
Let’s hope it continues for a good long time.
RE: Warmest Ten Years …
Utterly worthless pronouncement; WHERE is the relationship to anything actual and physical?
A “book keeping” exercise with NO bearing on reality particularly WRT to surface temperature measurements.
I tried to show how statistically insignificant the 2016 records really are. This is to counter warmist’s arguments that a new 2016 record is somehow catastrophic that we must spend billions to reverse.
When I first saw the NOAA/NASA claim that 2014 was the warmest ever recorded, based on unreliable, tampered surface data, I looked up the UAH and RSS satellite data and weather balloon data. I found more than a dozen years warmer than 2014 since 1979. Same thing in 2015—a big discrepancy between the satellite and balloon data and the NOAA/NASA/HADCRUT surface temperatures. Satellite and balloon data confirm that no global warming has occurred in the past ~20 years—how then can the past decade be the warmest ever? Take a look at https://realclimatescience.com/global-temperature-record-is-a-smoking-gun-of-collusion-and-fraud/ and the explanation is clear—NOAA/NASA/HADCRUT have tampered with the surface data to lower temps in the 1930s and raised temps in the past few decades, totally ignoring satellite and weather balloon data and making up temps over vast areas in the Arctic and Africa.
Satellite data only goes back to 1979 so how can we evaluate recent temps relative to the 1930s? If we use 1998 as a reference point, relative to El Nino years in the past couple of decades, temperature highs are about the same with differences less than the error of measurement. So how does 1998 compare with 1934 and 1936, long recognized as the hottest years in the US and various other places in the world? Getting unaltered data for the pre-satellite era isn’t easy. But look at what NOAA/NASA have done to parts of the record. They significantly lowered temps in the 1930s, threw out about 80% of stations, made up data for almost half of their temperature records (called ‘infilling’), and erased the embarrassing 1950-1977 global cooling that had the scientific world fearful of a new Ice Age.
So should we ‘believe’ NASA/NOAA’s claim of accelerating global warming? I think the US astronauts said it best—“in god we trust—all others bring (untampered) data!
“all others bring (untampered) data”
Here is the GISS plot (from their history page) of all versions going back to Hansen’s paper in 1981. Even though the early ones (1981/7) were land stations only, there isn’t a lot of change. Nothing that is going to bring the 1930s close to present.
Reality would do so. Since the made up ocean “data” were thrown in, and the polar “data” also totally pretend, the whole GISS enterprise has been a RICCO worthy criminal enterprise.
This graph is sharply at odds with the 2001 and 2016 data and loses all credibility by erasing the well documented 1950-1980 strong cooling. NASA has altered their own data by 0.5C since 2001, yet claims that everyone agrees within about 0.05C.
Don E,
“NASA has altered their own data by 0.5C since 2001”
I don’t believe that, and it certainly doesn’t agree with the GISS graph I posted above. As for the cooling, that seems to be a matter of your opinion vs GISS calculations.
And Gloateus, for heavens sake – what is the relevance of a crap Goddard miscalculation of some unspecified version of the obsolete USHCN here?
“I don’t believe that, and it certainly doesn’t agree with the GISS graph I posted above. As for the cooling, that seems to be a matter of your opinion vs GISS calculations.”
It really doesn’t matter what you ‘believe’–the facts speak far louder than your belief. It’s not ‘my opinion’ — check the GISS’s own numbers for 2001 and 2016 and you will see a big change.
I’m surprised you aren’t aware of the Academy of Sciences report published in the 1970s clearly showing strong cooling. The cooling even made the cover of Time Magazine. The data collected in the ’70s show unequivocal, strong cooling, which has now been erased by NASA. This amounts to fraudulent tampering of well established data.
I suppose if I were you, I would say that too, Nick.
And someone (me, for example) might ask why anyone should believe the unattributed one you posted has any relevance?
There are historical accounts of a worldwide melting of glaciers in the 1920ish time period, and such accounts of a rapid advance of glaciers in the period circa 1970-1980.
Do you have an explanation for why glaciers were melting during one of the supposed coldest years ever, but advancing during the supposed warmer period noted?
And the relevance of Tony Heller’s graph is that it is in agreement with everything that was published before climate lying became a gravy train of filthy rotten money.
Nick, I’m just not seeing any of the model acceleration in the warming ???
After all it is all about the man made CO2 modeled acceleration !
“It’s not ‘my opinion’ — check the GISS’s own numbers for 2001 and 2016 “
It’s your opinion until you tell us what the numbers are. I have shown above the GISS graphs made in those two years – there is really little difference. As for the Acad Sci graph, it was based on a small number of NH land stations. Modern graphs are land/ocean, and ocean is more than 60% of the NH. So the difference is not surprising.
I seem to recall in years past that many a warmista tried to argue that the satellite data was irrelevant, because “No one lives in the troposphere.”
How many people live out on the ocean?
Unfortunately!!!
When I first saw the NOAA/NASA claim that 2014 was the warmest ever recorded, based on unreliable, tampered surface data, I looked up the UAH and RSS satellite data and weather balloon data. I found more than a dozen years warmer than 2014 since 1979. Same thing in 2015—a big discrepancy between the satellite and balloon data and the NOAA/NASA/HADCRUT surface temperatures. Satellite and balloon data confirm that no global warming has occurred in the past ~20 years—how then can the past decade be the warmest ever? Take a look at https://realclimatescience.com/global-temperature-record-is-a-smoking-gun-of-collusion-and-fraud/ and the explanation is clear—NOAA/NASA/HADCRUT have tampered with the surface data to lower temps in the 1930s and raised temps in the past few decades, totally ignoring satellite and weather balloon data and making up temps over vast areas in the Arctic and Africa.
Satellite data only goes back to 1979 so how can we evaluate recent temps relative to the 1930s? If we use 1998 as a reference point, relative to El Nino years in the past couple of decades, temperature highs are about the same with differences less than the error of measurement. So how does 1998 compare with 1934 and 1936, long recognized as the hottest years in the US and various other places in the world? Getting unaltered data for the pre-satellite era isn’t easy. But look what NOAA/NASA have done to parts of the record. They significantly lowered temps in the 1930s, threw out about 80% of stations, made up data for almost half of their temperature records (called ‘infilling’), and erased the embarrassing 1950-1977 global cooling that had the scientific world fearful of a new Ice Age.
So should we ‘believe’ NASA/NOAA’s claim of accelerating global warming? I think the US astronauts said it best—“in god we trust—all others bring (untampered) data!
Agree with Don – see my post above on this thread:
[excerpt]
https://wattsupwiththat.com/2017/01/26/warmest-ten-years-on-record-now-includes-all-december-data/comment-page-1/#comment-2408394
For REAL: There is no statistically significant warming since 1936.
I believe that 1936, during the depths of the Dust Bowl in the USA, was warmer globally than 2016.
Coincidentally, this is when fossil fuel combustion accelerated strongly:
More evidence that ECS ~= ZERO (not 1.2C, 3.0C, etc.)
The recent surface temperature (ST) datasets should not be used, since they are utterly corrupted by repeated “adjustments” that exaggerate warming.
I posted this in May 2008: “NO NET GLOBAL WARMING SINCE 1940”.
Global LT temperature anomalies will probably decline to these mid-2008 lows again by Feb2017, and then recover slightly.
The global temperature plot below does not look like a linear increase in temperature – it actually resembles a sine curve, which is peaking and about to decline.
We wrote in 2002 that Earth will enter another natural cooling cycle that would commence by 2020-2030. I am now leaning towards a slightly earlier start time for cooling, by approximately 2017-2020. I really hope to be wrong – humankind suffers during cold periods.
http://www.iberica2000.org/Es/Articulo.asp?Id=3774
[excerpt]
The best data shows no significant warming since ~1940. The lack of significant warming is evident in UAH Lower Troposphere temperature data from ~1980 to end April 2008, and Hadcrut3 Surface Temperature data from ~1940 to ~1980.
https://www.facebook.com/photo.php?fbid=1214000555344171&set=a.1012901982120697.1073741826.100002027142240&type=3&theater
Wrong, wrong, wrong…
“I found more than a dozen years warmer than 2014 since 1979”
By the end of 2014, 2014 was the third warmest in UAH TLT 5.6, and the sixth warmest in RSS TLT 3.3. Dozen years???
“Satellite and balloon data confirm that no global warming has occurred in the past ~20 years”
Actually, ballon datasets have the highest trend of all since 1997. The four dataset average in the following chart has the trend 0.28 C/decade in 1997-2016 (Ratpac A alone is 0.27 C/ decade)
http://postmyimage.com/img2/537_image.png
“NOAA/NASA/HADCRUT have tampered with the surface data to lower temps”
You are right that the NOAA subdivision GHCN adjust data for inhomogeneities, but NASA only add the UHI-adjustment, that actually take down met station trends to the rural background. HADCRUT don’t adjust data, they only use data as they come, delivered by national met services all over the world.
Recently, there was a post over at Climate Etc, suggesting that the GHCN adjusting algorithm had missed to adjust the obvious UHI in Fort Collins, Colorado.
The GISS adjustment did not miss it, the trend was taken down to that of the rural background:
https://data.giss.nasa.gov/cgi-bin/gistemp/stdata_show.cgi?id=425000530050&ds=5&dt=1
Do you dislike the “tampering” by GISS, ie reducing the overall trend in Ft Collins by more than half..?
Do you dislike that GHCN adjustments increase the trend from 1895 til 1938, but not from 1938 til now? Is the warming in the early 1900ths real or merely an adjustment artefact?
I always worry a bit about “Global [average} temperatures”. Great effort is now being expended on attempting to measure or perhaps guestimate these elusive parameters, presumably because people presume that they are the most relevant with respect to the Earth’s climate (meaning temperature by default).
My worry is based substantially on the relevance of “global means” to our existence and continued existence on the Earth. OK, we know that around 70% of the Earth’s surface is seawater, and considerable areas are Arctic or Antarctic, with yet more areas of desert and taiga, none of which are of great immediate use to mankind.
Our interest and our prosperity are governed not by what occurs in these areas but what is experienced by those parts of the Earth’s surface that are inhabited by substantial numbers of humans. That is, those region that are already producing the vast bulk of our daily living requirements. These are the areas on which we should perhaps be concentrating our interest in estimating changes or attempting to guess what the future holds.
Of course the climate of the “useful” regions will be connected in some degree with those of the less useful areas – for which it happens that for obvious practical reasons data tend to be sparse.
Our “climate scientists” busy themselves with estimating temperatures in these regions using kriging or maybe other automated guessing techniques, and apply their supposed numerical skills to extrapolate such numbers (data they are NOT) to cover the major proportion of the Earth’s surface, finally averaging them with the real data obtained by skilled observations, which have often been obtained by highly reliable real scientists.
“Global Averages” are to me mystical values, generated by synthetic and poorly argued methodology. It is nonsense to apply them in attempts to forecast future values of the climate parameters of real value, which are the “local” conditions under which life of all types exists. These are what determine crop yields, wildlife populations and general prosperity, so far as I can see, not mid-ocean or 700 depth temperatures, nor the current conditions at the Poles.
Granted, these remote parameters may be connected (by “tele” interactions, whatever they are) with what actually matters to our rice or tomatoes, but by what mechanisms and with what time lags?
Who knows?
I rank real-time proxies as very important. Here is the monthly report from NIWA (New Zealand) for December 2016:
“Air temperatures – are about equally likely to be near average (40% chance) or above average (35-45% chance) for the north and east of the North Island and for the east of the South Island. Near average temperatures are most likely (40% chance) for the remainder of the country.”
Really? Now for some proxies:
By New Year NZ dairy production was 7% down on the last 5-yr average. It is catching up now due to the cool summer that resulted in expended grass growth, whereas in most years it drops off rapidly during the drying summer.
From my own observations: maize growth is 4 weeks behind the norm
Honey: Do bees lie?
“Comvita chief executive Scott Coulter said it was likely there would be a 60 per cent shortfall in harvest expectations for the 2017 honey season because of the unfavourable weather conditions”.
“The majority of the country has seen cold, wet and windy conditions over the optimal nectar flow period. There is still some time in certain areas of the country, subject to a sustained period of fine weather, to see some form of recovery. However it appears the whole industry is experiencing one of the most difficult honey production seasons for many years.”
“Comvita chief executive Scott Coulter said the company’s had revised its 2017 expected net profit after tax from $17.1 million to $5m to $7m”
“A board member and past president of Apiculture NZ, Barry Foster, agreed some southern honey producers may benefit from late clover bloom, and confirmed North Island production had been badly affected, especially for manuka honey”.
NIWA are telling us the temperatures based on 7 stations throughout the country during the spring and summer are average or above average. I will trust the proxies thank you very much.
Two different snow storms in mid-Summer would tend to confirm the proxies, I would think.
Sea temperatures around New Zealand have been far cooler than usual for much of the summer. Here is the current position; note how New Zealand is surrounded by cold water. A tough year for sure, so the crops are responding as one might reasonably expect.:
http://weather.unisys.com/surface/sst_anom.gif
Mr. Layman here.
I remember seeing, using TheWayBackMachine that GISS, numbers have been changed since the oldest one listed could find, going back to the very first January in the record. (Hansen was in charge of them then. Gavin is now.)
Of course, the older list won’t include the most recent numbers.
But how do the numbers from older list measure up for “hottest years”?
A suspicion. Are the most recent numbers, siting issues aside, being changed now …er… adjusted in “real-time”?
(I’ll play CAGW adherent here.) If you can’t prove my suspicion is wrong then I must be right!
If you say anything to cast doubt on my suspicion then you must be in the pay of Big Dutch Windmills!
(Or maybe the Sunshine State)
“Are the most recent numbers, siting issues aside, being changed now …er… adjusted in “real-time”?”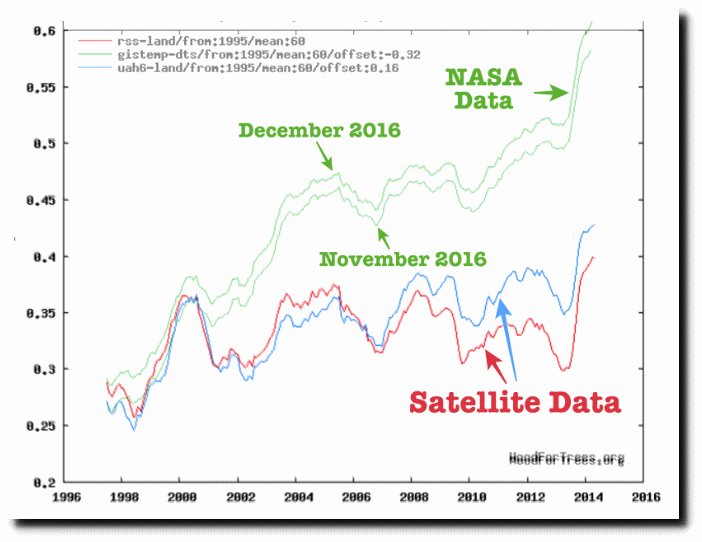
Why, yes…yes they are.
See here:
Menincholas, 😎
PS to the first (and more serious) part of my comment.
I don’t remember just when I linked to these but it is obvious that “going back to the very first January in the record” the numbers have been …well… not what they used to be.
(Where I got it.)
http://data.giss.nasa.gov/gistemp/
(What it said at the time I checked.)
http://data.giss.nasa.gov/gistemp/tabledata_v3/GLB.Ts+dSST.txt
(What it used to say a few years before.)
http://web.archive.org/web/20120104220939/http://data.giss.nasa.gov/gistemp/tabledata_v3/GLB.Ts+dSST.txt
I don’t see the point of this essay. It little matters which years are the “warmest”.
You may have seen many headlines declaring that 2016 is the warmest year on record. Would you not want to verify whether or not this is true and whether the Earth is about to be destroyed by the new record or whether the record is totally insignificant relative to the next hottest year?
The “record” is insignificant compared to the Medieval, Roman, Minoan warming periods, the Holocene Optimum, and the entire Eemian. I don’t denigrate your effort. Certainly a lot of work, and a great attention to detail.
But, truth be told, we are at the tail end of the Holocene. The next glaciation seems to be interminably on its way. The Great Man Made Glow Bull Warming Hollow Cost money-grab is over. Let it die in peace.