Guest Post By Walter Dnes
In continuation of my Temperature Anomaly projections, the following are my November projections, as well as last month’s projections for October, to see how well they fared.
| Data Set | Projected | Actual | Delta |
|---|---|---|---|
| HadCRUT4 2016/10 | +0.729 | ||
| HadCRUT4 2016/11 | +0.786 (incomplete data) | ||
| GISS 2016/10 | +0.87 | +0.89 | +0.02 |
| GISS 2016/11 | +0.95 | ||
| UAHv6 2016/10 | +0.362 | +0.408 | +0.046 |
| UAHv6 2016/11 | +0.421 | ||
| RSS 2016/10 | +0.376 | +0.350 | -0.026 |
| RSS 2016/11 | +0.431 | ||
| NCEI 2016/10 | +0.8799 | +0.7301 | -0.1498 |
| NCEI 2016/11 | +0.9138 |
The Data Sources
The latest data can be obtained from the following sources
- HadCRUT4 http://www.metoffice.gov.uk/hadobs/hadcrut4/data/current/time_series/HadCRUT.4.5.0.0.monthly_ns_avg.txt
- GISS http://data.giss.nasa.gov/gistemp/tabledata_v3/GLB.Ts+dSST.txt
- UAH http://vortex.nsstc.uah.edu/data/msu/v6.0beta/tlt/tltglhmam_6.0beta5.txt
- RSS ftp://ftp.ssmi.com/msu/monthly_time_series/rss_monthly_msu_amsu_channel_tlt_anomalies_land_and_ocean_v03_3.txt
- NCEI https://www.ncdc.noaa.gov/cag/time-series/global/globe/land_ocean/p12/12/1880-2016.csv
Miscellaneous Notes
At the time of posting 4 of the 5 monthly data sets were available through October 2016. HadCRUT4 was only available through September. The NCEP/NCAR re-analysis data runs 2 days behind real-time. Therefore, real daily data through November 28th is used, and the 29th and 30th are assumed to have the same anomaly as the 28th.
October was the first month in a long time that saw all 5 anomaly data sets fall below their levels of 12 months ago. UAH was marginal with a drop of just 0.003°.
The global NCEP/NCAR monthly anomaly for November has risen to approximately September 2016’s level. The subsets corresponding to RSS and UAH satellite coverage show smaller rises for November than the global anomaly.
The graph immediately below is a plot of recent NCEP/NCAR daily anomalies, versus 1994-2013 base, similar to Nick Stokes’ web page. The second graph is a monthly version, going back to 1997. The trendlines are as follows…
- Black – The longest line with a negative slope in the daily graph goes back to mid July, 2015, as noted in the graph legend. On the monthly graph, it’s August 2015. This is near the start of the El Nino, and nothing to write home about. Reaching back to 2005 or earlier would be a good start.
- Green – This is the trendline from a local minimum in the slope around late 2004, early 2005. To even BEGIN to work on a “pause back to 2005”, the anomaly has to drop below the green line.
- Pink – This is the trendline from a local minimum in the slope from mid-2001. Again, the anomaly needs to drop below this line to start working back to a pause to that date.
- Red – The trendline back to a local minimum in the slope from late 1997. Again, the anomaly needs to drop below this line to start working back to a pause to that date.
NCEP/NCAR Daily Anomalies:

NCEP/NCAR Monthly Anomalies:

Looking at NCEP/NCAR Monthly Anomalies, we see an increase of 0.4 deg. over about twenty years. That’s 0.2 deg./decade. Eyeballing UAH we get about the same increase over nearly 40 years. That’s 0.1 deg./decade.
We also see that NCEP/NCAR Monthly Anomalies considerably understates the 1998 El Nino as compared with UAH.
I look forward to a proper explanation of the discrepancies sometime during The Donald’s presidency.
“I look forward to a proper explanation of the discrepancies sometime during The Donald’s presidency.”
It will be the same then as now. They are measuring different places.
That’s the problem, two different Earths.
If trends were consistent old Stokes would be crying from the roof tops that this was overwhelming scientific proof of his Beliefs. But when the data is inconsistent (and in fact, opposite theoretical expectations), well, just dismiss it with an asinine hand wave. What else can he do?
People may argue their effectiveness, but HadCRUT/GISS/NCEI try to cover 100% of the globe. RSS only covers 82.5°N to 70°S. Today’s anomaly for the Arctic nort of 80° is approximately 10 Celsius (also Kelvin) degrees. http://ocean.dmi.dk/arctic/meant80n.uk.php UAH has a similar “hole at the pole” in its coverage. If you subtract the “hotspot” from your coverage, yes, you will run lower.
“Nick, and one place is warming twice as fast as the other?”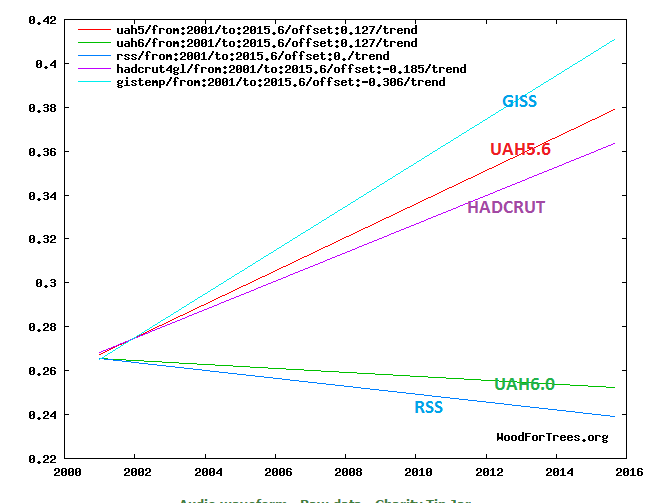
Quite possibly. A few km higher altitude,, the stratosphere is cooling, just as expected.
But it is also possible that measurement contributes to the discrepancy. Here is a plot of gradients since 2001. Yes, UAH6 tells a different story from GISS. But just last year (and still), UAH5.6 thinks GISS is about right.
UAH changes its mind all the time. Is GISS correct, is it not ?
Well, in fact, it can not tell us to wich extent GISS is correct or not, because it doesn’t estimates the same thing.
In fact, nobody knows what UAH really measures, because there is the need of empirical laws with adjustable coefficient to get a temperature, that is even not a surface temperature, from satelittes observations. UAH and RSS use a model.
And only GISS try to cover 100 % of the globe.
“And only GISS try to cover 100 % of the globe.”
ROFLMAO..
You HAVE to be joking
They have real data from stations of unknown quality covering barely 50% of the land area. DOH !!
Why would NCEP/NCAR measure the 97 EN so much lower than 16 relative to UAH. They are measuring different places between them, but the same places each time individually. Something is amiss.
“Something is amiss.”
No, that doesn’t follow. All it means is that on two different occasions, two different places responded differently.
But there is another aspect. Like Walter, I integrate the monthly NCEP/NCAR. But I don’t generally show long time series, or talk of records. The reason is that unlike surface measures, and satellite to the extent they can, reanalysis is not homogenised. It would be hard to do; it assimilates a mix of readings from all kinds of sources, and while they don’t change much in the short term, over time you can’t really be sure that it is the same series.
An example of the difficulty is the recent SST adjustments, to which Bob T took such exception. There has been a gradual shift from ship-based to buoy readings. People match the instruments as best they can, but there is still the possibility of a small systematic discrepancy. So people over the years matched readings in situ where they were consistent, did find a small discrepancy, and corrected for it. With reanalysis, you’d have to do that sort of thing on a much larger scale, and since reanalysis is mainly used for forecast timescales, there is no real incentive to do that.
Nick writes
It wasn’t expected to be drying though, was it.
“It wasn’t expected to be drying though, was it.”
I don’t know. Do you have any references?
Nick writes
Seriously? Its a pretty important result I think. Its a negative feedback, obviously.
The net is full of references.
for example…
https://www.scientificamerican.com/article/is-water-vapor-in-the-stratosphere-slowing-global-warming/
and the associated paper
http://science.sciencemag.org/content/327/5970/1219.abstract
“The net is full of references.”
The claim was: “It wasn’t expected to be drying though, was it.”
and I don’t see any expectation in those docs. People should be able to back up their claims.
R2Dtoo,
Part of the region where UAH is supposed to provide mean temperature is in the free troposphere, above the boundary layer. There, temperature doesn’t depends on local surface temperature but on surface temperature in remote deep convective regions. So if there is more variability in these regions, there will be more variability in UAH estimation. This is consistent with a warm UAH estimate during 98 El Nino for which deep convective region were very warm, in the tropical pacific.
UAH doesn’t give a surface temperature.
“UAH doesn’t give a surface temperature.”
Yes, that is the POINT. The warming issue affects the atmosphere, and looking at the lower troposphere, away from human influence is a best practice.
The surface temperature measurement is fraught with a litany of problems, making it highly unreliable and uncertain, much like you, you fake.
Your email is non-existent, a violation of our commenting policy:
================================================
MX record about gmail.com exists.
Connection succeeded to alt4.gmail-smtp-in.l.google.com SMTP.
220 mx.google.com ESMTP 9si1116178wmp.69 – gsmtp
> HELO verify-email.org
250 mx.google.com at your service
> MAIL FROM:
=250 2.1.0 OK 9si1116178wmp.69 – gsmtp
> RCPT TO:
=550-5.1.1 The email account that you tried to reach does not exist. Please try
550-5.1.1 double-checking the recipient’s email address for typos or
550-5.1.1 unnecessary spaces. Learn more at
550 5.1.1 https://support.google.com/mail/?p=NoSuchUser 9si1116178wmp.69 – gsmtp
=====================================
Goodbye, faker.
Nick writes
Stratospheric water vapor concentrations decreased by about 10% after the year 2000. Here we show that this acted to slow the rate of increase in global surface temperature over 2000–2009 by about 25% compared to that which would have occurred due only to carbon dioxide and other greenhouse gases.
These are features of the atmosphere that we’re only just finding out about, have no great knowledge of, models dont predict and are negative feedbacks.
Nick writes
People who have such strong convictions on AGW should be aware of all the results.
“should be aware of all the results”
You’re just not reading. The claim wasn’t about results. It was a claim that someone expected humidity in the stratosphere to increase. Maybe they did, but I don’t know of it, so I asked for substantiation.
Nick writes
I said, “It wasn’t expected to be drying though, was it.”
That is a claim that nobody expected it to decrease, not that anyone expected it to increase. Perhaps you should take some of that medicine yourself.
The most frequently used method to calculate trend lines is least squares. That method suffers from a tendency to be severely influenced by outliers, such as the very warm El Nino years. If I weren’t so busy on other things, I would calculate the trend line using the more statistically robust minimum absolute deviation method. (Section 15.7 of Numerical Recipes in C++ (Press et al., 2002) provides an explanation.) Just by eye (which is admittedly dangerous), it looks as though a robust slope estimate would show lower rates of temperature change that shown in the graphs.
Randy Stubbings on November 30, 2016 at 2:21 pm
That method suffers from a tendency to be severely influenced by outliers…
Sure? Your statement will at best hold when you calculate OLS trends without a confidence interval, e.g. when using the linest function in Excel in the trivial mode.
Bindidon: “Sure? Your statement will at best hold when you calculate OLF trends without a confidence interval.” (below)
No. Calculating a confidence interval around a line with the wrong slope does not change the fact that the line has the wrong slope. Moreover, when the OLS assumptions (including normally distributed, homoscedastic residuals) are violated, as often happens when there are outliers, the calculated confidence intervals are wrong, too.
Lets just continue to ignore the error terms. Sigh.
Do we even know what they are? I don’t think anybody has done a detailed analysis on this for the surface temperature.
The HADCRUT4 data set is accompanied by an error analysis paper and includes monthly 95% confidence intervals. The width of the interval varies by month, but since January 2007 the average is 0.31 degrees C. Yes, that’s point three one, not point zero three one… and there has been no downward trend for about 50 years.
Here’s a link to the paper: http://dx.doi.org/10.1029/2011JD017187
” but since January 2007 the average is 0.31 degrees C. Yes, that’s point three one, not point zero three one”
Well, here’s the graph of annual averages, with 95% intervals marked. It’s a lot less that 0.31 for annual:
http://www.metoffice.gov.uk/hadobs/hadcrut4/data/current/web_figures/hadcrut4_annual_global.png
Nick Stokes:
Go look at the actual HADCRUT4 data. Here is the record extracted directly from the HADCRUT4 download page for September:
2016/09 0.714 0.675 0.758 0.689 0.739 0.524 0.904 0.666 0.766 0.519 0.912
The data description, also extracted directly from the HADCRUT4 web page, states:
Column 2 is the median of the 100 ensemble member time series.
Columns 11 and 12 are the lower and upper bounds of the 95% confidence interval of the combined effects of all the uncertainties described in the HadCRUT4 error model (measurement and sampling, bias and coverage uncertainties).
So, for September 2016, the anomaly is 0.714 C, the lower bound is 0.519, and the upper bound is 0.912. The width of the 95% confidence interval is 0.912 – 0.519 = 0.393, The post is entitled “November 2016 Projected Temperature Anomalies from NCEP/NCAR Data,” so I think we ought to use monthly confidence intervals. The annual anomaly record for 2015 is
2015 0.760 0.727 0.800 0.744 0.776 0.683 0.837 0.719 0.805 0.672 0.850
which has a confidence interval width of 0.850 – 0.672 = 0.178. Yes, that’s less than 0.31, but still not anything like 0.01.
Randy,
I briefly looked at that paper, and it points to another paper, Brohan 2016, for measurement and sampling errors. And that paper claims that the random error on a single measurement is only .2C! It cites Folland 2001 as authority, but I haven’t had the time to track down a free copy of that one yet. From the abstract, though, it does not look like it deals with actual instrument error assessment, which is critical because I know for a fact that the current electronic devices have measurement errors that are greater than 1C. So I don’t see how they can have error bars as low as +/-0.31C.
Paul Penrose on November 30, 2016 at 1:27 pm
Do we even know what they are? I don’t think anybody has done a detailed analysis on this for the surface temperature.
May I recommend the careful lecture of the following document?
Quantifying uncertainties in global and regional temperature change using an ensemble of observational estimates: the HadCRUT4 data set
http://www.metoffice.gov.uk/hadobs/hadcrut4/HadCRUT4_accepted.pdf
I know it’s a bit hard work to do: I read the paper last year (58 pages).
Paul Penrose on December 1, 2016 at 4:45 pm
… because I know for a fact that the current electronic devices have measurement errors that are greater than 1C. So I don’t see how they can have error bars as low as +/-0.31C.
It seems you are experienced in the domain. Could you please present a document showing such a fact?
My knowledge in the instrument domain is near absolute zero, so I have to rely on information produced by others, e.g.
https://web.mst.edu/~cottrell/me240/resources/temperature/temperature.pdf
And there I read somewhat different concerning these “current electronic devices”, e.g.
And the devices referred to manifestly are accessible to anybody at a cost of $8.95 per single buy!
So I await your technical comment, unless you yourself detect a powsteriori that you indeed managed to confound absolute manufacturing error and relative measurement error, oh My… 🙂
Bindidon,
You are talking about measurement *repeatability* which is not the same thing as accuracy. Sure, an modern RTD can produce the same value within +-0.1C for the same temperature once the offset is known at that temperature. However the response by these devices is non linear and the offset changes over the entire range. Because of this the accuracy over the entire range is much greater. For example, for the platinum RTD in the MMTS units in use in the US, the stated accuracy across the entire range is +-1C. If you account for drift over time this value is effectively higher the older the unit becomes.
In many other parts of the world they are still using mercury thermometers. I don’t think eyeballing one of those can be done at anything near +-0.1C accuracy, maybe .25 or .5, but that’s all. So I stand by my statement that claiming 0.2C single measurement error for the surface temperature measurements is not defensible.
“1000th of a degree K” – why not 10,000th or 100,000th as that would be just as (un)real?
For an accurate look at the warming rates for the year, check out this website:
mta-graphs.com
The site is still being set up, but they have colour graphs of all the 27 UAH temperature series.
There are Land and Ocean, Land only, and Ocean only, graphs for Global, Northern Hemisphere, Southern Hemisphere, Northern Polar, Northern Extra Tropical, Tropics, Southern Extra Tropical, and Southern Polar.
There are even colour graphs of the warming rates for Australia, USA 48, and USA 49.
Definitely worth checking out.
Wow wow wow wow! Sheldon Walker seems to just have reivented the wheel.
How many years do you think lots of people use that good old data?
But… does that UAH data speak to you?
“October was the first month in a long time that saw all 5 anomaly data sets fall below their levels of 12 months ago. UAH was marginal with a drop of just 0.003°.
While the above statement may be true, it is also true that November is likely higher than all the months this year except Jan, Feb, March, April. So much for cooling.
Likely? To be, or not to be. That is the question.
At least there’s no more than 24 hours or so to wait for the answer!
And indeed you were right – almost.
The UAH anomaly for November is 0.45 deg C which made it the warmest since May
The only thing that really gets my goat (the one with the shrunken head from CO2) is that all of these high-powered science wonders really expect me to believe that they can measure the temperature of the earth to a thousandth of a degree. Get serious folks. You would be doing well to accomplish that under completely controlled lab conditions. So what do we get next? Probably the warmest evah by 0.004C, with a 38% probability.
Exactly. That is the kind of deranged nonsense which would see you thrown out of a freshman physics lab and sent for psychiatric evaluation.
I rather doubt any of those are measured temperatures anyway, most often the Daily Average Temp is (Temp-max – Temp-min)/2 + Temp-min, so there is no guarantee any of them represent any kind of chronological weight, but not always. So they are not only preforming the statistically suspicious action of taking an average of an averages, the definition of what the average is is not well defined!
December 2016 should start showing signs of cooling with exception of the northern portions of North America.
Do you have any grounds to think that may be the case, or is it pure speculation?
Sea Surface temperatures. They are cooling. Air temperatures follow the sea surface temperature trend. If they don’t this time, then the air temperatures are almost certainly being fabricated.
jclarke341 on December 1, 2016 at 5:56 am
Air temperatures follow the sea surface temperature trend.
Do you really know this? Or is it a supposition?
If you know: why don’t you present us a chart with plots of e.g. ERSST4 and GHCN V3? So we could compare their behavior 🙂
So there’s no sign of the “Steepest drop in global temperature on record”, as excitedly reported in yesterday’s article? What a surprise!
Ever since Tom Karl’s 2015 paper on re-writing the SST record with the new ERSST4, we have seen incredible increases in SST data starting from 2011 (when the HadNMat2 data used for comparison to create the ERSST4, ended).
It is effectively exponential. All those ship engine intake temperatures (that one can’t really access anywhere) are skyrocketing. Not so much the SST satellite data and the buoys and float data, but those ship engines !
We need someone to go in and find out what is really going on with those ship engine intakes.
November UAH is 0.45. A bit higher than the projected anomaly of 0.421.
I was taught that the correct unit is “kelvin” or simply “K” (capital K, not minuscule k which is used for “kilo” prefix), not “degree kelvin” nor “degree K”).
UAH is 0.45 for November 2016: http://www.drroyspencer.com/2016/12/uah-global-temperature-update-for-november-2016-0-45-deg-c/
It was by far the warmest November in the UAH record and also the most anomalously warm month since May this year.
HadCRUT4 for OCTOBER came in at +0.587 versus my projection of +0.729. I did not see that coming.
RSS for November has come in at +0.390 versus the projection of +0.431.