Stunning new data indicates El Nino drove record highs in global temperatures suggesting rise may not be down to man-made emissions
- Global average temperatures over land have plummeted by more than 1C
- Comes amid mounting evidence run of record temperatures about to end
- The fall, revealed by Nasa satellites, has been caused by the end of El Nino

By David Rose
Global average temperatures over land have plummeted by more than 1C since the middle of this year – their biggest and steepest fall on record. According to satellite data, the late 2016 temperatures are returning to the levels they were at after the 1998 El Nino.
The news comes amid mounting evidence that the recent run of world record high temperatures is about to end. The fall, revealed by Nasa satellite measurements of the lower atmosphere, has been caused by the end of El Nino – the warming of surface waters in a vast area of the Pacific west of Central America.
Some scientists, including Dr Gavin Schmidt, head of Nasa’s climate division, have claimed that the recent highs were mainly the result of long-term global warming.
Others have argued that the records were caused by El Nino, a complex natural phenomenon that takes place every few years, and has nothing to do with greenhouse gas emissions by humans.
The new fall in temperatures suggests they were right.
Big El Ninos always have an immense impact on world weather, triggering higher than normal temperatures over huge swathes of the world. The 2015-16 El Nino was probably the strongest since accurate measurements began, with the water up to 3C warmer than usual.
It has now been replaced by a La Nina event – when the water in the same Pacific region turns colder than normal.
This also has worldwide impacts, driving temperatures down rather than up.
The satellite measurements over land respond quickly to El Nino and La Nina. Temperatures over the sea are also falling, but not as fast, because the sea retains heat for longer.
This means it is possible that by some yardsticks, 2016 will be declared as hot as 2015 or even slightly hotter – because El Nino did not vanish until the middle of the year.
But it is almost certain that next year, large falls will also be measured over the oceans, and by weather station thermometers on the surface of the planet – exactly as happened after the end of the last very strong El Nino in 1998. If so, some experts will be forced to eat their words.
Last year, Dr Schmidt said 2015 would have been a record hot year even without El Nino.
‘The reason why this is such a warm record year is because of the long-term underlying trend, the cumulative effect of the long-term warming trend of our Earth,’ he said. This was ‘mainly caused’ by the emission of greenhouse gases by humans.
Dr Schmidt also denied that there was any ‘pause’ or ‘hiatus’ in global warming between the 1998 and 2015 El Ninos.
But on its website home page yesterday, Nasa featured a new study which said there was a hiatus in global warming before the recent El Nino, and discussed why this was so. Last night Dr Schmidt had not returned a request for comment.
However, both his own position, and his Nasa division, may be in jeopardy. US President-elect Donald Trump is an avowed climate change sceptic, who once claimed it was a hoax invented by China.
Last week, Mr Trump’s science adviser Bob Walker said he was likely to axe Nasa’s $1.9 billion (about £1.4 billion) climate research budget.
Other experts have also disputed Dr Schmidt’s claims. Professor Judith Curry, of the Georgia Institute of Technology, and president of the Climate Forecast Applications Network, said yesterday: ‘I disagree with Gavin. The record warm years of 2015 and 2016 were primarily caused by the super El Nino.’
The slowdown in warming was, she added, real, and all the evidence suggested that since 1998, the rate of global warming has been much slower than predicted by computer models – about 1C per century.
David Whitehouse, a scientist who works with Lord Lawson’s sceptic Global Warming Policy Foundation, said the massive fall in temperatures following the end of El Nino meant the warming hiatus or slowdown may be coming back.
‘According to the satellites, the late 2016 temperatures are returning to the levels they were at after the 1998 El Nino.
The data clearly shows El Nino for what it was – a short-term weather event,’ he said.
This post – although good news – is suspect. It does not link to a dataset or even state the source. It does not have an end date (I presume it is comparing PARTIAL november data to full months elsewhere – which makes it useless) It has an arbitrary “0” line that ignores the last 18 years of actual data. It does not state an altitude band for these temperatures – and if it is satellite data – it is NOT surface data. I had already shared this on my Facebook Climate page, but I am thinking I should delete it until the data is better.
Anthony – this is pretty sketchy. You have published better.
Agree, the data should be presented accurately.
That will not stop it being reproduced ad nauseam in the coming days and months as “proof that…” blah, blah, blah. “It must be true I saw it on the internet”.
Reminds me of Mann’s hockey stick. Which is still being trotted out as proof of global warming.
It’s not good news regardless! The IPCC says warming up to. 1.8C is beneficial globally. No negative effects are proven above that. Crop reserves are at record levels and deserts are greening. Warmth is beautiful!
“…may not be down to man-made emissions” should perhaps read “…may not be due to…”, or was the choice of “down” a sort of semi-pun?
The data has not been adjusted yet. Let’s wait for that to happen before jumping to conclusions.
Ouch.
LOL….spot on
Good one!
The headline as so often is misleading. The graph shows TLT over land (cherry-picked), not global. And so is the article. It is cagey about the dataset being talked about. That dataset is RSS V3.3, being phased out. RSS issues it with a warning:
“The lower tropospheric (TLT) temperatures have not yet been updated at this time and remain V3.3. The V3.3 TLT data suffer from the same problems with the adjustment for drifting measurement times that led us to update the TMT dataset. V3.3 TLT data should be used with caution.”
And this data shows why. RSS over land dropped by 0.615°C, from 0.735 in Sep to 0.12 in Oct. UAH TLT dropped by just 0.23°C, probably reflecting the extreme cold in Siberia. In actual global, UAH dropped only 0.03°C, to 0.41°C (about the same as last December), and RSS global was 0.35.
RSS V4.0, the proper version, also did not show a spectacular drop, with TMT down from 0.925 to 0.697, It was 0.648 last December.
Answer this question!
Does the theory of AGW CO2 warming occur more on land or ocean?
AGW theory simply says that GHGs will block outgoing heat. The Earth as a whole will warm. As to how that is distributed, that is a matter for meteorology. Land temperatures change more easily.
Stokes: “… will block the outgoing heat …”
Thus, the lower troposphere should warm significantly.
It hasn’t.
Game over.
CO2 UP. WARMING STOPPED.
Game-Set-Match……….
Janice Moore on November 28, 2016 at 1:09 pm
Thus, the lower troposphere should warm significantly.
It hasn’t.
Well, Janice Moore, that depends on where you measure. Maybe you should download and process UAH’s 2.5° grid data (located in the same directory as the zonal/regional data); you will then get a good feeling.
Here is a chart of so called latitude trends (each point in a line denotes, for the period selected, the linear estimate of one of the 66 latitudes (the stripes 82.5N-90.0N and 82.5S-90.0S have no valid data):
http://fs5.directupload.net/images/161028/g25fmuo9.jpg
Here you see that, while the troposphere doesn’t warm in the mid latitudes, it does very well above the Arctic (over 4 °C / century at 80.0-82.5N), and, more recently, even above the Antarctic (over 3 °C / century at 80.0-82.5S).
…dang, and another perfect fit with the AMO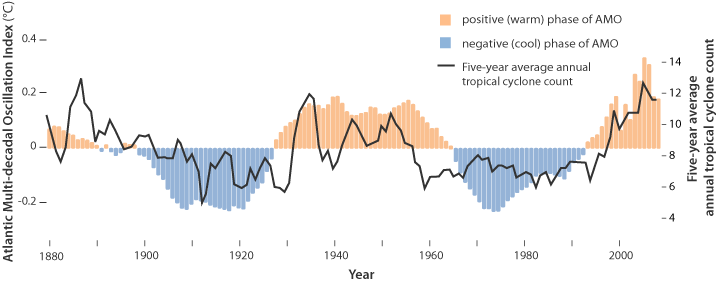
whoda thunk it
NIck says, “AGW theory simply says that GHGs will block outgoing heat.”
That is incorrect. GHC’s simply absorb and rapidly emit outgoing heat. Warming is due to less than 50% of the heat waves being re-directed back towards earth. There is no blocking or trapping! Only a delay,
“GHC’s simply absorb and rapidly emit outgoing heat.”
No, the heat is absorbed and warms the gas (or keeps it warmer than it would otherwise be). The gas emits according to its temperature. So the temperature remains in balance, but it isn’t necessarily the molecules that absorbed the IR that re-emit it.
The atmosphere thus warmed emits in both directions; the downward stream helps keep us warmer. The main reason why the OLR is reduced is that it is emitted from a layer much colder than the surface. Gas at 230K is part-obscuring a surface at more like 290K.
You confirm my point.
You were wrong to say “AGW theory simply says that GHGs will block outgoing heat.”
NIck you implied that I was wrong to state CO2 rapidly absorbs and emits infrared, and then you went off on a tangent to create a facade of expertise.
Based on measurements of fluorescence, the total time for absorption, excitation and emission of a photon takes about one billionth of a second. I am not sure of the exact duration time for CO2 to absorb and then emit a photon but I suspect it is also close to a billionth of a second.
For you to argue CO2 “traps” infrared, for how long are you arguing CO2 traps the heat
OK, GHGs will block outgoing IR (substituting radiation from a colder source).
“For you to argue CO2 “traps” infrared”
I didn’t say it traps infrared. I said it blocks it. And it does. Photons emitted from the surface are absorbed by GHGs. They don’t exist any more. Their energy does, but now has to be re-radiated from a much cooler source gas.
You can see the effect very well in these spectra from Grant Petty’s book, taken over an Alaska icefield. Looking down, you very clearly see the bite out of the spectrum between about 600 and 750 cm⁻¹. You can see how, at about 900 cm⁻¹ (atmospheric window), the IR comes from the 273K surface. But in the bite region, the rays were blocked by CO2 and re-emitted at about 225K, with far less heat transported.
When CO2 absorbs a photon, the energy is transferred to other gas molecules generally before it can be re-emitted. That is the basis of local thermodynamic equilibrium – temperature is diffused fast enough by collision that the molecules can be said to have equal temperature (and so the gas has a temperature). This fails in the very high atmosphere.
jim steele November 28, 2016 at 8:57 pm
Based on measurements of fluorescence, the total time for absorption, excitation and emission of a photon takes about one billionth of a second. I am not sure of the exact duration time for CO2 to absorb and then emit a photon but I suspect it is also close to a billionth of a second.
For CO2 in the 15 micron band the mean emission time is of the order of millisec, whereas in the lower troposphere the mean time between collisions is ~0.1 nanosecs so most of the absorbed energy is shared with surrounding gas molecules, not emitted.
Nick, all other things being equal, which they never are.
Indeed high collisions rates in the lower troposphere will result in a sharing of kinetic energy that was gained from infrared absorption by CO2. If we limit our analysis there, we could argue CO2 blocks heat from escaping. But the bigger picture also reveals CO2 facilitates cooling of the troposphere.
O2 and N2 make up 99% of the atmosphere and those molecules do not absorb or emit infrared, so those molecules can not lose kinetic energy and cool radiatively. However they can transfer energy to CO2 via collisions after which CO2 emits infrared and facilitates atmospheric cooling. Roughly speaking we can say CO2 facilitates warming in the denser lower atmosphere and facilitates cooling in the upper atmosphere.
Convection dominates heat transfer from the earth’s surface and rapidly transfers that heat to the upper troposphere. CO2 does not block this mass transport of heat. If the atmosphere only consisted of N2 and O2, their heat that was gained from collisions with the warm earth’s surface could not radiate back to space. However collisions with CO2 transfers that energy, which then CO2 quickly emits as infrared allowing the heat to radiate away.
From that perspective, to say simplistically argue CO2 blocks heat is very deceptive.
“AGW theory simply says that GHGs will block outgoing heat. The Earth as a whole will warm. As to how that is distributed, that is a matter for meteorology. Land temperatures change more easily.”
Physics shows that water prevents GHG’s from penetrating the surface and hugely only allows solar energy through. Therefore the influence GHG’s has on land compared to the ocean is significantly different and much reduced with water. Not only that, but latent heat adds another feature to increase the difference even further with evaporation. Block is not correct as slowing down slightly is far more accurate.
Increased evaporation cools the surface over water whereas over land more precipitation is needed to do a similar thing. Land temperatures change more easily because the energy is only allowed through via conduction once in contact with the surface. Therefore below the ground has little influence on the surface and removes a mechanism that hugely influences water regardless of GHG’s.
Land therefore hugely only responds to above the surface in the atmosphere and shows the affect on GHG’s by far on the planets surface. Land temperatures therefore are easily the best control to confirm how the change in GHG’s is affecting them or not. Hence, using land temperatures is not cherry picking when there is a good scientific reason for this in helping distinguishing science conjecture.
How that is distributed is by radiation, convection and conduction. Where meteorology is only part of the huge ocean cycles that acquire there energy from the sun.
Nicks getting desperate. !
Reaching for a one-month aberration in a land only component of a deprecated index is desperate. And headlining it as global doesn’t help.
“And headlining it as global doesn’t help.”
roflmao.. coming from a rabid AGW believer, that is truly hilarious.
Glad to see you admit the El Nino was not global.
So it won’t be used to show a Global “warmest evah”.. will it Nick.
Thanks for the laugh 🙂
“So it won’t be used to show a Global “warmest evah”.. will it Nick.”
I doubt that anyone, WUWT or elsewhere, ever quoted RSS TLT land only before Rose cherry-picked it for this occasion. Or ever will again.
Run and Hide , Nick..
you know that it is ONLY the strong El Nino that will mean 2016 is “warmest evah”
El Ninos are all the alarmista like you have.
Honestly, Andy, look back at that last exchange and imagine how it would read to someone new here. Nick is making sensible and on-topic points, all Andy does is taunt.
How old are you, Andy? You appear rather shallow and childish in these exchanges.
AndyG55, I wrote this more than once: you insult here scientists who are 1,000 times more intelligent and experienced than you might ever become.
And that you do not solely here, your thick and fat footprints we can also see for example at Roy Spencer’s site.
You are even unable to do the simplest job evah: to design a correct WFT graph. You perfectly behave like an ignorant and arrogant person.
‘Run and Hide , Nick‘ ? Well, AndyG55: I have a far far better idea!!!
“Honestly, Andy, look back at that last exchange and imagine how it would read to someone new here. Nick is making sensible and on-topic points, all Andy does is taunt.”
I really don’t think he understands just how obvious the contrast between his conduct and Nick’s conduct stands out. Nick talks about the science, and provides evidence to support his position. Andy sneers and whines like a school kid with a bad attitude.
Good job, Andy G! FOUR trolls, fat with arrogance and puffed up with empty notions of what “science” is, waddled over, armed with ad hominem and blanks, to the rescue of their brother, Nick.
Nick talks about the science — that exists only in his own imagination.
When Nick talks about science realism, he will be listened to.
He brings the scorn and derision upon himself: out of his own mouth (both sides of it).
Does that mean that all previous measurements from this dataset should be ignored, or just the ones that show a fall?
RSS says the dataset has problems with drifting measurement times and should be used with caution. That does mean that a sudden drop of 0.6 degrees not reflected in other datasets should be viewed with scepticism. But some sceptics believe anything that confirms their belief.
…and some wamunists will believe anything.
Looked like it wasn’t a big difference between the versions. Maybe 0.02 degrees. So, its just an alarmist deflection imo. Anyway, the REAL global data for Nov. comes out in a couple days. We’ll then see if this land cooling went global or not.
“Looked like it wasn’t a big difference between the versions. Maybe 0.02 degrees. “
Well, one big difference is that RSS V4.0 doesn’t have a TLT. But its TMT land only anomaly was 0.558°C. That’s a lot different from 0.12°C.
“Well, one big difference is that RSS V4.0 doesn’t have a TLT”
Why would that be?
Could it be because they know it would prove they were scamming the data.
Probably was a good idea for them to hold off until after the Presidential Election.
They can now “adjust” to fit the new meme. 🙂
Nick writes
I think you meant extreme anomalies in Siberia?
Where did David Rose get his data from: Did he download it himself or did he rely on an undisclosed scientist for this information? Very suspicious?
Nick doesn’t tell us how he knows where David Rose got his data. So far there is no reason to believe Nick is right either.
November isn’t complete yet, so the last data point should be from October. UAH’s global temperature (TLT) dropped 0.5 degC from the peak in February 2016 to June 2016 and has remained fairly constant since then. It is still roughly at least 0.2 degC above the average since 2000. In other words, it looks nothing like this graph.
This is supposed to be a skeptical science blog, so let’s be skeptical and scientific about what we read and POST here. Otherwise we are no different from the religious zealots on the other side. Climate change implies a change in 30-year or longer averages, so nothing that happens in one month, or one year means “game over”.
The RSS V3.3 (use with caution) land only TLT data is here. Rose’s graph is poor, but seems to match the numbers. But yes, I think it is extraordinary that he would write such a report without giving the source. Or that anyone would pay attention to it.
I have been saying the same for weeks now, based around seat-of-the-pants observations and reports from the New Zealand farming community. It is based around grass growth, production, and natural responses to spring.
New Zealand dairy production is down 10% across the country – in my province 14%. Deciduous trees were 3 weeks late breaking into leaf. Silage and vegetable crops are late by a similar period. The spring was too cool and wet with little sun to lift soil temperatures.
One old timer, who is an agricultural contractor and keeps weather records, says that the last time this happened was in the 70’s which correlates with the 1972-73 El Nino. Our records were sketchy back then but according to my personal observations this was a more powerful event then both 1998 and 2015. Farmers do not forget as we have a range of proxies that directly hit our pockets and personal stress.
New Zealand is a range of mountains in the sea with a lot of wind. This is not just a land phenomenon. If I had to bet one way or the other I would back a very cool 2017.
I.e Cooling occurred after the 1972 El Nino
Michael Carter
As a fellow NZer the feedback from rural farmers is the real data. You will also note that the westerly / north westerly winds normally experiencing a peak during October and November mainly over the South Island (Te Waipounamu) have been mostly absent this year, and only even now showing no real sign of endurance. These winds are absent primarily because the greater percentage of the NH summer atmospheric volume went north into the Arctic region causing warming and ice breakup. Exactly the same NH / SH atmospheric transport bias pattern occured in 2016 as in 2012, the year of the greatest ice loss.
Ozonebust –
Yes, and the term La Nina is being used by media. The Metservice is predicting a “cloudy, humid summer’ for the northern Nth Island. What they did not say was ‘cooler’ but I am prepared to bet that it will be. Still darn cold here in Waikato and its nearly December!
Michael
You will be happy to know that NASA Climate division is sending up a satellite to locate the Southern Hemisphere. If successful, they will dispatch a team to cut down one of your trees in an attempt to verify your your direct observation.
Now John, they aren’t going to cut down just one tree.
In the great Mannian tradition, they will cut down 50 to 100 trees, then use an AlGoreRhythm to pick out the one that gives them the best hockey stick.
~¿~
Same pattern to the west of NZ in southern. Australia
Second wettest winter on record
Central Victoria latitude 37 south rainfall for 11 months of 2016 with one month to go now at 48 inches versus
24 for whole of 2015
Very late cool spring only one day over 30c
Sounds like La Nina to us
La Niña? Where?
1. Look at the ENSOmeter quietly returning to neutral since 2 weeks:
http://wermenh.com/wuwt/elninometer-current.gif
2. Look at JMA’ENSO 5 month running mean data, you see how it returns to neutral as well
http://ds.data.jma.go.jp/tcc/tcc/products/elnino/elmonout.html#fig1
3. Look at BOM’s SOI:
http://www.bom.gov.au/climate/enso/monitoring/soi30.png
(click on the image – WordPress cache problem)
4. Klaus Wolter’s MEI is far from any heavy La Niña mode:
http://www.esrl.noaa.gov/psd/enso/mei/index.html
Now THIS is really interesting. I know NOAA was predicting that the La Nina was going to fizzle, but I honestly thought it was just the Climate Faithful whistling past the graveyard.
If we don’t get a major La Nina, then that will increase the odds that this past El Nino will include another step change to the global average temperature.
We may actually see a real end to the pause here. The next two years should be interesting.
Is this why Phil missed his monthly cut-and-paste rant? Here’s the one from October
http://www.slate.com/blogs/bad_astronomy/2016/10/24/september_2016_is_the_twelfth_month_in_a_row_of_record_braking_temperatures.html
NASA and Schmidt are going to be mutually exclusive when NASA is told to get out of the climate Ouija Board business . Let’s just hope the raw data doesn’t do a Hillary wash .
Good post. I think Gavin Schmidt will try to adjust GISS to eliminate a “pause”.
“The reason why this is such a warm record year is because of the long-term
underlying trend^¿^
NorCal SITREP – La Nina is full on. This is a “wet” La Nina, meaning, the line between the “wet PacNW” and “dry SW US” that is typical of La Nina, is actually well down into California. The line is going to be just south of the Bay Area for most systems. This will give NorCal a normal to above normal water year, So Cal will continue in drought. In addition, we will see several low elevation snow events, and, in all likelihood, at least one bad freeze that will remind everyone we are in the mid latitudes.
You know I wonder if that’s not one of the causes of this daft movement, the weather just doesn’t do much, and they think it’s like that everywhere. In Ohio we can get all 4 seasons in a 36 hour period, and no one here is really surprised lol
With the big very cold blob stretching across mid latitudes in the N Pacific and even more cold water in the South Pacific, the ENSO all by itself is less definitive as a cooling mechanism. Even if ENSO doesn’t go much below its present level, a major cooling would appear to be in the offing. I don’t think the record drop in temperature was due to just the ENSO band at the equator. Has anyone considered using what we know about ENSO water temperatures and world temperature and adding on exceptional effects like the cold blobs and general cooler oceans.
http://weather.unisys.com/surface/sst_anom.gif
Dang the link! click on the gif to get the recent november map.
The warm water left over from the EN in the NH has flowed toward the Arctic, where it will be lost to space. The forecast is for more cold.
News flash The orange on the map is not the normal.
We are all so used to seeing swathes of anomalous warmth on these maps that what stands out for us these days is the blue bits. Have a close look at the map and tell it looks to be cooling.
Flash!
Heat flows from warm to cool. The areas that were anomalously warm have now cooled and the hotter areas are on their way out of the system.
So a cooling climate system is the way to bet.
Meanwhile, the sun will be warming the tropical Pacific with less intensity in coming years than it did during the natural late-20th century warming cycle, so it will be a long time before another super El Nino such as in 1998 and 2016.
It would seem to me that there has to be periods where the main reservoirs of stored heat in the ocean get over turned back to the surface to cool.
Where I live, the difference between warm air from the gulf to air from canada, is 10 or 15 F in water vapor. It’s going to get cold a lot of places if it has all cooled off.
As always, the EN blew off a lot of accumulated heat from the ocean into the air, spiking land temperatures. It will now take years of more sunshine on the tropical Pacific and normal wind patterns to pile up more warm water in the western Pacific, until the winds weaken and the water flows back toward the Americas. Then the deeper cold water will well up with the following LN.
It’s a natural cycle of greater or lesser strength (strong in 1998 and 2016), driven by the sun and oceanic circulation. Man-made GHGs, not so much.
The Pause that refreshes will soon be back on track, unless the cooler sun causes a worrisome decline in the beneficial warmth we’ve enjoyed since the Great PDO Flip of 1977.
I posted this graph the other day. and didn’t describe it very well.
It is RSS land only data, The running 8 month change in temperature is calculated and graphed.
This shows the massive drop in temperature since the El Nino peak.
..When you torture the data long enough, it will confess to anything you want ! As an American living in Canada, I really hope the “Alarmist” are right…I would find it extremely difficult to live under 3 miles of ice !
UAH land only has a similar drop
Andy, what is the “8 month change” you are plotting? Could you describe that is terms that are mathematically reproducible?
Plus proper description and link to data would be nice. “UAH” is a university not a data set .
Gees, are you really that mathematically illiterate??
That explains the CRAP that you post.
Work it out yourself, BOZO. !!
AndyG55 November 29, 2016 at 1:24 am
“Gees, are you really that mathematically illiterate??
That explains the CRAP that you post.
Work it out yourself, BOZO. !!”
Translation… I have no clue. I just found it on a denying blog somewhere and it looked pretty.
Andy, where did you find your UAH with a decline of 1.5°C?
The 6.0 UAH Land shows a decline of 0.8°C.
http://www.woodfortrees.org/plot/uah6-land/from:1997
“…some experts will be forced to eat their words.” They NEVER eat their words – they just double down.
So true. The Peak Oilers, the Ozone Holers, even the Population Bombers, NONE of them have ever admitted that their beautiful theories and predictions were wrong. Like failed prophets they just move the date of their apocalypse back a few more years.
Their opinions ought to chucked down a TWO HOLER!
@ur momisugly Dr Roy Spencer: any idea if this drop is below your line that would make 2016 tie with 1998 as the warmest year ever?
http://www.drroyspencer.com/wp-content/uploads/UAH-v6-LT-with-2016-projection-2.gif
“Based upon this chart, it would require strong cooling for the next two months to avoid 2016 being a new record-warm year (since the satellite record began in 1979) in the UAH dataset.” Nov. 1. 2016
http://www.drroyspencer.com/2016/11/uah-global-temperature-update-for-october-2016-0-41-deg-c/
I would guess not because that graph is global and the one at the top is land only.
I would guess not because the november value is already on the plot!
I meant “october” !
I voted with my pocketbook, bought wheels and Blizzak tires for the Jeep and the F150
“Dr Schmidt also denied that there was any ‘pause’ or ‘hiatus’ in global warming between the 1998 and 2015 El Ninos.”
Can I use the word “denier” Anthony? Please?
What’s up with it is that your data are bogus. Go here for the facts http://climate.nasa.gov/vital-signs/global-temperature/
Ray – Do you really believe that we can calculate mean temperatures prior to 1960 within 1 C?. NO ONE has openly defended this calculation with rational logical statistical analysis. Why? – because they can’t. We are not all suckers. Just think about it for a while. One only needs some common sense. It MAY have been 1 – 2 C colder during this early period. We cant know
Isn’t this damn-near exactly what was predicted by anyone with an ounce of awareness of el Nino? I’m a total layman member of the public but even I now know what goes El Nino up will also come La Nina down. The pause may well make a return appearance next year. Welcome back, ol’ buddy!
You are right Cheshire the el Nino is a blip in our climate, to my mind the recent warming was caused by the heating of the oceans by a few rampant solar cycles. The cycle we are having at the moment is weak but the ocean is a good heat bank to keep us warm. The sun also has long term holidays and is now at the start of its holiday period and the next two cycles are likely to be very wimpish and the oceans will cool.The last time it happened was the little ice age, where the Thames river froze. I am old and it will not bother me but over the next hundred years it is going to get bloody cold in Europe and Northern America. These cycles are like clock work and we are due.
Hmm. I’m not sure I’d trust a Daily Mail article on climate change.
Look, I’d be as delighted as anyone to see the CAGW hypothesis finally put to bed but I fear Nick Stokes and Toneb are right on this one. The data used is definitely iffy and, aside from that, David Rose’s conclusions rely on some pretty blatant cherry picking.
FWIW, I think it’s more than possible that CO2 warming (+ feedbacks) won’t be as dramatic as most of the models suggest, but it looks pretty nailed on that we’ll see a continuation of the current modest warming trend.
John,
what is missing in this thread,is the complete absence of awareness, that despite the awesome warm forcing power of a trace gas CO2 failing to keep the continental cooling from happening,it can’t even prevent all that suddenly elusive energy from leaving the continents to outer space so quickly in recent months.
Gee how does CO2 do that? be so selective on where to “trap” and where to ignore the outgoing heat leaving by the truckload.
Re: “cherry-picking” (and Dr. Curry being a “lone wolf” — in a pack of over 30,000….)
(from WUWT 10th anniversary anthology at 918-19 — free .pdf download on 11/17/16 thread)
Also see (Ibid. at 1,596)
From WUWT article: “… Global Warming Stopped 16 Years Ago”
If this comment is intended for me then you are showing me stuff with which I’m fully familiar.
I know what Phil Jones said and I know that “our side” jumped on it but I fear it’s not a supportive as we might suppose. Jones is clearly not an accomplished statistician.
Statistical significance is an arbitrary threshold. Conventionally, statisticians use a 95% confidence interval – but less/more stringent intervals such as 90% or 99% could be used. While it was true that for the 1995-2009 period the ZERO trend did fall inside the 95% CI envelope, it was far more probable that there was a warming trend than not.
I’m not sure I’d trust Nick,
and I certainly wouldn’t trust Toneb.
Low-level propaganda mis-information at best.
“but it looks pretty nailed on that we’ll see a continuation of the current modest warming trend.”
NOT !
John Finn: Hmm. I’m not sure I’d trust a Daily Mail article on climate change.
True. They have too much boob reports in the right column, which distracts from serious scentific consideration.
Bahh! The satellites don’t count the heat leaving the system through the arctic. It’ll take months for that heat to actually leave the system.
(Watch for a surge in sea ice mass–not extent.)
This comparison shows that mid level sea ice is ABOVE that of the last 5 years.
Its only the new stuff that is a bit slow.
But the Northern Russia cold patch is easing across to the Kara Sea, when it gets there the sea ice will go climb a rocket !
The big question is, “how do you think it is likely to play out?” Will it gently freeze over the surface, insulating the arctic water, likely leading to large melt in the summer? Or, will it be choppy, keeping the water exposed and causing thick build up of ice and heating of the atmosphere and cooling the ocean?
the longer the surface takes to freeze over in arctic winter, the more heat is lost to space. look for an increasing trend in summer extent after next summer.
It will also be interesting to see how exposed arctic and if ice mass growth affect CO2 concentration. NH late fall, increase uptake, delay release. Arctic continuing uptake. Siberia buried in snow and ice.
I don’t think anyone posted a link to the study referenced by NASA
The global warming hiatus: Slowdown or redistribution?
http://onlinelibrary.wiley.com/doi/10.1002/2016EF000417/full
Authors and commenters may want to modify the notation “Dr. Gavin Schmidt, head of
Nasa’s climate division” to the descriptive phrasing, “Dr. Gavin Schmidt, the CURRENT
head of Nasa’s climate division.
This change in phraseology promotes accuracy without making overt political
innuendos.