Stunning new data indicates El Nino drove record highs in global temperatures suggesting rise may not be down to man-made emissions
- Global average temperatures over land have plummeted by more than 1C
- Comes amid mounting evidence run of record temperatures about to end
- The fall, revealed by Nasa satellites, has been caused by the end of El Nino

By David Rose
Global average temperatures over land have plummeted by more than 1C since the middle of this year – their biggest and steepest fall on record. According to satellite data, the late 2016 temperatures are returning to the levels they were at after the 1998 El Nino.
The news comes amid mounting evidence that the recent run of world record high temperatures is about to end. The fall, revealed by Nasa satellite measurements of the lower atmosphere, has been caused by the end of El Nino – the warming of surface waters in a vast area of the Pacific west of Central America.
Some scientists, including Dr Gavin Schmidt, head of Nasa’s climate division, have claimed that the recent highs were mainly the result of long-term global warming.
Others have argued that the records were caused by El Nino, a complex natural phenomenon that takes place every few years, and has nothing to do with greenhouse gas emissions by humans.
The new fall in temperatures suggests they were right.
Big El Ninos always have an immense impact on world weather, triggering higher than normal temperatures over huge swathes of the world. The 2015-16 El Nino was probably the strongest since accurate measurements began, with the water up to 3C warmer than usual.
It has now been replaced by a La Nina event – when the water in the same Pacific region turns colder than normal.
This also has worldwide impacts, driving temperatures down rather than up.
The satellite measurements over land respond quickly to El Nino and La Nina. Temperatures over the sea are also falling, but not as fast, because the sea retains heat for longer.
This means it is possible that by some yardsticks, 2016 will be declared as hot as 2015 or even slightly hotter – because El Nino did not vanish until the middle of the year.
But it is almost certain that next year, large falls will also be measured over the oceans, and by weather station thermometers on the surface of the planet – exactly as happened after the end of the last very strong El Nino in 1998. If so, some experts will be forced to eat their words.
Last year, Dr Schmidt said 2015 would have been a record hot year even without El Nino.
‘The reason why this is such a warm record year is because of the long-term underlying trend, the cumulative effect of the long-term warming trend of our Earth,’ he said. This was ‘mainly caused’ by the emission of greenhouse gases by humans.
Dr Schmidt also denied that there was any ‘pause’ or ‘hiatus’ in global warming between the 1998 and 2015 El Ninos.
But on its website home page yesterday, Nasa featured a new study which said there was a hiatus in global warming before the recent El Nino, and discussed why this was so. Last night Dr Schmidt had not returned a request for comment.
However, both his own position, and his Nasa division, may be in jeopardy. US President-elect Donald Trump is an avowed climate change sceptic, who once claimed it was a hoax invented by China.
Last week, Mr Trump’s science adviser Bob Walker said he was likely to axe Nasa’s $1.9 billion (about £1.4 billion) climate research budget.
Other experts have also disputed Dr Schmidt’s claims. Professor Judith Curry, of the Georgia Institute of Technology, and president of the Climate Forecast Applications Network, said yesterday: ‘I disagree with Gavin. The record warm years of 2015 and 2016 were primarily caused by the super El Nino.’
The slowdown in warming was, she added, real, and all the evidence suggested that since 1998, the rate of global warming has been much slower than predicted by computer models – about 1C per century.
David Whitehouse, a scientist who works with Lord Lawson’s sceptic Global Warming Policy Foundation, said the massive fall in temperatures following the end of El Nino meant the warming hiatus or slowdown may be coming back.
‘According to the satellites, the late 2016 temperatures are returning to the levels they were at after the 1998 El Nino.
The data clearly shows El Nino for what it was – a short-term weather event,’ he said.
“…The new fall in temperatures suggests they were right.”
Who is they? Can we not write well enough so that attribution is clear?
Clarity? He starts with
“Global average temperatures over land …”
It means the Antarctic highlands are going down to -95 deg. C this winter, instead of staying at -94.
G
“Others have argued that the records were caused by El Nino, [begin parenthetical] a complex natural phenomenon that takes place every few years, and has nothing to do with greenhouse gas emissions by humans [end parenthetical] .
“The new fall in temperatures suggests they were right.”
Who is ‘they,’ you ask? This could not possibly be any clearer. ‘They’ obviously refers to ‘Others,’ in the previous sentence.
Aww, the Others, so extraterrestrials then. That’s so much clearer.
Wouldn’t want the S-word people to be right.
If so, some experts will be forced to eat their words.
==========================
nope. they will be forced to adjust the data.
Last year it was “adjusted data shows……” Adjusted means “faked.” But you knew that. WHich is why I find little credibility in any “study” that adjusts its data.
and forced to be not asked about it by the MSM. The same MSM that got the election wrong.
The federal “scientific” community has been behaving badly, spreading PC propaganda favoring carbon taxes instead of scientific truths. For the first time in DECADES I am reading “news” facts that are somewhere near truth; that energy STORAGE mechanisms (Gulfstream, El Nino et al) are responsible for the average global temperature. Sunlight is the huge energy gorilla in the room. We generally loose by infrared radiation back into cold space as much as we gain every day, except for a few scraps being sqirreled away in ocean waters. Said oceans meandering and cloud cover modulate the retained energy from month to month which air circulation carries over lands. Follow the oceans and air mass movements! Trash Gore & Co.
My computation of our energy generation via carbon products is that our earth absorbs 7,000 times more energy from sunlight than is produced by the combustion of carbon products. The average earth temperature uptick from said combustion is 0.011 degrees C (+0.02F). Really the vast majority of that occurs on city properties. Figuring that city property is at best 1% of the earth’s surface, this means that the average CITY temperature could be as much as 2 degrees F warmer because of the carbon combustion going on within city limits. That’s where most Liberals live, so little wonder that they are so convinced and incensed about this matter. But Mother Earth overall remains largely unperturbed by carbon combustion. Trash Gore & Co.
The people last mentioned before “they”. Learn to parse English properly before you criticise someone else’s (actually correct) English usage.
Indeed – they refers to “Others”. What could be clearer than that? That’s proper science journalism that is.
Here is the link to the “Daily Mail” article by David Rose- http://www.dailymail.co.uk/news/article-3974846/Stunning-new-data-indicates-El-Nino-drove-record-highs-global-temperatures-suggesting-rise-not-man-emissions.html
Does this put the kibosh on claims that 2016 was going to be warmer than 2015?
No. UAH and RSS will much warmer this year than last, because of the lag between El Nino changes and atmospheric temperatures.
However, this year will probably end up about the same as 1998 (my guess is slightly higher)
The satellite measurements over land respond quickly to El Nino and La Nina. Temperatures over the sea are also falling, but not as fast, because the sea retains heat for longer.
===
…and the lag says it was 100% El Nino….and without it temps would have continued to fall
The $3 Trillion dollar question is not will 2016 be warmer that 19 years ago (1998), but rather is global warming over.
There is now observational evidence of cooling of the surface ocean in regions that are most affected by solar cycle changes.
The cult of CAGW told us over and over and over that almost 100% of the warming in the last 150 years was due to CAGW. The cult of CAGW conveniently limited the discussion to ‘recorded’ temperature the last 150 years, rather than the full paleo climatic record (say this interglacial period, last 11,000 years for example)
It is a fact that planetary temperature has increased and decreased in the paleo record, in high latitude regions correlating with solar cycle changes. The warming we have experienced in the last 150 years is high latitude warming matching the past warming pattern. 100% of the past cyclic warming periods in the paleo record were followed by cooling periods when the solar cycle abruptly changed.
http://www.ospo.noaa.gov/data/sst/anomaly/2016/anomnight.11.28.2016.gif
I was not aware that NASA provide an extraction of the temperature of the ” lower atmosphere”. What dataset is this unattributed graph supposed to be?
http://www.drroyspencer.com/wp-content/uploads/UAH_LT_1979_thru_October_2016_v6-550×318.gif
I don’t see the massive in UAH Oct 2016 and November is not finished yet, so where does this final point come from? Has David Rose just made this up?
The article also describes temperature anomaly maps as “satellite images” which is BS. Clearly Rose has little idea what he is talking about. Perhaps Monkey face needs to have a chat and bring him upto speed.
OH DEAR, have they taken the Dr Spencer’s projections of “what would be needed to make 1998 the hottest year” ?
http://www.drroyspencer.com/wp-content/uploads/UAH-v6-LT-with-2016-projection-2-550×330.gif
This is a good illustration of why you should always state on a graph WHAT THE FRIGGIN DATA IS. And provide a link to the datasource close by in the text.
A guess is as good as a GCM prediction.
G
Of course it will. Adjustments ensure that. However, the de-couple from reality will soon be upon us. That will be far, far trickier to manage.
actually after looking around i found the data source of the graph: it’s the land only lower troposphere temperature of RSS
you can reconstruct it at WFT
Not yet. This is only over land and not global.
If I have properly comprehended the various comments here – and I am certainly fallible, and may be wrong – the not-so-gradual change to the weather station database, over the years:
ignoring
AAA Rural stations – against urban/airport stations
BBB ‘more northerly’ against ‘more southerly’
and possibly by reviewing marine stations — appear to have allowed a ‘trend’ to be ‘visible’ – I didn’t say “manufactured” – from data, not tortured at all.
Auto
Greg was prescient. He moved 600 miles north of where he lived in 1998. Just like Leonardo DiCaprio and Barry Obams stopped flying around the world spewing massive amounts of C02.
Of course not. If the temperatures don’t behave as predicted, then a new spate of “corrections” will occur, both of present and past data sets.
No, you fool!
Just the reality. The *claims* will go ahead unchecked…
Does this put the kibosh on…one whole degree being a big deal……yes!
The same people that have been screaming about 1 degree of warming being a big deal…are now trying to say 1 degree of cooling is not a big deal
Well We can expect Lord M of B to re-incarnate the pause, from the pause in the pause.
A sort of unphoenix, sinking out of the ashes. His post won’t be long delayed now.
G
george, we can expect the post announcing the pause to be delayed exactly as long as it takes for the pause to reappear. The big blip caused by the recent El Nino is still in the record, just as the big blip caused by the last big El Nino is still in the record. For the pause to go back to the old pre-El Nino days the temperatures will have to be a lot colder for quite a long time. My guess is that it will never go back that far again (at least for hundreds or thousands of years.)
What will happen is that this recent big blip will remain in the records, and a new pause will start from this current El Nino. It is already here – the new pause is approximately 6 months old.
This new pause will almost certainly persist for a few years as that is the nature of this sort of series. Large positive blips will cause a statistical pause of this sort.
What helped me visualize this was imagining a person standing still on the floor for say 20 minutes, then going upstairs for 1 minute (or jumps for 1 data point (number 20)), then returning to the ground floor and staying there. We plot height above the floor every minute. The slope of the line up to the jump is flat. The slope is positive after the jump but only until 39 minutes. After this the slope tips downwards as there are more points after the jump than before it. The jump is acting like a pivot. The slope will always be negative after this time.
Regarding the pause, this is defined as the furthest we can go back from present and find no positive slope.
At point 20 there is no pause – the slope is always positive going backwards.
At point 21 the pause is 2 minutes, data point 19, 20 and 21.
At point 22 the pause is 4 minutes; data points 18 to 22.
And so on – each data point added after the jump extends the pause by 2 data points.
For a series that is flat punctuated by positive blips this is what we would expect. The pause would extend backwards from the blip as far as we have moved forward in time, “balancing” on the blip.
If we get a second equal blip at 40 minutes, what do we see?
At point 40 the pause now extends from the second blip back to the first – that is 20 minutes from 20 minutes to 40 minutes.
Each time period back on the floor extends the pause by 2 time periods again as the flat line balances on the two blips.
For a flat period punctuated by equal sized blips we would never see the pause smaller than the time between the blips.
If the second blip is slightly bigger than the first, then it takes slightly longer for the pause to go back to the first blip, but only slightly. After a 10% bigger blip the pause is restored back to 20 minutes after just one more minute.
What we have seen is a pause that extended back to just before the first blip (the 1998 El Nino) for nearly 20 years, but never extended back much further. This is consistent with a blip superimposed on a positive slope. It is not consistent with a blip superimposed on a zero slope.
What I think we will see is the new pause extending back to just before the new blip but never reaching back to the first blip. This is consistent with positive blips superimposed on a positive slope. It is not consistent with positive blips superimposed on a zero slope.
Only one slight quibble with your response Seaice1,
M of B’s algorithm is an equal opportunity algorithm. It asks only is the calculated trend statistically different from zero.
So a credible minus slope or a credible plus slope are equally fatal to the pause.
But you are correct I was “grasping at straws” and assuming that we will see a similar downward spike similar to what happened after the 1998 el nino.
We shall see.
G
” If so, some experts will be forced to eat their words.”
Experts on the “right side of history” are never asked to eat their words, because a majority of the media have no memory, and even less understanding.
Kevin, No the experts just heard their budgets might get cut and are running over to Trump’s corner! Follow the money!
Kevin, They just heard their budgets are going to get cut and are now after the “new” money, Trump’s
kevin the experts are not changing the story and eating their words. They know the funding is going to be cut so they are looking for a different backer, ie Trump.
Squirrel!
+1
Interestingly I have seen two GW skeptic stories, including this one, in the UK MSM in the last week. Perhaps we are starting to see some sense.
Peter,
We may be “starting to see some sense” – but don’t hold your breath.
Various organs – even the (once-)non-establishment ‘Private Eye’, have been discombobulated by Brexit – and The Donald!
Various efforts in Europe – Austrian re-run; the Swiss vote not to revert to the Bronze Age; the Italian constitutional referendum; and next year, elections in Germany and France may bolster the feeling.
Let us hope for outcomes that help most folk.
If one or two are Vampire Squid bankers – well, as long as most folk get helped, I can live with a billionaire not having to cadge cigarette butts.
Auto
Not a client of Goldman Sachs – the eponymous squiddly niddly.
It’s not the squids that did it, it was that Alien Septapus. But It’s just hollyweird preaching to us again.
G
One of my local Television stations has started to use the term “Energy Poverty” on-air; They had years ago removed a meteorologist from on-air weather and science reporting shortly after he had audaciously described the Climate Change debate in a neutral voice. So it does seem to me that there is subtle shift in the Main Stream Media’s leaning on the issue.
“…Dr Schmidt had not returned a request for comment.”
Not surprising since the guy has a history running away from debate. Hubris and elitism are not the best tools a scientist can use to make a case. How this has worked for Schmidt for so long is troubling.
Perhaps Gavin Schmidt was too busy cranking up the adjustment machinery to answer the request for a comment?
Some crank and some are just cranky.
That’s what I call mann-made global warming; however in this case it’s schmidt-made global warming.
He might also be on the hunt for another job as his time at NASA is short.
Dangerous Schmidt warming?
I guess as an old coot I just don’t know Schmidt.
They can’t explain away the hiatus, so the must make it disappear or call it something that better matches the meme.
Alx November 28, 2016 at 8:23 am
& all others in this chain. Note the second paragraph from the article . Nasa Website. Someone(s) Just stabbed Dr Schmidt in the back. Not with a mere knife mind you, but with a Macedonian Sarissa.
He is probably over turning desks in rampaging hunt for fellow who posted the New study on the website.
“Dr Schmidt also denied that there was any ‘pause’ or ‘hiatus’ in global warming between the 1998 and 2015 El Ninos.
But on its website home page yesterday, Nasa featured a new study which said there was a hiatus in global warming before the recent El Nino, and discussed why this was so. Last night Dr Schmidt had not returned a request for comment.”
I do not know the motive for the individual who placed the study on the website but this is going to cause a stir.
michael
Until I see an actual LINK for ” on its website home page yesterday, Nasa featured a new study” , I’m doubting.
Why wouldn’t the person writing this post the link?
Styopa November 28, 2016 at 12:35 pm
Okay I did not check, So why are you doubting?
Either the Author David Rose is writing fake news and I am a fool. Or it is real.
michael
The NASA article appears to be:
https://www.nasa.gov/feature/jpl/study-sheds-new-insights-into-global-warming-trends
It does seem to acknowledge a hiatus, but also discusses accumulation of heat in oceans.
bsl November 28, 2016 at 4:35 pm
Thanks bsl. Still to many people at NASA & JPL not doing what they are tasked with.
michael
“Dr Schmidt also denied that there was any ‘pause’ or ‘hiatus’ in global warming between the 1998 and 2015 El Ninos.
But on its website home page yesterday, Nasa featured a new study which said there was a hiatus in global warming before the recent El Nino, and discussed why this was so. “
As usual, Rose gives no sources, and seems to be mixing stuff up. I think the first probably originates with Mann, not Schmidt, who is, among other things, co-author of the paper: Sensitivity to factors underlying the hiatus.
But as for the unsourced NASA paper, no, it does not say there was a hiatus. They are explicit on terminology:
‘To begin, they suggest the climate community replace the term “global warming hiatus” with “global surface warming slowdown” to eliminate confusion.
“This terminology more accurately describes the slowdown in global mean surface temperature rise in the late 20th century,” Yan said.’
When I lived in St Louis (county), the second question people asked me was: “Izzat dt or two t’s ??
Well it’s th actually.
G
Here is the abstract of the paper:
http://onlinelibrary.wiley.com/doi/10.1002/2016EF000417/abstract
There’s no stopping The Pause
Except perhaps the decline.
NOAA/GISS can manage it !!
Here is how. 2001 – 2015.6 (between the El Ninos) with trends taken back to same starting point in 2001.
So it’s all those villainous GISS adjustments?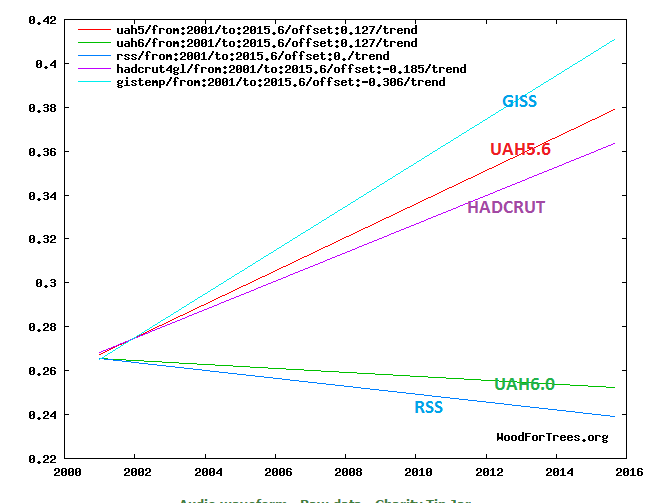
Here’s the same plot, with UAH5.6 still available:
Yes Nick. UAH found a KNOWN error due to satellite shift, and corrected it.
Its called SCIENCE and ENGINEERING.. learn some sometime.
You have NOTHING. !!
I find it revealing that the alarmists, who supposedly fight against global warming, actually deny the existence of the Pause. You’d think they’d be happy about 18 years of essentially flat temperatures. But instead they always seemed so pleased and relieved to proclaim that 2015 and 2016 were the warmest years on record, at times almost triumphant.
Counter intuitively they’ll likely be unhappy to hear that the Pause has returned and could be 20 years in duration now.
Ahh Klem,
But you see, if the temperatures remained flat for 18 years while CO2 monotonously climbed, there is a problem supporting the theory and without the theory, they have no jobs, no prestige, and no grant money to spend. They MUST prevent a pause at all costs – their whole way of life depends on it!
Stunning new data indicates El Nino………..and the AMO………. drove record highs in global temperatures
Can’t figure out why everyone ignores the other ocean…that goes directly into the Arctic
There you are again, with the AMO. Keep it up. Maybe we’ll catch on.
That explains much of the elevated Arctic sea and air temps this season.
The recently departed El Niño takes care of the rest.
(afaics)
should have known Bob would have it…
I would say those two graphs seem to show a definite correlation. The light grey one seems to track the darker line.
G
Actually it would be a perfect fit….if they didn’t do this (borrowed from Marcus)
http://realclimatescience.com/wp-content/uploads/2016/01/2016-01-14-04-18-24.png
http://www.drroyspencer.com/library/pics/PDO-index-since-1900.jpg
All of this was predicted in WUWT several years ago The strong El Nino raising global temperatures can in no way be interpreted as AGW by CO2, because if it was, then temperatures would continue to rise during the La Nina phase. The so called “scientists” have shot themselves in both feet this time.
Gavin is likely to be out of US govt employ in 2 years when the US govt FY2018 budget zeros the funding appropriation for GISS. And then the global temps will fall and “manmade GW” will be at an end.
Nothing to stop GISS being shut down once Congress acts. Budgeted money isn’t set in stone until it is ‘expensed’ or actually and contractually obligated and spent.
Unless Senate Republicans put a final stake in the heart of the filibuster, getting legislation to reorganize NASA (eliminating any GISS climate work) to President Trump’s desk would first have to clear a senate democrat filibuster. GISS is in Manhattan and works with Columbia University. Senator Schumer (D-NY, senate minority leader) would filibuster any legislation that eliminates GISS and its jobs and funding to ColU.
Appropriations bills though can avoid the filibuster, and thus simply defunding GISS would the politically expedient method of eliminating politicized climate science work by redundant agencies such as GISS.
As far as I can see GISS isn’t a line item. That would mean it exists at the whim of the Administration.
Trump’s NASA administrator could redirect GISS back to its original charter of basic space science theoretical work. That would entail political risk drawing the wrath of Congressional democrats. Such a re-alignment would result in a major staff upheaval as the academic disciplines of atmospheric climate research are vastly different from academics who study space plasma, solar wind manetosphere interactions, and gavitational interactions between planets and the sun. Plus there are (NASA and NSF) grant tie-ins to Columbia researcers.
GISS in its current state is like an invasive, soft tissue tumor that has wrapped and interwoven itself into Columbia U atmospheric Earth Sciences and the climate modeling community. Simply telling a large group of climate-atmspheric scientists to become space plasma physicists simply doesn’t work. And the best way to unpoliticize NASA administration to to get the politics out of NASA administration. Leave the politics to Congress.
The best option is for Congress to specifically forbid NASA to use appropriated funds for Earh Climate research and redirect any non-redundant work funding to NOAA.
NASA, GISS and possibly all of the department subsections would operate their budgets under finance numbers.
As JoelOBryan points out, the agencies are at the beck and call of the President; as is their organization and expenditures.
Political noise? Perhaps.
But only noise. Outside of refusing to authorize funds, Congress and especially the Senate has little say in the running of an agency so long as they operate legally.
I’d like to see those Democrat Senator yahoos pull another climate blindside using false experts without GISS and NOAA backing.
Almost as much as hearing those Senator benefactors scream when the green massacre mills lose their subsidies, fixed high prices, publicize how much rare wildlife they kill and have to pony up for grid improvements.
I think most of us wouldn’t oppose transitioning GISS from NASA to NOAA. I’d strongly approve of moving it from Manhattan (some of the most expensive commercial real estate in the world) to a location that is more “sustainable”. There’s another Columbia I can think of that would be quite appropriate – in SC.
Alaska.
Maybe a bit further south would be best. There is a Latin American country w/ a great exchange rate.
Miami has some real estate where the ocean waters frequently visit and have visited for decades.
Then again, NOAA/GISS allegedly has some major computer power that should be moved to very stable landscape; e.g. Northern Minnesota or South Texas.
I lean toward Texas; Texans are such friendly outgoing people, (Honest!).
The Antarctic! Obviously.
Move them into the now closed incandescent lamp manufacturing plant and garnish their wages to help pay the unemployment for the folks that used to work there.
I don’t have a problem with the closed incandescent lamp factory, so long as its demise was a result of free market forces. Nobody should be forced to make buggy whips, just to provide employment for people who know how to make them.
I’ve never bought a buggy whip; never even seen one actually. But I have already purchased the last incandescent lamp I will ever own.
But I did have to wait for a full half century to pass, since I was one of a few, who jokingly declared: ” One day, we will be lighting the whole world with these things. ”
We were in a darkened auditorium at Monsanto Company’s Central Research Labs, in St Louis (county) MO, looking at the dull red glow of a small section of GaAs0.6P0.4 wafer under an assembly binocular microscope. We also joked that if we knew the name of a company investing in GaN technology, we could make a killing by selling its stock short.
But that was long before Shoji Nakamura came on the scene at Nichia in Japan.
G
This is stage one of the cooling more to follow.
The 1998 El Nino reminded me of a step function with an overshoot, an undershoot, and then settling. It depends on which temperature set you look at and how it is smoothed.
In 2010, Willis speculated that we might be looking at something like feedback control system behaviour. link It’s a very attractive idea. I’m curious to see how this El Nino turns out.
The 98 EN was followed by the 99-00 LA. That LA (an upwelling of colder than normal waters in the East Trop Pac) coincided with the rapidly rising solar activity to the SC23 peak in 01. So if the 98 EN was an impulse, the following solar activity drove was the steprise.
SC24 is now on a 3 to 4 year disciplined decline to minimum somewhere likely in late 2020 or 2012. Any LA that persists in this decade could see a stepdown in global temps and a final relaxation of the climate system back to conditions approaching 1975 state by 2022.
LN, not LA . Not sure where that came from. Duh!!
That should put the stake in the heart of CAGW.
I assume EN is not short for ENSO. I assume EN is short for El Niño, it’s a short term, just type it (with ñ for ñ or copy ‘n paste. Here’s LA: La Niña
Pls dnt u go ovrbrd w abbrs.
Well the essay you linked to is one person’s opinion.
A feedback response that overshoots, is just one option available to process control designers.
What happens if that overshoot that is claimed to be necessary, leads to a functional failure; the governor gizmo snaps in half ??
” Settling time ” is commonly spoken of, when talking about a system returning to a ” set point “; and virtually any feedback system has a set point that it is trying to return to.
And there is no assurance that settling time is reduced by overshoots. A monotonic non overshooting response can settle faster that one that overshoots. It’s a question of design.
It is true, that the system can be made to return to the set point faster, if overshoots are permitted. That is NO assurance that the system will REMAIN within an acceptable error band sooner, and that is the measure of control success. How fast can you return and remain within an acceptable error from the set point.
Propagation delays certainly make it harder to avoid oscillations about the set point. They don’t necessarily make it impossible to achieve monotonic response.
” the rate of global warming has been much slower than predicted by computer models – about 1C per century”
anthropogenic or natural 1 C rise, or both?
…or adjusted
I don’t think the models acknowledge any natural warming.
As I’ve been told by several warmists, since all natural cycles are cycle, over time the average out so they don’t have to be considered by the models.
Of course when the tuning period is a time of upswing in 3 to 4 of the natural cycles, that can’t possibly have any impact on the “projections”.
Actually Kasoka and Xie claim to be making progress at separating out natural and global warming.
http://oceanbites.org/the-pacific-pacemaker-using-models-to-explain-warming-hiatus/
Their hypothesis is PDO (including El Niño / La Niña) is natural, so they run constrained models with actual data for the western pacific. There hyposthesis is they they can then separate out the 2 effects. In the 1910-1940 global warming, they give PDO almost full credit, etc.
It’s important work, assuming they are on the right track.
You can see in the swings of min and max, the warming can not me from a loss of cooling. Period. What it looks like they are, are the ocean cycles driving changes to the jet stream, which alters the path warm water vapor out of the tropics take, when more of it goes over land, it’s warmer even though the total heat content didn’t change.
Nooooo! This is disasterous, what about all those poor Polar Bears – the ice will be too thick for them to break through.. We must increase emissions so that we can save the Polar Bears…
Those wily polar bears don’t have to break through the ice. The seals maintain their own breathing holes. The bear just has to wait beside a hole until the seal sticks its nose above the water to deftly remove the seal. What an easy life. 🙂 It’s practically like lying under a tree with your mouth open waiting for the fruit to drop.
The polar bears will soon have a new, protein-rich food source, as outlined in my recent post on another thread. And if this thing is half as big as I think it just might be, those bears will be eating like kings: https://wattsupwiththat.com/2016/11/27/five-stages-of-climate-grief/comment-page-1/#comment-2354336
You’re actually kinda close with the mention of too- thick ice being bad for the bears.
Susan Crockford has explained how thick Spring ice is bad for the seals, who can’t haul out of the sea to deliver their pups.
Thick ice = seal population decline = hungry bears wandering around looking for nice fat field techs and lean mean derrick hands.
The models don’t actually acknowledge anything natural, like a rotating planet that is illuminated 24/7 at about 1662 Wm^-2.
G
The article is a little out of date, since the La Nina event is already looking like an ENSO neutral state. Who knows what 2017 will bring, but there are no signs get than an El Nino will take hold to make it warmer than 2016, so saying a temperature drop is coming would be a safe bet.
Let’s chat in 15 years about trend 🙂
I don’t like skeptics using incomplete data like this. If this was a similar alarmist post, we would be all over them for cherry-picking.
Blaming AGW and especially CO2 is suppose to show up more over land, so I presume that’s why this has been chosen. If the rise over land is shown to be lost, then therefore there is no way it was caused by AGW in the first place. Hence, backs up what I and others have mentioned before about it being caused by El Nino’s.
i suspect that it is more to do with response time.
The large heat capacity of the oceans creates a buffer such that it takes longer to recognise change, and of course, it also impacts upon the extent of change. there is a great eal more energy entrained in the oceans than in the atmosphere.
Jeff, SST measures WATER temperatures. Land measurements are for AIR temperatures. A composite of the two (scientific nonsense) gives no information as to underlying physical processes.
Atmospheric teleconnections provide quick responses across the globe to ENSO related equatorial sea surface temperature variations. Global average SST varies more slowly through ocean currents and lagged response to atmospheric variations (air pressure, wind, temperature, etc.).
La Nina conditions shove leftover El Nino-warmed surface waters north and south into higher latitude Pacific waters and westward into the Indian Ocean. Those warm waters intruding into other ocean basins are a lagged response to El Nino warming.
Read some Bob Tisdale: https://bobtisdale.wordpress.com/
Actually, john Christy et al showed that oceanic air Temperatures and oceanic water Temperatures aren’t correlated, so no they do not follow each other in a cause and effect manner.
The air over Hawaiian waters today, will be over California in a few days. Why would the air and ocean temperatures ever be the same.
Even the ocean temperatures themselves (water) don’t stay the same. It’s called “meandering”. All rivers do it.
G
George,
Indeed. This is the reference for others to check:
GEOPHYSICAL RESEARCH LETTERS, VOL. 28, NO. 1, PAGES 183-186, JANUARY 1,2001
Good point, well taken.
Let alone the vitriol against anything issued by nasa.
When you are caught lying, it diminishes trust.
Especially when that lying is costing us money.
It would be nice to see the anomaly dip below that -0.2 line.
With no adjustments, we might see the pause solidly confirmed, or the oh-oh, maybe it is cooling ?
Cooling is bad for people.
Especially Warmists.
“Algor mortis (Latin: algor—coldness; mortis—of death), the second stage of death, is the change in body temperature post mortem, until the ambient temperature is matched.”
https://en.wikipedia.org/wiki/Algor_mortis
No, its just the coverage bias of RSS in Antartica, UAH has not fallen as strong as RSS, if you see RSS in TTT you will see the decrease is smaller.
And..
Its not because of transition from El-Nino to La-Nina, its because of strong continental cooling caused by extrem early WACCy-Pattern. And so its no wonder, the coming month should more cooler as its in Oktober for RSS TLT.
Its so simple, why make it always a great story? So desperate?
WACC = Weighted average cost of capital
Or what?
Warm Arctic cold Contients and y = crazyness
The question I would be interested in seeing an answer to is when, reasonably speaking, can we claim accuracy in measuring El Niño events . My reason for being interested in this is the El Niño events in the late nineteenth century and in particular the 1876-79 one which killed tens of millions and caused catastrophic droughts – lasting three years in some places – throughout the mid-latitudes.
I see nothing in the run of modern El Ninos that remotely matches the descriptions of what was going on in the 1870s, even allowing for our ability to moderate the worst effects of such events in terms of aid to famine areas.
I would think this question has some importance in reference to the narrative of “unprecedented” weather or climate claims in “modern” times. Unless it is going to be claimed that time works differently once you go back further than 25 years.
The satellite sea surface temperature data is only about 30 to 40 years old and vastly better than anything else we have had. Whale the limited climate data for the 1870’s may indicate a a 3 warming trend we cannot say for sure that was a el Nino. We also don’t precisely know how long it lasted. Or it may have been like the 90’s and 2015 when see surface temperatures were elevated for year or more before a large El Nino occurred.
China and India also now have more water storage facilities, more acreage cultivated and higher crop yields and varieties, as well as improved national and international relief organization. This despite larger populations.
Moderately Cross of East Anglia on November 28, 2016 at 9:03 am
The question I would be interested in seeing an answer to is when, reasonably speaking, can we claim accuracy in measuring El Niño events . My reason for being interested in this is the El Niño events in the late nineteenth century and in particular the 1876-79 one which killed tens of millions and caused catastrophic droughts – lasting three years in some places – throughout the mid-latitudes.
You are right! This edition in 1877/78 had terrific consequences, mostly located in the Southern Hemisphere if I well remember what I read some years ago.
You can compare these ENSO episodes by looking at
– the Historic MEI (Multivariate ENSO INDEX) record:
http://www.esrl.noaa.gov/psd/enso/mei.ext/
– surface temperature records:
— HadCRUT4.5
http://www.metoffice.gov.uk/hadobs/hadcrut4/data/current/time_series/HadCRUT.4.5.0.0.monthly_ns_avg.txt
— BEST
http://berkeleyearth.lbl.gov/auto/Global/Land_and_Ocean_complete.txt
Accuracy is quite a relative matter! By comparing all the data presented here, you see that the series have a pretty good match, but it tells you nothing about what really happened 🙁
Thanks Bindidon for the links, lots of interesting reading for me then!
I’ve been saying for what 10 years, the warming is not from co2, it can’t been because of how fast the entire world can cool at once. It had a prelude to this in the 97 El Nino cycle, that you can’t see because they show you average temperature.


sample rate >359/year 53 million records
Same sampling rate, 1980 to 2015 44 million samples
Sample rate >364/year 29 million sample
And all of the warming was in the northern hemisphere, so this is a good representation of the best temp data for an are on the planet.
What satellite dataset is shown in the graph in this article?
I was wondering that myself.
The dataset used is RSS v3.3 TLT which was not updated when RSS moved to V4.0.
The dataset used is for LAND only, and you may just have noticed that the NH (by far the biggest land area of the hemispheres) is decending rapidly into winter. Go look at Siberian temps, oh, and go look at Arctic ones.
Exactly.
http://www.remss.com
Quote: “The lower tropospheric (TLT) temperatures have not yet been updated at this time and remain V3.3. The V3.3 TLT data suffer from the same problems with the adjustment for drifting measurement times that led us to update the TMT dataset. V3.3 TLT data should be used with caution.”
Oh, and this is what RSS TTT v4.0 (Global 82.5S to 82.5N)
Note the perfect linear fit one could hang oneself on. I just expect for warrants I could buy.
These temperatures are anomalies. Why should it matter if we are “descending rapidly into winter”?
See Nick Stokes post below:
Some extra detail.
Basically extreme Siberian temps.
This is the fastest and deepest drop in temperature in the whole satellite data.
Get over it !
Well this graph is a fake.
Just what is the likelihood that somebody could possibly sample a band limited continuous function and find that every maximum and minimum falls exactly on one of the sampled points.
The graph plotted above is NOT a band limited continuous function so you cannot believe ANYTHING that is calculated from ANY finite set of samples; no matter how large that set of samples is.
Total BS graph.
G
David Rose writes: “The satellite measurements over land respond quickly to El Nino and La Nina. Temperatures over the sea are also falling, but not as fast, because the sea retains heat for longer.”
Also, a La Nina is not the opposite of an El Nino. An El Nino releases warm water from beneath the surface of the western tropical Pacific and places that warm water on the surface. A La Nina recharges the heat lost from below the surface of the tropical Pacific by decreasing cloud cover and allowing more sunlight to warm the tropical Pacific to depth.
I’ve always thought of it as a cycle. Relaxation or reversal of Trade Winds allowing the higher temp W Pac water to travel to the E Pac. The now lowered temp W Pac water produces less clouds allowing more sunlight to raise the water temp to depth of about 100m. Now what causes the change in Trade Winds?
“Now what causes the change in Trade Winds?”
Perhaps the change in ocean surface temperature that inevitably accompanies warming “to depth”. Not enough surface warming to create the towering ninoesque sun blocking convection. Maybe not enough to even show as anomaly, but enough to foster robust Hadley circulation that drives the trades.
The trades in turn skim off the warming surface water (keeping it from getting out of hand) and pile it up against Indonesia to some depth where it cannot radiate efficiently to the atmosphere.
This can’t go on forever so when the pesky QBO does an about face at just the wrong moment and disrupts the Hadley cells, all that piled up hot water at Indonesia does an exit stage right…
Credit Paul Pukite
More detailed plot here:
http://images.remss.com/msu/msu_time_series.html
The graph does not match the one shown….
Could be. It was toneb, after all, making a point on his set being better than the shown set.
“Could be. It was toneb, after all, making a point on his set being better than the shown set.”
No just showing the thing that makes Rose’s *article* complete nonsense.
“Some scientists, including Dr Gavin Schmidt, head of Nasa’s climate division, have claimed that the recent highs were mainly the result of long-term global warming.
Others have argued that the records were caused by El Nino, a complex natural phenomenon that takes place every few years, and has nothing to do with greenhouse gas emissions by humans.”
Really, who are these scientists who argue El Nino is is the cause of these records? Even Judith Curry (a skeptical scientist) only says the warming is “primarily” caused by El Nino. I think you will find she is a lone wolf among scientists. I’d been keen to hear the names of others work in the field who do not attribute the recent records to long term warming caused by increased greenhouse gases. i.e what Dr Schmidt is saying.
Here is a logical question that demolishes any notion that El Nino is responsible for warming. If it is, why has this event, that has been happening for (at least) thousands of years, not meant we are hotter than we are?
Yada yada primarily peak alarmism.
Hugs
So … ummm … that is your best answer?
Simon November 28, 2016 at 9:54 am
“Hugs
So … ummm … that is your best answer?”
It properly put your statements into a appropriate context Personalty I prefer the more effective “Blah,blah blah,”
michael
Mike the Morlock
“I prefer the more effective “Blah,blah blah…..”
Highly intelligent response thank you. Now perhaps for the thinking ones here you might want to say which aspects of what I wrote are so incorrect. Or perhaps Blah….. is all you have?
WIBBLE…
Simon, how did you turn a claim that the “recent highs” and “records” were caused by El Nino into an imaginary claim that El Nino is “responsible for [long-term global] warming”.
Absent an El Nino, let alone an extremely strong one, what do you think the chances are that 2015 and 2016 would have been record-setting based solely on “the long term warming trend”?
“Absent an El Nino, let alone an extremely strong one, what do you think the chances are that 2015 and 2016 would have been record-setting based solely on “the long term warming trend”?
Good question….. I’d be betting on it.
I should say, as long as you take out the other El Nino’s. I think 2016 would be guaranteed warmest.
Then you would have lost that bet. We have a fairly good idea from measuring past El Nino and La Nina and the changes in Global Temperature that coincide with them how much they can effect. Without the 2015-2016 El Nino Global Temperature would not have reached a record point.
El Nino caused the record high, just as this La Nina will cause the following low. Once they are over and Global temp stabilizes (to the extent it ever does) then we will know if it will include a step change like 1998 did, or if it will go back to the pause, or even show a step down to pre 2000 temperatures.
By about 2018 we should know. And by 2020 (the next US presidential election) unless we see a SIGNIFICANT increase in Global Temperature (a real one, not just more adjustments) the ‘Climate Change’ movement will be doomed. Even the Liberal/Progressive/Socialist movement may have trouble weathering such an absolute failure.
schitzree
“El Nino caused the record high, just as this La Nina will cause the following low. Once they are over and Global temp stabilizes (to the extent it ever does) then we will know if it will include a step change like 1998 did, or if it will go back to the pause, or even show a step down to pre 2000 temperatures.”
El Nino is no more the cause of a record high than a wave is on record sea level rise. It is just short term noise. And sorry we arn’t going back to pre 2000 temps for quite some time.
Well simon, that really depends on how you’re measuring ‘record high’ temperature. In the grand scheme of things you’re right El Nino is a passing ‘wave’ in the temperature record. That’s why I said we need to wait till it and the following La Nina have passed to see what the actual global temperature is.
It is in fact the Climate Faithful with their ‘warmest year ever’ nonsense that are trying to use the peak of the ‘wave’ to claim a trend that isn’t really there. And it looks pretty silly considering that the wave has already past and global temps are already back to where they were during the ‘pause’.
In about a year or two we will have a better idea where the Global Temperature is. And as for whether we are going back to pre 2000 temps, we’ll see won’t we. I personally only give it about 25% odds. On the gripping hand I only give more moderate warming 15% odds, and ‘catastrophic’ warming (which we’d need to come anywhere near the Climate Faithful’s >2°C this Century predictions) at less the 5%.
With the Faithful having bet all their political capital, their reputations, and even their honor on that catastrophe it isn’t looking good for them.
lol, hindmost the escape ship is ready
schitzree
It is in fact the Climate Faithful with their ‘warmest year ever’ nonsense that are trying to use the peak of the ‘wave’ to claim a trend that isn’t really there. And it looks pretty silly considering that the wave has already past and global temps are already back to where they were during the ‘pause’.”
Sorry but that last bit is just not true (nor is much of what you say for that matter). Nick Stokes blog has latest numbers and we are still well above pause numbers. Take a look….
https://moyhu.blogspot.co.nz/p/latest-ice-and-temperature-data.html#NCAR
Or perhaps you prefer the most conservative of all metrics UAH. Even that shows we are well above where the so called pause had us. In fact I doubt you will find a data set that says you are right.
http://www.drroyspencer.com/latest-global-temperatures/
“Then you would have lost that bet.” I don’t think so. If you take out the past El Nino’s as well as the recent one we are hotter than ever.
Can you indicate where you think the data is that supports your statement that if we correct for short term El Nino effects then previous years were hotter? That means you cannot point to 1998 temperatures because they include the short term El Nino effects.
Simon, if we were measuring the sea rise based on the top of each wave, then a big wave would be analogous to an El Nino.
PS, that is exactly what you are trying to do.
Simon,
“Here is a logical question that demolishes any notion that El Nino is responsible for warming. If it is, why has this event, that has been happening for (at least) thousands of years, not meant we are hotter than we are?”
Because “warming” is not a permanent state.
Vast amounts of energy are constantly leaving the Earth, departing into the big black deep freeze we call space, never to return. “Warming” is just a temporary reduction in the average rate of energy departure.
(Just the word ‘constantly’ was supposed to be bolded . . )
“Vast amounts of energy are constantly leaving the Earth, departing into the big black deep freeze we call space, never to return. “Warming” is just a temporary reduction in the average rate of energy departure.”
And your point it?
There hasn’t been a reduction in night time cooling, and by default warmer radiates more energy than colder.
It’s an answer to your question . . We are not hotter than we are ; ) because “this event” and others like it are just transient irregularities in the departure of the energy from the sun that impacted the earth on it’s way into the big black . .
Sure, micro, but first it’s got to be warmer, then more energy radiates into space. “Warming” indicates a reduction in radiation departure has occurred, therefore.
I think it’s fair to say that there’s been long term warming, upon which this El Nino builds, to create new record highs. So in some sense it’s both. The warming trend of the last 50 years ago most likely includes some level of warming based on GHG emissions, probably in the range of the 1C per doubling that the radiative physics predicts. On top of that there is warming due to ENSO, and the PDO and AMO. So the last El Nino builds on some GHG warming that’s already raised the base to a higher level, which is why we get a higher level El Nino that breaks records. Most skeptics wouldn’t argue this point. Long term, skeptics also predict higher levels of basic warming, just not at the rate alarmists predict. So it’s not inconsistent with the skeptical position for there to be new records made, and warmer and warmer years . But because natural warming and cooling cycles can easily override these trends, even for long periods of time, it’s incorrect to attribute the bulk of the warming in any El NIno to GHG forcing. Even the base warming is often the result of long term natural cycles. And so that base can fall as well. We’ll see, of course.
The world has not been warming for 50 years. It is warmer now than 50 years ago, but the pronounced, more than 30-year postwar cooling trend didn’t end until 1977, when the PDO shifted.
There is however an over 300 year-long warming tend since the depths of the Little Ice Age Cold Period during the Maunder Minimum in the late 17th century, or since the exceptionally frigid winter 1708-09. But human activity has little to do with the natural cycles of centennial-scale warming and cooling.
Simon first argues with the fallacy of aithority as if CO2 warming is a popularity contest. The real question is how do alarmists know recent warming was due to rising CO2. Their belief is based on model results that can not replicate recent warming with their model of natural climate change, and can only simulate rising temperatures by adding heat associated with CO2. The problem is they assume their models have accurately and reliably simulated natural climate change. However those models repeatedly failed to accurately back cast the warming of the 20s to 40s. Their models underestimated the loss of Arctic sea ice and overestimate a loss of Antarctic sea ice. The argument that most scientists believe CO2 is the major contributor to recent warmth, is simply a matter of faith in a hypothesis that has driven failed models.
Simon then provided a great belly laugh saying his “logical question that demolishes any notion that El Nino is responsible for warming. If it is, why has this event, that has been happening for (at least) thousands of years, not meant we are hotter than we are?”
Simon appears clueless that the ocean stores and releases heat on timescales of days to millennia. Its quite silly to suggest the El Nino effect creates endless warming, EN just help release heat that has been stored for decades. The upper 10 feet of the ocean store more heat than the entire atmosphere, and any ocean ventilation raises air temperatures. In addition to EN ventilation the loss if insulating ice cover has allowed heat to ventilate from the Arctic Ocean, driving global averages upward. According to premiere Harvard and MIT oceanographers, heat stored during the warmth of the Holocene Optimum is still ventilating from the deep oceans. http://landscapesandcycles.net/cooling-deep-oceans.html
” Its quite silly to suggest the El Nino effect creates endless warming,” Indeed, yet this is the conclusion of some who post here -that El Nino causes the jumps in temperature.
Silly me, I guess big bump in temperature last year and the one in 1998, had nothing to do with the El Nino’s that occurred in those yeares.
seaice, you misconstrue my word. El Nino definitely creates large jumps in global temperature. Only an alarmist would deny those facts.
El Ninos are simply phenomena that ventilates heat that was stored at depths in the ocean where it did not affect air temperature. The issue is how much heat has been stored in the oceans and from what time periods. As our top oceanographers will argue, the oceans have yet to come into equilibrium with the atmosphere and heat stored for millennia is still ventilating.