From San Diego State University and the “say anything to support the cause” department, comes this press release written by a fellow who obviously does not understand what it means when researchers say: “[methane and carbon dioxide release] is highest in the Arctic during the region’s cold season“. Maybe now those alarmists like Paul Beckwith and the always wrong on sea ice expert Peter Wadhams can call off their “Arctic Methane Emergency Group” who say the warming during summer is the biggest problem.
Yet here we are, actual measurements say that methane and CO2 release are contrary to what climate models predict about thawing permafrost releasing methane. Obviously some other mechanism is going on if permafrost is releasing equal or greater amounts of methane during winter as it does during summer..
Last year their press release said:
…found that far more methane is escaping from Arctic tundra during the cold months—when the soil surface is frozen (generally from September through May)—as well as from upland tundra, than prevailing assumptions and climate modelers previously believed. In fact, they found that at least half of the annual methane emissions occur in the cold months, and that drier, upland tundra can be a larger emitter of methane than wet tundra. The finding challenges critical assumptions in current global climate models.
With the new study from Kwon et al. cited in the press release below, Kwon finds the same thing for CO2 release – more in the cold season.
So if half or more of Methane and CO2 release is happening when the ground is frozen, that rather puts the damper on worries that summer warming is going to set off a runaway greenhouse effect, at least that’s how I read it. Yet here with are with that exact title from SDSU’s press release today. It seems to me that their thinking is backwards, as they seem worried that now there is more methane and carbon dioxide release in the winter than they previously knew about, that this just adds to the volume of the alarm, rather than pointing to something being wrong in model assumptions and assumptions about feedback mechanisms.
Runaway Global Warming
SDSU biologist Donatella Zona comments on a startling new finding in climate change research.
By Michael Price
The steady march of global warming over the past century has led to the thawing of permafrost—a layer of subsurface soil in the Arctic that usually remains frozen year-round. While that’s troubling for local ecosystems, it could have disastrous global impacts as well. As this permafrost melts, it sets off a biochemical chain reaction in the soil that could dramatically increase the emission of greenhouse gases into the atmosphere, accelerating further climate change. San Diego State University biologist Donatella Zona wrote about this issue in a commentary article this week in the journal Nature.
In her commentary, she provides expert perspective on recent findings published in the journal Biogeosciences by Min Jung Kwon of the Max Planck Institute for Biogeochemistry in Jena, Germany. Kwon and her team report that the layer of permafrost typically acts as a barrier against moisture drainage in the soil. As this permafrost melts, the moisture drains out, leaving the top layers of the soil drier and warmer. This warming kick-starts a biochemical process within organic matter present in the soil that releases carbon dioxide into the atmosphere. Atmospheric carbon dioxide and other greenhouse gases are leading contributors to warming global temperatures.
“The authors report that the net effect of draining in their study is an increase in the amount of CO2 emitted to the atmosphere, which will ultimately magnify climate change,” Zona wrote in her commentary.
Zona published a study about the effects of drainage in permafrost earlier this year in the journal Nature Geoscience. Additionally, she and fellow SDSU ecologist Walt Oechel, along with colleagues at several other institutions, published another study last year showing that the emission of methane, another greenhouse gas, is highest in the Arctic during the region’s cold season. That was surprising, as most scientists thought little if any greenhouse gases escaped the frozen soil during the cold season.
Sure enough, Kwon’s recent study shows a similar trend for carbon dioxide.
“Importantly, Kwon and colleagues show the increase is highest during the cold season, a notoriously under-studied part of the year in tundra ecosystems,” Zona wrote.
More data is needed to better understand the long-term implications of these findings on larger climate change patterns, Zona said. But that’s difficult, as funding for such studies is scarce.
“Unfortunately, given the costs of doing research in this region, funding agencies tend to support projects of only 3–5 years—hardly long enough to provide even a first glimpse of the impact of climate change,” she wrote. “Long-term studies would be possible only through a collaboration of research groups, with several funding agencies sharing the financial burden.”
Simple solution…
Open the area for Oil Exploration and require the drilling entities to fund the research to gain their drilling leases
Not a good idea. Anything that they found not supporting scary scenarios would be discarded ad “corrupted by big oil funding” without even looking at it.
Arctic CO2 variation is quite similar to the ice extent. Work that out.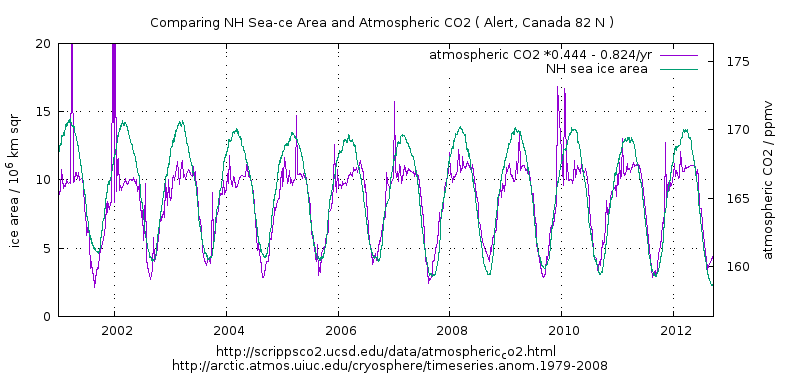
Cold water absorbs CO2 ( and other gases ) since surface water flows into the Arctic from lower latitudes where it was warmer and thus held less gas. In warmer part of the year there is a lot more exposed water and this drags down the atmospheric CO2 level.
The thermohaline cycle then sinks the surface water sequestering the CO2 into the deep ocean currents.
The boreal forest also eats up CO2 while it is receiving daylight.
Well maybe they are misinterpreting the changes as “emissions” because the whole of climatology has an emissions obsession. Perhaps what they observe is not increased emissions, but lesser absorption.
Perhaps what they observe is not increased emissions, but lesser absorption. …
……..yes
Greg
Great observation. The CO2 curve and the sea ice curve are effectively controlled by the same factors, atmospheric transport.
Are your conclusions about CO2 being sequestered into the Arctic ocean based on the flat peak on the CO2 curve covering the months December through April. If so they are incorrect. Only a small amount of CO2 is adsorbed into the oceans during this period. Bear in mind that the flat period is during the NH peak winter emissions (90% of all emissions are NH and about 40% over these months).
The flat top of the curve is identifying the atmospheric transport into into the Arctic region. The Alert station is only reading what is in the passing wind. We have never seen a true accumulation of CO2 in the mid to high NH latitudes during winter. There is not enough atmospheric capacity to adsorb it due to the cold atmosphere and low tropopause ceiling (simple terminology). If the atmospheric canopy was higher and the temperature higher you would see at least another 20 to 30 ppm at peak. The atmosphere is heading to the low pressure in the Arctic region, it also flows southward to the equator up welling. You well see the NH CO2 swelling into the low SH latitudes and being recorded over these months.
It is this transport of atmosphere that controls the sea ice area maximum. There is also a direct correlation between the start of the reduction of CO2 values and the spring rise in the tropopause that provides an increase of air circulation reducing the CO2 values. The rapid CO2 reduction is not witness to uptake by sinks (generic) it is atmospheric dilution.
The carbon cycle and the interpretation of the surface CO2 stations and what they are actually reading is very poorly understood.
Thanks.
Well that is in agreement with what I wrote. Ice max is in March, ocean is mostly frozen over from Dec to April or May, when we see the CO2 graph is almost flat. As you say only a small amount is absorbed in that period.
Greg
Most of the CO2 emissions from the NH end up in the SH as part of a transport starting in May. This is clearly evident in the OCO-2 satellite images.
For a detailed overview of the real carbon cycle see link to my site below. At altitudes of 80km and 90km the decade CO2 increases are inline with Mauna Loa at 5%, how ever over 100km they increase to >12%. No one mentions this as they don’t have an answer as to how it gets there. There is a simple reason, and the head post confirms my conclusions of the transport of CO2 into the Arctic vortex during winter months. Have fun.
http://www.blozonehole.com/blozone-hole-theory/blozone-hole-theory/carbon-cycle-using-nasa-oco-2-satellite-images
@ur momisugly latitude: Exactly my first thought. No growth in the winter no absorption.
That is both true and a real shame.
It simply confirms that state funded science is the only game in town while dismissing the massive resources of those who live at the real coal face.
@ur momisugly Greg – September 30, 2016 at 5:20 pm
Greg, if one uses their “common sense” it is quite easy to reason (work) out.
If the sea ice is increased or increasing in the Arctic (North Pole) ….. then the sea ice is decreased or decreasing in the Antarctic (South Pole). An dvice-versa.
And Greg, the literal fact is, the above graph that you cited is utterly FUBAR ….. simply because it displays the min/max extent of the “Northern Hemisphere’s sea ice area” ….. but is overlaid with the min/max extent of the “Southern Hemisphere’s CO2 ppm ingassing/outgassing quantities”.
If the NH ocean surface area was equal to the SH ocean surface area ….. then there would not be any bi-yearly (seasonal) cycling of atmospheric CO2 ppm …. and the above cited graph would pretty much be “flatlined”.
Atmospheric CO2 is ingassed into cool or cold “surface-ice free” ocean water …. and ….. atmospheric CO2 is outgassed from warm or hot “surface-ice free” ocean water.
Sayith: ozonebust – September 30, 2016 at 6:44 pm
Ozonebust, your claim that “90% of all (CO2) emissions are NH” …… is only true and/or applicable during the NH Spring and Summer seasons, approximately from April thru the end of August.
And ps, Oxonebust, there really is no “NH peak winter (CO2) emissions” that are detectable in the atmospheric or Mauna Loa Record.
Not it is overlaid with what is marked in the legend. If you want to propose something else then prove it , don’t just state it as fact. Warm water does not out-gas, WARMING water will outgas.
You are making sweeping assumptions much of which is incorrect. Look at the Scripps data from SH I’ve posted below. And try to be so strident until you have checked your assumptions.
Greg
Anyone working with fluids (gas, liquids etc) may have a need to understand that they have a saturation limit. This is primarily controlled by temperature. I work with these type of equilibrium’s on a daily basis. The Keeling curves make little sense to anyone with an ounce of knowledge about equilibrium’s. I have never sen a coherent credible interpretation of any of the curves.
Do your own research on saturation points of fluids and liquids. A few key strokes and your there. And while you are on the subject, you should be able to provide an alternative theory of why CO2 is accumulating up through the vertical column out to and past 100km.
Look at the OCO-2 images. Dr Tim Ball recently on the WUWT blog also confirmed that the OCO-2 images refute the IPCC’s version of the carbon cycle.
If you can find an original copy of the carbon cycle you will see Walt Disney’s signature on it.
Samuel
Your comments do not make sense
Greg – October 1, 2016 at 1:32 pm
Of course it is overlaid with the CO2 ppm that is marked in the legend, minus the yearly increases of course, ….. but Getta clue, Greg, the CO2 ppm quantities in the NH and SH are pretty much the same …… but the sea ice extents are just the opposite.
So claimith: Ozonebust – October 1, 2016 at 2:07 pm
Ozonebust, you should have stated …. “makes little sense to anyone with ONLY ‘tunnel vision’ knowledge about equilibrium’s”.
And ps, the Keeling Curve “curves”, as you describe them, are a product of, or the result of, ….. the bi-yearly changing of the Spring and Autumnal equinoxes (seasons) between the Northern Hemisphere and the Southern Hemisphere ….. as defined on this copy of the KC graph, to wit:
Keeling Curve w/equinox lines
http://i1019.photobucket.com/albums/af315/SamC_40/keelingcurve.gif
And Ozonebust, don’t be looking or searching for “equilibriums” in the natural world because they are more scares than Hen’s teeth.
O3bust, there is no such thing as an “OCO-2 image” because CO2 is a colorless gas and one cannot see it or photograph it unless it is frozen or released under extremely high pressure (fire extinguisher).
The above “images” you speak of is most definitely satellite “images” of a frequency of Infrared Radiation that is radiating through the atmosphere …… and which corresponds to the same frequency (see graph below) that a CO2 molecule is capable of absorbing and/or emitting
Just because a satellite detected a specific frequency of IR radiation ….. doesn’t prove that a CO2 molecule radiated it.
O3bust, that doesn‘t surprise me in the least that you would make that claim, ….. but on the contrary, …… it does surprise me that you admitted to the extent of your ignorance in/of both the Biological and Physical Sciences.
Cheers, Sam C, …. AB Degrees in Biological and Physical Science, …. GSC 1963
So it’s another one of those bring money cadges.
Obviously the word is out. ” Climate Science is the latest “Political Science ” alternative or ethnic studies.
You need funding for a full 30 year career so you can retire with a big fat taxpayer funded pension.
I’m used to funding things that pay off this month, or else they just don’t get done at all.
The trouble with such research is that it shows that the private enterprise that makes such studies fundable any way, is what they are trying to eliminate for their own socialist end goals.
It gets tiresome.
G
In their ideological blindness, they seek to kill the geese that lay the golden eggs.
And should they succeed, they’ll have the nerve to act surprised when the money stops coming.
“Over most of Russia, forest advanced to or near the current arctic coastline between 9000 and 7000 yr B.P. and retreated to its present position by between 4000 and 3000 yr B.P. Forest establishment and retreat was roughly synchronous across most of northern Russia.” (…..) During the period of maximum forest extension, the mean July temperatures along the northern coastline of Russia may have been 2.5° to 7.0°C warmer than modern.
(…) the occurrence of large numbers of ancient tree stumps on the tundra of northern Siberia has been known since the reports of A.F. Middendorf in the 1860s.”
Source: https://www.researchgate.net/publication/222513245_Holocene_Treeline_History_and_Climate_Change_Across_Northern_Eurasia
WR: it was that warm earlier in the Holocene that forest advanced to or near the current arctic coastline. You can still find tree stumps in the tundra where it is now to cold for trees to grow. And no disaster happened.
Excellent. Forest ecosystems are great indicators of regional climates.
Eg. https://en.wikipedia.org/wiki/K%C3%B6ppen_climate_classification
The Holocene Climate Optimum has been around for a long time. See also, Global sea level proxies of the Holocene that peak at the same time.
On a paleo-historic scale, Earth has cycled through numerous widespread glaciations and retreats during warming periods, including thawing of the polar ice-cap.
So what happened to Earth during these newly identified “catastrophic events” such as disappearing permafrost?
We’re still here, aren’t we?
This yo-yo climate is what created humans. During the era before the first Ice Age nearly 3 million years ago, we were all apes having fun in the jungles of Africa.
I would more say that ‘we’ stayed entirely in Africa until 100,000ish years ago, gradually changing into modern humans. Ok, we had some fun, but there was probably more of the nasty, brutish and short stuff happening, contributing greatly to the aforementioned evolution.
……..”Yet here we are, actual measurements say that methane and CO2 release are contrary to what climate models predict about thawing permafrost releasing methane.”
What exactly do the climate models get right?
It’s worse than we thought!!!
The science is settled!
If Data and models disagree, the data is wrong. Any ful noes that.
This does not compute logically. Permafrost is frozen saturated soil. Think frozen soupy mud with organic matter. The surface few inches to feet melt in summer, allowing the tundra biome to grow. It cannot release CO2 in its winter frozen surface state because the ice is not gas permeable; diffusion is very slow even in ice cores. That is why ordinary ice cubes trap gas bubbles in the center; they freeze from the outside in and dissolved atmospheric gasses cannot escape.
There is an obvious alternative explanation that shows just how silly stupid the new paper’s Arctic conclusion is. There is a seasonal component to the Keeling curve, every year since the start in 1958. It is lowest in NH fall and highest in NH spring, with each fall and spring a bit higher than the before. This just shows that the NH has more land mass than the SH, and that land growing seasons are a photosynthetic carbon sink. CO2 is a reasonably well mixed gas thanks to winds and storms and diffusion gradients. Therefore its concentration will be higher in Arctic winter than in Arctic summer. Nothing to do with higher winter permafrost emissions, of which there are roughly none, nada, zero, zip, zilch.
More climate science at its very finest (sarc). More brilliant Nature climate nonsense. Nature’s editors should be utterly ashamed of themselves. Beyond parody into Ig Nobel award territory.
And as for methane, more (natural gas)is transported and consumed in NH winter for heating. Than in summer. A lot more. EPA says at least 25% of US methane is leaky gas Infrastructure. So leaks explain the higher Arctic winter methane. CH4 has an even bigger problem diffusing through ice than CO2.
So we should see a similar trend in the air over the US. Data, please?
…as well as the southern hemisphere during its winter,,,
The paper does say that release is higher from drier soil. Presumably, the amount of ice in this drier soil is not enough to entirely block gas diffusion. Farmers like winter frosts, because they loosen the soil, or so my father told me (who used to be a farmer before turning into a minister). Maybe something similar is going on here — methane forms within the soil in summer but is released when the winter frosts loosen it up.
In temperate zones, frost looses the soil because freezing water expands and breaks it up, similar to the action which bursts pipes. When it melts the water drains out leaving loose light soil. I do not see how you can apply this to permafrost which by definition remains frozen.
BTW the paper suggests that plants act as “chimneys” through the ice. Though I don’t see much signs of measurements being done.
I’ve just posted a graph of the CO2 data above. Like you say it peaks early in the year.
Yup, Greg, atmospheric CO2 ppm peaks in mid-May of each calendar year ……. and it hits rock-bottom at the end of September of each calendar year ……. and that bi-yearly (seasonal) cycling has been occurring ever since measurements have been recorded beginning in 1958 at Mauna Loa Observatory …….. and plotted on this graph, to wit:
http://i1019.photobucket.com/albums/af315/SamC_40/keelingcurve.gif
Ristvan
Looking at the atmospheric measuring site and equipment in the photo from one of the links in the head post, what they are reading are CO2 and methane values contained in the atmosphere that has been transported in from mid NH latitudes. See my comments above.
ristvan – spot on.
@ur momisugly ristvan – September 30, 2016 at 12:37 pm
Shur nuff, ristyan, ….. but that seasonal CO2 component to the Keeling curve is the direct result of the fact that it is also lowest in SH Spring and highest in SH Fall.
Yes, none of this simple.
Don’t think so. There are several regions where cold, deep water is up welling and that is out-gassing.
Look at the Indian ocean section of this Scripp’s CO2 sampling cruise. Concentration of CO2 in water is way higher than the surrounding air samples, whereas the Southern Ocean section was the opposite:
https://climategrog.wordpress.com/co2_cruise_map-2/
Greg – October 1, 2016 at 1:01 pm
Greg, iffen you are going to get “nitty-picky” with the context of my commentary then I will reply inkind.
Greg, the total surface area of the SH ocean water is in fact a CO2 sink …… simply because raindrops falls on every square foot area of said surface ……. and every raindrop that falls to earth contains CO2 in the form of carbonic acid.
Cheers
OOPS, my bad. ……. missed a block-quote terminator “/” mark at end of 2nd quote.
We should assume that the authors are aware of the annual changes in atmospheric gas concentrations. They used the eddy covariance technique to discriminate local gas fluxes from bulk changes in the atmosphere. Yes, it is a complex technique, and maybe its accuracy is debatable, but just assuming that the authors were unaware of the problem altogether is … err … shall we say “rash”. Yes, “rash” will do.
The head post, which is based mostly on a press release written for the sole purpose of hyping a single paper, does not give an appropriate impression of the state of the field. There are actually quite a few observational and experimental studies addressing the question of methane and CO2 release from arctic soil, and their responses to soil drainage. Overall, these studies don’t lend much credence to the idea that the expected drying arctic soil due to AGW would further accelerate the greenhouse effect. According to this study, net release of methane tends to decrease as soils get drier, since drying favours the formation of a superficial aerobic layer; within this aerobic layer, methane gets oxidized as it bubbles up from deeper, anaerobic layers. The increased winter emissions of methane are then explained by the dormancy of this aerobic layer.
In an older study, soil drainage rmoderately increased CO2 emissions, resulting from shifts in the composition of the flora. While this was accompanied by dutiful hand-wringing, it was acknowledged that on balance soil drainage reduced greenhouse gas emissions.
Bacteria are in cyst form in winter and not active to consume the methane. Geochemical reactions involving CO2 should be faster in warmer temperatures.
It is possible that methanotrophic bacteria are present and more active in the tundra during the “warm” months and consume the methane as their energy source. Has anyone ever looked for methanotrophs in the Arctic soil?
It is known that photosynthesis increases in the tundra as it warms, decreasing the release of CO2 to levels less than you might otherwise expect.
Yes. There are a couple of recent papers explaining why summer tundra methane release is not as high as was expected because of methanotrophs.
Let’s not draw far-reaching conclusions from a single study. Confirmation needed.
that didn’t stop the IPCC and the hockey stick. front page for a single unconfirmed study by a recent grad student. from which the climate scare was born.
Exactly. Let’s try to be better – but not necessarily polite.
Curious,: Just send me money ( for a team to go up there for 10 years at least as the article seems to implicate) and I’d happily dedicate a team of 5-8 people, the necessary equipment included such as snowmobiles, computers, communication devices, clothing, a medical emergency facility ( Bears you know) one helicopter, a floatplane with snow skis, a boat to cross the open waters and keep the team supplied and the funds to bribe the various government involved. I may have left out a few things here and there but over a ten year period I think 15 mil would cover it. And then of course I keep the royalties for the books/TV rights and the hollywood movie after but hey what’s a few mil these days?
Funding problem, eh? Better ‘alarum’ harder then. It is hard to turn an imagined disaster into a functioning model without financial support.
Love the plea for further and longer funding!
Beep boop! Beep Beep Boop! This just in! Cold weather causes global warming.
Film at 11.
since the research has no ostensible practical value apart from satisfying curiousity (entertainment) it can’t be self supporting.
so if it happens, it happens because the researchers are really truly interested or because they get academic food stamps on the academic dole.
begging is america’s industry now.
yeah, well i just read donatella’s article and there is zero data.
she is referring to an article by Kwon which was about DRAINAGE.
“the authors report that the net effect of drainage in their study is an increase in the amount of CO2 emitted to the atmosphere, which will ultimately magnify climate change. Importantly, Kwon and colleagues show that
the increase is highest during the cold season”
that’s all there is about it- the entire remainder of the article is warming catechism and begging – mostly begging,
get it here:
https://www.sendspace.com/file/o3kle8
imo, it’s a splendid way to waste a few minutes and learn fanny adams.
see what you think.
Excerpted from the above commentary:
Now I am one of those scientists that truly believe that “little if any greenhouse gases escaped the frozen soil during the cold season” …….. and I have been preaching that “fact” for the past 18+ years, …….. but if as stated above that MOST scientists believe that also, then where in the hell are they? Other than myself, they are not voicing their belief in posted commentary on WUWT, that’s for sure.
The factual truth is, most of the learned individuals that voice their belief in posted commentary on WUWT …….. think just the opposite of the aforesaid “most scientists” …….. and agree 100% with the commentary of Kwon’s recent study, as noted, to wit:
Continued excerpted:
Anyone that claims they believe that the October to mid-May increase in atmospheric CO2, as defined on the Keeling Curve Graph, is a direct result of decomposing biomass in the Northern Hemisphere, ….. is in fact agreeing 100% with what Kwon and colleagues are claiming in their above cited study.
Cheers, Sam C, …. AB Degree in Biological and Physical Science, ….. GSC, 1963.
Anyone that claims they believe that the October to mid-May increase in atmospheric CO2, as defined on the Keeling Curve Graph, is a direct result of decomposing biomass in the Northern Hemisphere, ….. is in fact agreeing 100% with what Kwon and colleagues are claiming in their above cited study
=======================================================
Not necessarily. The arctic tundra being discussed is frozen from October to mid May. Vast areas of the NH temperate zone are cold enough during that period for herbaceous plants and deciduous leaves to die, yet are not too cold for decomposition to take place.
SR.
“yet are not too cold for decomposition to take place.”
Sorry bout that, Stevan Reddish, ……. but 98% of all the bacteria and other microbes that do said “decomposing” ….. are all loyal Union Members of the Brotherhood of Dead Biomass Decomposers ……. and they pretty much stage a “work slowdown” if the dead biomass is too “dry” or the temperature is below 60F, ….. and they pretty much “stop work” all together iffen the dead biomass is “dried out” …. or the temperature drops below 41F.
And, Stevan Reddish, iffen you don’t wanna believe me, then maybe you will believe the USDA, to wit:
“A refrigerator set at 40 °F or below will protect most foods.” Don’t take that out of context or imagine it is a black or white affair. What they are saying is a: …. will protect most foods for a week or so. It will not be OK after three months. That’s also why you have two star and three star freezers and you should not leave food in them indefinitely.
My local pizzarillo puts his dough in the fridge to ferment it . When it gets the first dark mould spots on the surface it’s ready to use. Takes a couple of weeks.
Rule of thumb : microbes slow by a factor or two for every 10 deg. C. Often the decomposition is exothermic, so once covered by ice or snow which insulates them from evaporation, that may allow some sub-surface warming. This seems to be what the study is referring to about a ‘sandwich’ forming.
I have to agree that in these conditions it would be pretty slow. The paper is very light on data and it’s not clear what sort of solid evidence they have. A lot of it seems like hand-waving arguments.
Greg – October 1, 2016 at 1:20 pm
And the increase in atmospheric CO2 that occurs during the NH winter months (Oct thru March) is a pretty rapid process, ……. RIGHT?
Greg, the calendar date of the “greening n’ growing” and the “dying n’ rotting” of the NH biomass is highly unpredictable ……. simply because the aforesaid is highly dependent upon the NH latitude in which said biomass resides ….. AND ….. the highly unpredictable weather conditions that exist at said NH latitudes, ……. whereas, ……. the calendar date of the “start n’ end” of the aforesaid bi-yearly CO2 cycle is highly predictable …… as well as is the quantity of increase/decrease in atmospheric CO2 ppm.
DUH, one cannot claim that a “function” that is highly unpredictable is the same “function” that is responsible for “forcing” another function that its occurrence is highly predictable.
Also, isn’t winter the dry season in NH extratropical zones, when plants die due to seasonal aridity. These areas are also not frozen, even though it is “winter”. Decomposition is rampant…
SR
I don’t know what part of the NH you are familiar with but “dry” and “aridity” are not terms usually associated with that season in my experience in many parts of Europe.
Stevan Reddish – September 30, 2016 at 7:03 pm
“No”, Wintertime (Nov to March) is normally “cold and wet”, ….. whereas the Fall season (mid-August thru October) is normally “dry w/cool-cold nights”.
Samuel
Your 18+ years of belief is correct, do not be sidelined by this post. See my other comments and link above.
ozonebust,
I read your above post and posted a rebuttal to its contents.
Sam C
We are still waiting to see a single CO2 based model prediction be verified by any empirical research in the oceans, atmosphere, Arctic or Antarctic.
ntesdorf
“We are still waiting to see a single CO2 based model prediction be verified by any empirical research in the oceans, atmosphere, Arctic or Antarctic.”
Of what ????
guys- this is not about the arctic or the tundra.
it’s about a tiny patch in siberia that was drained for human use.
the topic is the effects of drainage.
Why is everyone so negative about this study? It reports actual measurements, not just another modeling exercise. Aren’t we usually agreed that we need more respect for experimental and observational data, and less fixation on preconceived ideas?
Unless someone can convincingly demonstrate an error in the experimental setup, we should focus on understanding what this study means, not on pooh-poohing it.
Maybe if they,say, didn’t try to dress it up with dramatically overdone apocalyptic rhetoric? Maybe if they stuck to science and left out the Eco-drama and ‘Screaming Arctic’ type hyperbole. Who takes scientists seriously when they continually write crap like this? What’s next? “The Arctic is like a big fuzzy puppy, and Exxon has put him in a microwave and set it on High.”
Maybe you are mistaking the press release for the actual paper? Press releases are written by clueless morons with a BSc degree that compulsively put some ridiculous spin on everything.
This is rather a strange finding… Any strange unexpected result needs a little scrutiny before I an buying it. I could see where methane continues to be released until the the entire layer of permafrost is frozen, but not after that…
They were using ‘towers’? That would imply they are sampling the air, not a chuck of the permafrost. They are assuming the methane is all coming from the permafrost? Could cold air be naturally trapping the methane into a cold air layer? :-\ Could the ‘plants acting as chimneys’ be producing methane?
And plants are acting as chimneys? How does that work? The plants are supposedly dormant aren’t they? Or are they talking about evergreens like pine trees?
Sigh. I can’t really tell what they are doing or saying…except that there is more methane being released than anyone thought, so once again the models are wrong. Methane is a strong GHG, so they must have attributed extra warming in the models to something else (like CO2). Tell me it ain’t so!
Robert of Texas
Feel free to relax. They are measuring CO2 and methane that is being transported in from the NH mid latitudes. The same place that the heat came from that created the warmer than normal atmospheric temperatures 2015/16 winter months.
It is the same reason why the Arctic sea ice was so low over the winter peak. Inward atmospheric transport, no more no less. Its that simple. It appears that only scientists can make something this simple sound complicated.
“…notoriously under-studied…”
Can’t you all see that it’s about Funding! Funding! And more Funding! If we don’t fund them for at least ten years then we will not know that we are doomed anyway because the earth is spewing gasses trying to stay warm apparently.
It’s a measurement of their CO2/CH4 footprint in the Arctic night.
Does anyone know what happens to dissolved CO2 when sea water freezes? Does most of it get trapped in the ice, or does the freezing process squeeze out much of the CO2 like it squeezes out salt? If CO2 is released during the freezing process, it could help explain why there is more CO2 in the Arctic atmosphere during winter months.
As water cools, it acts as sink and absorbs gases at the surface. There is a constant flow of warm(er) water entering the Arctic ocean on the surface, mainly from N. Atl. This water is cooling as it travels north and will be absorbing.
It is correct that water will degas as it freezes. This can be seen as bubbles in ice cubes made in the freezer where they are trapped in the ice as gas bubbles. Presumably not all of this will be trapped and may have more tendency to escape in agitated conditions.
As I said above much of this cold, gas laden water will sink due to the thermohaline circulation, rather than freezing on the surface.
Since we have a fairly good handle on the seasonal change in ice volume, maybe some estimation could be made from CO2 content of arctic water close to freezing. There will be data for that.
Note, as shown in the legend, the CO2 data has a linear trend subtracted to allow comparison to the annual cycle in ice area.
Greg, ….. re-plot the above graph …. using the same “atmospheric CO2 ppm” ……. but use the “SH sea ice area” instead of the NH’s.
Hey, you know, I just love it when people give me orders. Especially when they are wrong and think I have time to do the work to prove their mistaken ideas for them.
If you want to plot it go ahead. The data source is on my graphs.
While you are running up your hypothesis, ( which if I get the insinuations you are making is that the whole worlds CO2 is dominated by SH SST ) , you may like to note that the amplitude of the annual cycle is way larger in NH than in SH. That does not go well for your tail wagging dog hypothesis, unless you want to play the “Arctic amplificaiton” card.
The notion that “much of this cold, gas laden water will sink due to the thermohaline circulation, rather than freezing on the surface” is a corollary of the “great conveyor belt” meme of climate science. But as physical oceanographers (e.g., http://science.sciencemag.org/content/298/5596/1179) have been pointing out for many years, thermohaline circulation is but a weak, diffusive, gravity-driven adjunct to the horizontal, wind-driven circulation. There is no evidence for en masse subduction of surface waters in the Arctic, or anywhere else for that matter. The idea of large-scale coherent thermohaline cycles sequestering CO2 in the deep ocean is uninformed speculation.
Greg – October 1, 2016 at 1:47 pm
HA, a simple abstract thought in which one replaces the Arctic sea ice extent with a “mental image” of the Antarctic sea ice extent is sufficient to prove my conjecture.
Greg, don’t be “talkin trash”, ….. we are not discussing “the whole worlds CO2 domination”, …….. we were simply discussing the reasons for the bi-yearly and yearly fluctuations in atmospheric CO2 ppm quantities as measured and recorded at the Mauna Loa Observatory, Hawaii.
To wit, 58 years of Mauna Loa’s monthly average atmospheric CO2 ppm data ftp://aftp.cmdl.noaa.gov/products/trends/co2/co2_mm_mlo.txt
And Greg, who the hell cares, other than you, ….. that NASA, NOAA or another party is “claiming” that the amplitude of the annual cycle is way larger in the NH than in the SH?
Calculating atmospheric CO2 ppm quantities via use of IR sensors in/on an orbiting satellite makes for highly questionable claims of accuracy.
And Greg, I suggest you read this posted commentary, to wit:
https://wattsupwiththat.com/2016/09/30/inconvenient-studies-find-methane-and-carbon-dioxide-release-is-highest-in-the-arctic-during-the-regions-cold-season/comment-page-1/#comment-2310480
Before you again become unglued and mouthy in criticism of my person.
The seasonal cycle of CO2 and methane is mostly related to vegetation.
In the spring/summer plants are growing fast, and draw-down CO2. In the fall, they die off, start to give off CO2 and it accumulates in the atmosphere. Then it starts to decay and more CO2 and now methane is released. Peak in the Arctic regions is January.
Bill, I don’t see that data from Alert peaking in Jan and IIRC that is on the edge of the Arctic.
Sorry, I was thinking of methane which does peak in January. CO2 has a January bump and then a later higher peak in March/April.
Barrow Alaska is the place to use for Arctic measurements. World class station here.
http://www.esrl.noaa.gov/gmd/dv/iadv/graph.php?code=BRW&program=ccgg&type=ts
“The seasonal cycle of CO2 and methane is mostly related to vegetation.”
Please cite the actual, factual and/or scientific evidence that is the basis of your above claim.
Otherwise, the mimicry of “junk science” agitprop, that has no basis in fact, is highly detrimental to the furthering of scientific knowledge within the minds of the human populations.