Guest Post by Willis Eschenbach
Lord Monckton has initiated an interesting discussion of the effective radiation level. Such discussions are of value to me because they strike off ideas of things to investigate … so again I go wandering through the data.
Let me define a couple terms I’ll use. “Radiation temperature” is the temperature of a blackbody radiating a given flux of energy. The “effective radiation level” (ERL) of a given area of the earth’s surface is the level in the overlying atmosphere which has the physical temperature corresponding to the radiation temperature of the outgoing longwave radiation of that area.
Now, because the earth is in approximate thermal steady-state, on average the earth radiates the amount of energy that it receives. As an annual average this is about 240 W/m2. This 240 W/m2 corresponds to an effective radiation level (ERL) blackbody temperature of -18.7°C. So on average, the effective radiation level is the altitude where the air temperature is about nineteen below zero Celsius.
However, as with most thing regarding the climate, this average conceals a very complex reality, as shown in Figure 1.
 Figure 1. ERL temperature as calculated by the Stefan-Boltzmann equation.
Note that this effective radiation level (ERL) is not a real physical level in the atmosphere. At any given location, the emitted radiation is a mix of some radiation from the surface plus some more radiation from a variety of levels in the atmosphere. The ERL reflects the average of all of that different radiation. As an average, the ERL is a calculated theoretical construct, rather than being an actual level from which the radiation is physically emitted. It is an “effective” layer, not a real layer.
Now, the Planck parameter is how much the earth’s outgoing radiation increases for a 1°C change in temperature. Previously, I had calculated the Planck parameter using the surface temperature, because that is what is actually of interest. However, this was not correct. What I calculated was a value after feedbacks. But the Planck parameter is a pre-feedback phenomenon.
If I understand him, Lord Monckton says that the proper temperature to use in calculating the Planck parameter is the ERL temperature. And since we’re looking for pre-feedback values, I agree. Now, this is directly calculable from the CERES data. Remember that the ERL is defined as an imaginary layer which calculated using the Stefan-Boltzmann equation. So by definition, the Planck parameter is the derivative of that Stefan-Boltzmann equation with respect to temperature.
This derivative works out to be equal to four times the Stefan-Boltzmann constant time the temperature cubed. Figure 2 shows that value using the temperature of the ERL as the input:
 Figure 2. Planck parameter, calculated as the derivative of the Stefan-Boltzmann equation.
Let me note here that up to this point I am agreeing with Lord Monckton, as this is a part of his calculation of what he calls the “reference sensitivity parameter λ0” (which is minus one divided by the Planck parameter). He finds a value of 0.267 °C / W m-2 up to this point. as discussed in Lord Monckton’s earlier post, which is the same as the Planck parameter of -3.75 W/m2 per °C shown in Figure 3.
Now again if I understand both Lord Monckton and the IPCC, for different reasons they both say that the value derived above is NOT the proper value. In both cases they say the raw value is modified by some kind of atmospheric or other process, and that the resulting value is on the order of -3.2 W m-2 / °C . (In passing, let me state I’m not sure exactly what number Lord Monckton endorses as the correct number or why, as he is not finished with his exposition.)
The problem I have with that physically-based explanation is that the ERL is not a real layer. It is a theoretical altitude that is calculated from a single value, the amount of outgoing longwave radiation. So how could that be altered by physical processes? It’s not like a layer of clouds, that can be moved up or down by atmospheric processes. It is a theoretical calculated value derived from observations of outgoing longwave radiation … I can’t see how that would be affected by physical processes.
It seems to me that the derivative of a theoretically calculated value like the ERL temperature can only be the actual mathematical derivative itself, unaffected by any other real-world considerations.
What am I missing here?
w.
My Request: In the unlikely circumstance that you disagree with me or someone else, please quote the exact words you disagree with. Only in that way can we all be clear as to exactly what you object to.
A Bonus Graphic: The CERES data is an amazing dataset. It lets us do things like calculate the nominal altitude of the effective radiation layer all over the planet. I did this by assuming that the lapse rate is a uniform 6.5°C of cooling for every additional kilometre of altitude. This assumption of global uniformity is not true, because the lapse rate varies both by season and by location. Calculated by 10° latitude bands, the lapse rate varies from about three to nine °C cooling per kilometre from pole to pole. However, using 6.5°C / km is good for visualization. To establish the altitude of the ERL, I divided the difference between the surface temperature and the ERL temperature by 6.5 degrees C per km. To that I added the elevation of the underlying surface, which is available as a 1°x1° gridcell digital dataset in the “marelac” package in the R computer language. Figure 3 shows the resulting nominal ERL altitude:
 Figure 3. Nominal altitude of the effective radiation level.
The ERL is at its lowest nominal altitude around the South Pole, and is nearly as low at the North Pole, because that’s where the world is coldest. The ERL altitude is highest in the tropics and in temperate mountains.
Please keep in mind that that Figure 3 is a map of the average NOMINAL height of the ERL …
A PERSONAL PS—The gorgeous ex-fiancee and I are back home from salmon fishing, and subsequent salmon feasts with friends along the way, and finally, our daughter’s nuptials. The wedding was a great success. Just family from both sides in the groom’s parents’ lovely backyard, under the pines by Lake Tahoe. The groom was dashingly handsome, our daughter looked radiant in her dress and veil, my beloved older brother officiated, and I wore a tux for the first time in my life.
The wedding feast was lovingly cooked by the bride and groom assisted by various family members, to the accompaniment of much laughter. The bride cooked her famous “Death By Chocolate” cake. She learned to cook it at 13 when we lived in Fiji, and soon she was selling it by the slice at the local coffee shop. So she baked it as the wedding cake, and she and her sister-in-law-to-be decorated it …

Made with so much love it made my eyes water, now that’s a true wedding cake for a joyous wedding. My thanks to all involved.
Funny story. As the parents of the bride, my gorgeous ex-fiancee and I were expected by custom to pay for the wedding, and I had no problem with that. But I didn’t want to be discussing costs and signing checks and trying to rein in a plunging runaway financial chariot. So I called her and told her the plan I’d schemed up one late night. We would give her and her true love a check for X dollars to spend on the wedding … and whatever they didn’t spend, they could spend on the honeymoon. The number of dollars was not outrageous, but it was enough for a lovely wedding.
“No, dad, we couldn’t do that” was the immediate reply. “Give us half of that, it would be plenty!”
“Damn, girl …”, I said, “… you sure do drive a hard bargain!” So we wrote the check for half the amount, and we gave it to her.
Then I created and printed up and gave the graphic below to my gorgeous ex-fiancee …
 … she laughed a warm laugh, the one full of summer sunshine and love for our daughter, stuck it on the refrigerator, and after that we didn’t have a single care in the world. Both the bride and groom have college degrees in Project Management, and they took over and put on a moving and wonderful event. And you can be sure, it was on time and under budget. Dear heavens, I have had immense and arguably undeserved good fortune in my life …
I’m happy to be back home now from our travels. I do love leaving out on another expedition … I do love traveling with my boon companion … and I do love coming back to my beloved forest in the hills where the silence goes on forever, and where some nights when the wind is right I can hear the Pacific ocean waves breaking on the coast six miles away.
Regards to all, and for each of you I wish friends, relations, inlaws and outlaws of only the most interesting kind …
w.
So the ERL is a ‘locked in value’. 240W/m2 and -18.7 C. Was this value taken and calculated on a particular day/ date/ timeframe? And all subsequent ‘changes’ are anomalies?
Thanks, Alex. Since the outgoing radiation is the same as the incoming, yes, the global average ERL is a constant, or at least until such time as the input from the sun changes.
However, the local values at any given point are changing with the seasons.
w.
Willis does your idea of “Radiation Temperature” match the Stefan-Boltzmann total radiant emittance to the Black Body Temperature, or do you match the Planck Black Body Radiation Spectrum peak spectral radiant emittance wavelength (or frequency) to the Temperature of the Planck Spectrum ??
The first would assume that the total earth is a black body with 100% radiant emissivity, while the second would assume it is a grey body, with a less than 100% constant emissivity.
It seems the experimental measurability of those two variables is somewhat different.
George.
To me, it seems we miss out on a lot of texture when we just smooth over the seasons (as one example).
Because it’s at the theoretical value only about 2 days a year. And what does it do at night?
the earth isn’t a black body, there must be no convection, the sun isn’t one either.
george e. smith September 7, 2016 at 6:07 am
In general, the emissivity of the surface is close enough to 1 that it is ignored in first-cut calculations.
w.
Willis, if the ERL is a pseudo surface that is in essence that elevation at which out going and incoming energy are equal, then would it not in effect be the equivalent of the geoid? As regards the ERL being a theoretical surface, so is the geoid which marks a gravitational equipotential. It affected slowly by the movement of masses within the earth and even, very slightly by the mass of the atmospheric above. Wouldn’t changes in thermal mass below and incoming energy from above (since the sun is not quite constant) cause the ERL to undulate like the surface of a viscous liquid?
Not “equivalent” read “analogous to”
Willis,
“However, the local values at any given point are changing with the seasons.”
I would think they change with night and day even . . It seems to me you are speaking of something rather like sea level, which varies locally with tides and currents and waves . . and latitude, yet is “real” enough in an effective sense, such that an average is usefully spoken of as if a single “surface” for calculative and understanding purposes of various sorts . .
More or less than $50,000?
Much less, I’m a reformed cowboy, and the newlyweds hate to spend money …
w.
And I thought my daughter ran an inexpensive wedding. But, she was paying big city prices.
I am glad you and yours had a wonderful life defining event!
Plus, from the national new, it sounds like it was a good year to miss the burning man festival.
Many years of happiness to all!
Wedding expense correlates negatively with marriage duration, so yours are off to a very good start. All the best.
http://papers.ssrn.com/sol3/papers.cfm?abstract_id=2501480
Reminds me of a plot I saw of per-pupil school expenditures in Massachusetts town-by-town. Standardized test scores had a very distinct inverse correlation with per pupil expenditures. Makes a pretty good argument for reducing school budgets.
So… there’s another gorgeous ex-fiancee in your life? 😉
The answer is that the earth is not a perfect black body and so the
reference system is modified to include some long-wavelength absorption
from the atmosphere. If you read the literature about feedbacks you will
see that lambda_0 is defined as the ratio of the change in output for an
idealised system for a change in the input for an arbitray reference system. You are thus free to decide for yourself what counts as the reference system and what counts as feedback. If you choose an ideal black body as the reference system then you have to include the long-wavelength absorption of the atmosphere (about the idealised emitting layer) as a feedback that will heat up the earth. But (and I am guessing) since this is very quick compared to other processes (such as the artic melting) it makes sense to include this in the reference system and only consider slow changes as the feedbacks.
What does that have to do with the cost of a wedding?
Walter,
Just think of your wallet as a black body radiating $100-dollar bills. The local equilibrium level is reached when the number of outgoing $100-dollar bills = a wedding successfully pulled off with no loan sharks hunting for your kneecaps with baseball bats due to any disequilibrium in wedding-related expenses.
What a pickle one gets oneself into when averaging out values for an entire planet.
How absurd and irrelevant those numbers become?
What motiviates ‘scientists’ to attempt this and to keep trying to draw conclusions and make predictions based on calculations using these meaningless numbers?
You would think as scientists they could address this compulsion.
When you start filtering, you begin a process of throwing away information often very expensively obtained. If you continue the process over any finite amount of time, you ultimately can end up with a SINGLE number.
But now you have NO information whatsoever. And the problem with the output of your ZERO bandwidth low pass filter is that you have no idea where in the phase of that zero frequency cycle your number actually is.
Given that we have measured values for local Temperatures on the earth’s actual surface, that cover an extreme range from about +60 deg. C down to about -95 deg. C (well -94 anyway), I would expect the filter can give you almost any value in that range depending on what set of location points you actually measure.
Well it’s an exercise for people with a terra-flop computer sitting around idle.
G
Filtering is done in an effort to improve the signal to noise ratio and is perfectly appropriate if concerned with the long term trends. The information you are discarding is the high frequency variations which by definition have no bearing on the trend.
The information you are discarding is the fluctuations in the signal.
Those are measured numbers; they aren’t noise.
What bearing does a “trend” calculated from a time limited data set have on anything that is outside that time limited window.
So just what is the trend for the last 4.5 billion years during which life is supposed to have existed on earth ??
There are NO algorithms of statistical mathematics that can tell you whether the very next observed point in a time data set will be higher, or lower or the same as the very last known point in that data set. Nor for that matter can it tell you that information for ANY single known data point in the set.
The results of such analyses are valid only for the specific set of elements in the data set to which the algorithm is applied. Such machinations work perfectly well for ANY finite data set of finite real numbers and they guarantee NO relationships of any kind between those finite real elements. It’s numerology.
One is sampling making (or faking) something out of nothing.
NO real physical system responds in any way to ANY kid of statistical mathematics calculation of any or all of the system variables.
Real systems respond only to instantaneous real time values of variables.
G
George,
You can get your TF for about $600 now… (some programming required):
https://chiefio.wordpress.com/2015/12/08/personal-teraflop-climate-simulator-for-how-much/
NVIDIA Jetson TX1 Development Kit Proprietary DDR4 Motherboards 945-82371-0000-000
by NVIDIA
4 out of 5 stars 1 customer review
Price: $599.99 & FREE Shipping.
[…]
256 CUDA Cores
1 TFLOPs (FP16) Peak Perf
@george e. smith – I agree that time-trends are meaningless but there are other trends besides those involving time. For example we can look at the trend of temperature versus CO2 concentration.
If we have some hypothetical physical model in mind to explain the relationship and we wish to find the model parameters which best explain the data we only help ourselves by removing the high frequency variations that have nothing to do with the physical relationship we are trying to model. In this context, the high frequency variance _is_ noise, meaning extraneous to the signal of interest. And filtering does not discard the data, it extracts (by means of a weighted sum) the information pertinent to the time-scale of interest.
Stochastic models are not new or controversial.
Now, that is an unusual claim.
Almost every stochastic model is controversial unless fully tested and certified; and even then viewed suspiciously.
I don’t have the problem that some do with the idea of a mean global surface temperature. It is just a proxy for the over-all energy contained in the system which at any instant in time has some unknowable value but a value nonetheless. Averaged over time and space the variance tends toward zero. If the objective is to determine local weather patterns from such a proxy, then we agree that is a fool’s errand. But if the objective to is make policy relevant projections about the future state of the climate then the proxy is informative if, and it’s a big if, it can be shown that local _climates_ (not weather) correlates to the MGST over the relevant decadal time-scales and at various locales. I’ve never done this analysis but I assume someone has. If it could be shown the correlation is not existent then you have a point but I doubt this would be true since the MGST is a determined from these local time series.
This is also why I don’t get too concerned with the data “adjustments” as long as they are done homogeneously across the entire dataset. Such errors also tend to average out and do not have much impact on a model regressed over the entire series.
Jeff
“This is also why I don’t get too concerned with the data “adjustments” as long as they are done homogeneously across the entire dataset. Such errors also tend to average out and do not have much impact on a model regressed over the entire series.”
You put fairly clear, fairly strict, conditions on data-fudging.
“Homogeneously” for one.
I agree, but wonder whether all data-bludgeoning over the last decades would meet your [and my] criteria.
MWP ‘elimination’ suggests that not all such data-torture is acceptable.
And certainly not as the base for a religion – or a socialist, world-changing, movement.
Auto – absolutely a Nobel prize-co-winner [as absolutely an actual EU Citizen when the EU won a prize for a better pair of pyjamas, or similar]. Like c. 500,000,000 others, I suppose.
In my comment I was referring to the instrumental period. The proxies you refer to a subject to all manners of mischief which Steve MacIntyre has done a remarkable job of exposing. He is much more circumspect than I would be about assigning motives. Given what he has uncovered regarding selective use of proxies and “unorthodox” statistical methods I can’t see how the charge of scientific fraud could not be sustained.
So Jeff, what is the appropriate “bandwidth” and the appropriate “matched filter” shape that will maximize the signal to noise ratio of the measurement of the Earth’s mean Temperature ??
If filtering improves the signal to noise ratio there is just one filter that will maximize the signal to noise ratio: the “matched filter”. Well other filters which are more practical to implement can come close; within a half dB of the perfect matched filter in the case of a Gaussian filter, for one particular type of signal.
But that still requires the correct choice of “bandwidth” for that filter. So what is the optimum bandwidth for the earth Temperature filter ??
G
The optimal matched filter presumes stationarity which unfortunately may not be assumed. This does not mean filtering doesn’t improve the SNR but rather that the optimum SNR is not achievable over long time scales. But as long as the cut-off frequency of a properly designed filter is large relative to 1/time-scale of interest, the filter will be stochastically transparent meaning that the off-peak autocorrelation function will be unaltered.
“…the IPCC…say the raw value is modified by some kind of atmospheric or other process, and that the resulting value is on the order of -3.2 W m-2 / °C .
The problem I have with that physically-based explanation is that the ERL is not a real layer. It is a theoretical altitude that is calculated from a single value, the amount of outgoing longwave radiation. So how could that be altered by physical processes? It’s not like a layer of clouds, that can be moved up or down by atmospheric processes. It is a theoretical calculated value derived from observations of outgoing longwave radiation … I can’t see how that would be affected by physical processes.”
The IPCC-reported value is nothing like taking some imaginary emission level and differentiating the Stefan-Boltzmann equation. That’s nonsense, because as you point out the TOA emission is a mixture of what comes from the surface and what comes from all levels of the atmosphere.
A common way in which it is calculated is described in the methods section of this paper:
https://www.gfdl.noaa.gov/bibliography/related_files/bjs0601.pdf
The methods section you link to seems to be very speculative. Uncertainty is only about 10% for something not measured over a quarter of a millennium. Should have been peer reviewed.
“Uncertainty is only about 10% for something not measured over a quarter of a millennium. “
The relation between forcing and GHG is not gotten from observations over long time. It is calculated from the known radiative properties of GHG etc, which are not expected to change much in that time. That is what the 10% relates to. The scenario is of course speculative, but well defined (and not by S&H).
My problem is that this is all computer simulations again – written by amateurs (in software engineering), never properly designed, reviewed, tested, and verified. You can trust the output of these simulations about as much as you would a home-brew, uncalibrated instrument.
Nick Stokes, Thank you for the knowledgeable reply.
However, the uncertainty from the lack of measurements that I was referring to was this.
10% for soot and SOx concentrations over that period? Ice core measurements assume a well mixed atmosphere to be meaningful – that doesn’t apply for everything. We certainly don’t have a theory that can deduce that at every latitude.
This just doesn’t look justified.
Paul Penrose, which radiation-scheme verification and validation papers have you read? Why, specifically, do you think that they are all wrong?
Hi Willis. It is possible to take this further by looking at the weighting of respective radiating bodies (surfaces, clouds and proportional cloud types and clear sky). Each has a calculable emissivity to a degree. This represents more truly how the Earth answers to space. It doesn’t do so as a black body. Atmospheric components that block direct surface radiations through opacity raise atmospheric emissivity.
As we have little care about representing the Earth’s temperature as a single averaged number, the most accurate one is from an ERL that is calculated through a weighted mean emissivity. This gives an effective mean radiative temperature much higher than 255K. Actually it is more like 280K and tells us that most radiations come from relatively high temperatures close to the Earth’s surface weighted towards those higher temperatures.
Best regards.
nuworld: you’re describing partly how it’s done. The main differences between your suggestion and the actual calculations are:
1) non-uniform temperature is accounted for by solving for atmospheric profiles at each lat-lon location on Earth.
2) the full radiative transfer equation is solved at each level for a number of wavelength bands. The solvers used may vary, but you end up with an emissivity defined for a layer by integrating the absorption coefficients through the layer thickness during the solution.
The overall method is explained in the methods here:
https://www.gfdl.noaa.gov/bibliography/related_files/bjs0601.pdf
“What am I missing here?”
Much less than Lord M. And this is all good:
But the thing is, the IPCC, citing S&H don’t use ERL. They deal with a direct dependence of ΔT_S on ΔF₀, not through an intermediate ERL, but through the various intermediate (feedback) variables T, water, albedo etc. And by T they mean space/time continuum T. Over some cycle (annual, I think), they look at how each cell/3hr period value of T affects F, and add them all. They say:
And they get a rather complete set of information, which they separate into the dependence you would have with uniform change λ₀, and the rest that is due to the way ΔT changes over altitude and altitude λ_L: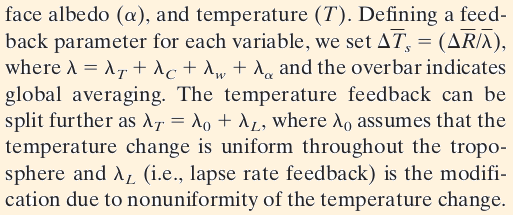

Here’s their lat/alt map
More details here.
It looks like if you torture the data enough you can get an image of a Teenage Mutant Ninja Turtle
“if you torture the data enough”
Nick
The Scream came to mind first. The mask around the eyes made me think -TMNT.
Keep up the good work. I wasn’t having a go at you or your explanations
“if you torture the data enough”
Hilarious. Bravo.
The thing is, in order for an increase in atmospheric opacity to outgoing IR to be able to create actual warming (an absolute rise in T) at the altitude-specific levels from the tropopause down to the surface, the OLR through the ToA needs to go down for any given initial set of temperatures. Meaning that, if T (including T_s) stays the same, then T_e drops (Z_e goes up without parallel warming, forcing subsequent warming), and if T_e stays the same, then T (including T_s) increases (Z_e goes up with parallel warming). This is THE “greenhouse” warming mechanism, “the raising of the ERL”, as schematically illustrated here (Soden & Held, 2000):
http://www.climatetheory.net/wp-content/uploads/2012/05/greenhouse-effect-held-soden-2000.png
Thanks, Nick. I thought that the Planck parameter was dW / dT with T taken at the temperature of the imaginary ERL.
Is this correct? If not, how do you describe the Planck parameter?
It sounds like the IPCC is saying that the Planck parameter lambda zero is the change in radiation dW if there is a change in temperature of 1°C from the surface up to the top of the atmosphere. Is this your understanding?
If so, I’ll have to think about that. CERES can give me ∆T at the surface, as well as ∆W (outgoing longwave) at the TOA. And I can calculate something resembling the ERL temperature, so I might be able to calculate something akin to what the IPCC are doing.
The information is much appreciated. Let me mess around with this.
w.
“It sounds like the IPCC is saying that the Planck parameter lambda zero is the change in radiation dW if there is a change in temperature of 1°C from the surface up to the top of the atmosphere. Is this your understanding?”
Yes, I think so, as per the S&H extract quoted. They work out the effect of perturbing each cell by 1°. Then they add up to get the effect of perturbing them all by 1° equally, and call that Planck. The difference averaged is called Lapse Rate feedback.
Thanks, Nick. I’ll see what I can work up with that.
w.
“Is this correct? If not, how do you describe the Planck parameter?”
The Planck parameter is the net change in radiation at the top of the atmosphere following a global-average warming of 1 K that is vertically uniform through the troposphere.
So there’s no change in lapse rate, and you properly calculate the contribution to flux changes from all levels of the atmosphere and from the surface. This is described in the Soden & Held (2006) methods section, if their description is unclear then you could quote the exact words you’re confused by and I’m sure Nick or I could try to clarify.
Nick and MieScatter, many thanks for your assistance and explanations. After sleeping on your advice and clarifications, I have a question. Given that;

1) the IPCC says that the Planck parameter is the change in outgoing TOA radiation that you get when you raise the temperature from the surface to the TOA by one degree C, and
2) given the IPCC assumption that the lapse rate is constant under small changes in temperature …
… then it would seem to me that my calculation upon starting this quest should equal the IPCC findings. I say this because what I first calculated was the change in outgoing TOA radiation corresponding to a 1°C change in surface temperature. Here is that figure …
BUT under the IPCC assumption regarding lapse rates, that 1°C change in surface is reflected all the way up to the top of the atmosphere, meaning that I’m already looking at the results of the IPCC’s “a global-average warming of 1 K that is vertically uniform through the troposphere.”
Again, what am I missing here?
w.
Isaac Held believes that a non radiating atmosphere is isothermal (from personal com). In doing so he renders the lapse a function of opacity. Changing opacity has to change the lapse according to his belief. The old, ‘GHG’s cool the upper and warm the lower’.
So you have to decide upon whether long wave radiative heat transfer affects the lapse.
Data says long wave doesn’t affect the lapse so Held’s atmosphere is based upon an incorrect assumption.
Willis,
“1) the IPCC says that the Planck parameter is the change in outgoing TOA radiation that you get when you raise the temperature from the surface to the TOA by one degree C, and
2) given the IPCC assumption that the lapse rate is constant under small changes in temperature …”
The IPCC defines sensitivity as the ratio of surface temperature change to flux at TOA. The AR5 mentions Planck feedback, but not very specifically, and it isn’t in the glossary. I think it comes back to Soden and Held, who define the Planck as TOA flux over 1°C uniform heating in the atmosphere. The difference between 1°C uniform and 1°C surface then becomes the lapse rate feedback, which may include more effects than just change in LR.
As to whether your method should get the same result, I’m not sure. S&H look at changes in the same location over time, due to forcing. You’re looking at comparing changes as location varies, at the same time. That may involve different causes of change.
Willis Eschenbach: “then it would seem to me that my calculation upon starting this quest should equal the IPCC findings.”
The lapse rate is expected to change under warming in real-world conditions but that’s the lapse rate feedback. If you read Soden & Held (2006), they explain how the split is done:
https://www.gfdl.noaa.gov/bibliography/related_files/bjs0601.pdf
The Planck response in one location may be different from another. Imagine a zone with a dry upper troposphere versus a moist upper troposphere, but otherwise the same temperature profile and surface temperature. Under a 1 K warming, the dry case sees a bigger increase in flux at the top of the atmosphere.
The Planck feedback is defined for long-term warming patterns and with no change in moisture or clouds. CERES regressions don’t match this, you need to do the calculation as Soden & Held did. If you could quote the exact bit of their paper that’s confusing you it would help.
MieScatter, you have said,
“The lapse rate is expected to change under warming in real-world conditions but that’s the lapse rate feedback. If you read Soden & Held (2006), they explain how the split is done:”
Isaac Held believes that a non radiating atmosphere is isothermal. Also that a pure radiative, without other forms of heat transfer has an extreme lapse, referring the lapse a function of opacity.
In reality the tropospheric lapse appears to be totally independent of the whole of the proposed ‘greenhouse effect’.
So describing how they model and explain something that ‘isn’t there’ is questionable.
Anybody who uses the term “surface albedo” in a science paper has already lost my interest.
Albedo is NOT a reflection coefficient of any surface. it is a single number for an entire planet, and for earth it is something like 0.367 or thereabouts.
Reflection coefficients (reflectances) are frequency (wavelength) dependent variables.
Albedo is NOT spectrally selective. it is a single number for the entire solar radiation spectrum.
G
george e. smith September 7, 2016 at 6:27 am
There’s bad news for you if that’s the case. Google Scholar lists over 50,000 scientific papers discussing things like say the Nature magazine article entitled “Offset of the potential carbon sink from boreal forestation by decreases in surface albedo” … so in effect you’ve just proudly announced that you are not interested in scientific research.
w.
Nick Stokes: ΔT changes over altitude and altitude λ_L
is that supposed to read “altitude and latitude”, as in the graphs?
MrM,
Thanks, yes.
Or perhaps changes in latitudes, changes in attitudes?
It is wrong to use equilibrium formulae for non equilibrium dynamics, especially when you are interested in the changes, but not only then. The emission spectrum from Earth is very far from gray/black body. Radiation temperature, black body physics, Stephan-Boltzmann and so on are not applicable. If you simplify a theory more than necessary, you get absurdities, because ex falso, quodlibet. Earth does not have a single temperature. Averaging intensive quantities and using them as if they are true physical values and calculating pseudo-physical results out of them guarantees wrong results, except in very few exceptional cases, but it’s not the case for Earth.
One day, Climate ‘Science’ will enter in and engage with the real world, and when it does, it will be a revelation.
Good grief.
An object on the surface warms in sunlight. At night it cools.
After four and a half billion years, the surface is no longer molten, surface water is below boiling point, and rising CO2 levels are helping to avoid the extinction of the human race, by ensuring adequate plant life to feed us.
There is no radiative balance. As long as the core is hotter than the surface, it will continue to cool. The surface must follow suit, until the Earth is isothermal beyond the depth affected by the Sun’s influence.
Ah, the rich tapestry of life!
Cheers.
I am heading toward a daughters wedding my self so I liked reading about your payment plan and the out come. I wish many years of happiness to your daughter and her husband.
In terms of the ERL I will read the comments here as they come up and see what I can learn. I can see that some radiation comes directly from the surface via the atmospheric window so ERL might be a non real mathematical concept. However I am still stuck on back radiation.
I have carried out some of my own experiments and it was quite easy to show that a silvered surface reduces radiant heat loss. I think the best way to view that is that the reflector is at the same temperature as the hot body, so no radiant heat transfer can occur. To me that gets rid of the light bulb in front of the mirror thought experiments. Alan Siddons analogy was wrong. However my experiments were not sensitive enough to show any difference between a radiative gas ( 99% CO2) and air as far as heat loss is concerned so the null hypothesis is still alive for green house gases.
Peter Champness September 7, 2016 at 1:10 am
Thanks for your kind wishes. The wedding party was eighteen, all close family. The wedding feast was lovingly cooked by the bride and groom assisted by various family members. The bride cooked her famous “Death By Chocolate” cake. She learned to cook it at 13 when we lived in Fiji, and soon she was selling it by the slice at the local coffee shop. So she baked it as the wedding cake, and she and her sister-in-law-to-be decorated it …

Made with so much love it made my eyes water, now that’s a true wedding cake.
Imagine two blackbody planetoids floating near each other in outer space. Say they are heated internally by radioactive decay, so one is at ten below zero Celsius, and one is at twenty above zero.
By Stefan-Boltzmann, the one at ten below zero is radiating about 270 W/m2, and the one at twenty degrees is radiating about 420 W/m2.
Now, what is the situation between them? Well, they are both radiating photons of infrared energy. Once these photons are emitted, they move through space until they strike and are absorbed by something. Note that the photon’s energy is added to the energy of whatever it hits REGARDLESS OF THE TEMPERATURE OF WHATEVER IT HITS. So as crazy as it sounds, when you light a candle in the daytime, you’re adding to the energy of the sun …
Does this transfer of energy from a candle to the sun violate the Second Law of Thermodynamics? By no means. The Second Law only applies to heat, and heat is the NET energy transfer. And since the sun always warms a candle more than the candle warms the sun, the NET flow of heat is invariably from hot (sun) to cold (candle) as the Second Law requires.
Returning to our two planetoids, one radiating 270 W/m2 and the other 420 W/m2. The NET transfer between them is 430 – 270 = 150 W/m2 from the warmer to the colder planetoid as per the Second Law. However, this is not the physical situation. The physical situation is two separate flows. Your description of this as back-radiation is incorrect, as there is no “front” or “back”. It is simply a description of the physical situation—there are two separate flows of energy. One planet radiates 270 W/m2 (and absorbs 420 W/m2), and the other radiates 420 W/m2 (and absorbs 270 W/m2).
Note that in both cases, the planetoids will end up warmer when placed in close proximity than they would if they were far apart …
Hope that helps,
w.
Willis, you say: Returning to our two planetoids, one radiating 270 W/m2 and the other 420 W/m2. The NET transfer between them is 430 – 270 = 150 W/m2 from the warmer to the colder planetoid as per the Second Law.
I wholeheartedly agree. The net transfer of radiative energy between two bodies that are within view of each other is always in the direction from the warmer to the colder one. Why people cannot grasp this universal truth is beyond me.
It seems almost a daily occurrence on these threads that some well meaning climate skeptic earnestly tries to knock down climate alarmism with the patently invalid argument that the photonic radiation asserted by a cooler body towards a warmer one ‘violates the Second Law’. They think of the bi-directional photon flows involved, as envisaged by statistical thermodynamics, as two independent streams and then concentrate on just the one stream that they are uncomfortable with.
But the streams are not independent. They are always and everywhere locked together by the geometry of the situation. And, since it is always the case that the larger stream offsets the smaller one, there cannot possibly be any physical way in which the cooler body loses energy to the hotter one. ‘Back radiation’ is a term that should be expunged from the lexicon of climate science.
There is also an important bonus concealed in this interpretation of bi-directional photon flow. Taking your example of opposing radiation potentials of 430W/m2 and 270W/m2, which net to an energy flow of only 150W/m2, it is nevertheless the case that the temperature T of each surface is defined through the S-B law by its own radiative potential, irrespective of the value of the opposing radiative potential. This explains an issue that many seem to find puzzling on these threads – how the steady-state temperature of a body through which energy is flowing can seem high even though the rate of flow seems extremely low.
From which truth follows all sorts of good insights: for example, why the surface of Venus seems so very hot even though the power reaching its surface (and the balancing power returning from its surface) is known to be so very low.
Peter,
How are you? As we have discussed privately, radiation experiments are really tough because it is extremely hard to eliminate the effects of reflection and conduction, which tend to overwhelm the results, however hard one tries. So when people, including you and me, have done real experiments, it is easy for others explain them away (one way or the other according to their prejudices).
As you know I discovered this myself when a couple of years ago I constructed what I though was a very carefully designed scientific experiment to prove or disprove the ‘Steel Greenhouse’ thought experiment expounded by Willis, and at the time refuted by Postma, Siddons and several others. The mathematics involved is actually mainstream physics taught in the physics departments of all universities but the issue nevertheless caused much controversy.
In my innocence, I used a cheap vacuum pump to extract the air between the three concentric bodies in my apparatus down to a vacuum of 1mbar, assuming that such a reduction to one thousandth of an atmosphere would be more than sufficient to reduce conduction/convection between the surfaces to negligible proportions. But I found to my dismay that this reduction in pressure had absolutely no discernible effect whatsoever on eliminating conduction/convection – a discovery I only made accidentally when, on one occasion, I failed to run the pump before taking the steady-state temperature measurements of the three bodies and found that the results were unaltered!
There was however a happy end to that story. Some very kind people who run a small vacuum testing company near Bristol allowed me to go down to their premises and hook up my experiment to their industrial vacuum pump. So I was able to pump down to 0.0001mbar (a mere thousand times more rarified!). At this vacuum level conduction/convection was all but eliminated and I was then able to prove definitively that placing an intervening radiative shell between a cooler outer shell and a constantly powered inner shell does indeed cause the temperature of the inner shell to increase, and by an amount that is in line with standard theory.
Just as my experiment was initially ruined by conduction/convection, it would seem that your ‘back radiation’ experiment powerfully demonstrated the effects of reflection. This would certainly overwhelm any radiative transfer that might have occurred between the surfaces (which would have been minimal in comparison if the reflector was reasonably good). Your consequent assumption that a perfect reflector has no effect on the temperature of the source is sound and actually corresponds to common sense. The energy from the emitting device simply returns to it, resulting in no change to its temperature. And, of course, a perfect reflector itself emits no radiation at all.
All the best,
David
Doh! Many years of happiness.
Fixed … w.
Why are posts being silently discarded?
I had a problem with this the other day and was assured that it wasn’t happening. I took it as a glitch at my end because I use a VPN (am in China) and the VPN dropped out at the wrong moment and then reset itself.
It doesn’t like the name smith. mine get disappeared too.
G
Well I can its seems post a one liner, but not a page or so.
Is the point of this post that climate change isn’t happening because none of the scientists have considered this factor?
I’m pretty sure they have and all the other stuff Monckton brings up…
anyway a newlywed man should be thinking about other things…
(It has always bothered me that poet Matthew Arnold wrote his poem ‘Dover Beach while on his honeymoon – google it and see if that’s any frame of mind for a newly married man)
My reading was that it was Willis’s daughter that was married not Willis.
Griff, that shows how much you actually pay attention to what is written …It was his daughters wedding..
….this explains a lot
At a guess, Arnold had thought about the poem for a good while before the honeymoon, but it had not resolved itself in his mind because of the chaos of preparations for the wedding. Once married and on his honeymoon, he could write–and out it came. As a composer of sorts, I have had similar experiences–during complex times, it’s hard to write; once some things are resolved, the writing goes quickly. Also, in respect to Arnold, if the honeymoon had been at or near Dover Beach, he doubtless knew the history of invasions and battles associated with the place, though (as I recall from reading the poem long ago) he treats more the issues within the church at the time of writing than any specific land or sea battles.
Before our daughter’s wedding I calculated the cost of the party and then offered that amount less £100 to the happy couple rather than actually having the party.
Son – in – Law Elect asked “Why the £100 deduction?” I replied, “To buy the ladder for the elopement”.
Daughter said, “Unfair, Dad, we live in a bungalow”.
They went for the party anyway.
Dear Willis,
is the ERL the same as TOA (Top Of Atmosphere)? This it is called (by others) the average height where infrared radiation is going towards space. AFIR, each atmospheric gas has its own TOA, and is influenced by as well by cloud cover. The heigth of (the average) TOA is in th upper troposphere, about 8-10km above the surface.
And some infrared radiation is going out directly from the surface towards space. Can you sort that out?
I think Nick (above) gave Willis a method to sort all that out. Stay tuned.
Willis wrote, What am I missing?
A uniform background radiation in the microwave region of the spectrum is observed in all directions in the sky. Currently it is commonly called the Cosmic Microwave Background or just CMB, alluding to its Wien peak in the microwave region. It shows the wavelength dependence of a “blackbody” radiator at about 3 Kelvins temperature. It is considered to be the remnant of the radiation emitted at the time the expanding universe became transparent at about 3000 K temperature. The discovery of the 3K microwave background radiation was one of the crucial steps leading to the calculation of the standard “Big Bang” model of cosmology, its role being that of providing estimates of relative populations of particles and photons. Research using the Far Infrared Absolute Spectrophotometer (FIRAS) onboard the COBE satellite have given a temperature of 2.725 +/- 0.002 K. Previous experiments had shown some anisotropy of the background radiation due to the motion of the solar system, but COBE collected data showing fluctuations in the background. Some fluctuations in the background are necessary in big bang cosmology to give enough non-uniformity for galaxies to form. The apparent uniformity of the background radiation is the basis for the “galaxy formation problem” in big bang cosmology. The more recent WMAP mission gave a much higher resolution picture of the anisotropies in the cosmic background radiation.The precision of the mapping of the CMB was improved with the Planck satellite, giving the best current values for the descriptive parameters.
The data for the round figure of 109 photons per nuclear particle is the “most important quantitative conclusion to be drawn from the measurements of the microwave radiation background …”(Weinberg p66-70). This allowed the conclusion that galaxies and stars could not have started forming until the temperature dropped below 3000K. Then atoms could form and remove the opacity of the expanding universe; light could get out and relieve the radiation pressure. Star and galaxy formation could not occur until the gravitational attraction could overcome the outward radiation pressure, and at 109 photons/baryon a critical “Jean’s mass” of about a million times that of a large galaxy would be required. With atom formation and a transparent universe, the Jeans mass dropped to about 10-6 the mass of a galaxy, allowing gravitational clumping.
http://hyperphysics.phy-astr.gsu.edu/hbase/bkg3k.html
While there are some radar bands from 1,300 to 1,600 MHz, most microwave applications fall in the range 3,000 to 30,000 MHz (3-30 GHz). Current microwave ovens operate at a nominal frequency of 2450 MHz, a band assigned by the FCC. There are also some amateur and radio navigation uses of the 3-30 GHz range. In interactions with matter, microwave radiation primarily acts to produce molecular rotation and torsion, and microwave absorption manifests itself by heat. Molecular structure information can be obtained from the analysis of molecular rotational spectra, the most precise way to determine bond lengths and angles of molecules. Microwave radiation is also used in electron spin resonance spectroscopy.
For microwave ovens and some radar applications, the microwaves are produced by magnetrons.
Of great astrophysical significance is the 3K background radiation in the universe, which is in the microwave region. It has recently been mapped with great precision by the WMAP probe.
http://hyperphysics.phy-astr.gsu.edu/hbase/ems2.html#c4
Willis,
Nice post, with very nice graphics. I completely agree that a theoretical construct like the effective radiation level are as often as not more misleading than clarifying. The same applies to much of the discussion of the influence of GHG’s in the atmosphere. I find it a bit bonkers to start relating the derivative of a theoretical construct to physical behaviors. I understand the temptation to use such a construct to ‘simplify’ a complex process; such constructs, plus a few arm waves, can ‘explain’ everything, often in the complete absence of understanding of what is actually happening. I think succumbing to that temptation is unwise if the goal is to understand how a change in conditions will change a real physical process. It would be better if people focused more on the actual physical processes involved and less on ‘simplifying’ constructs.
I have challenged the IPCC, United Nations, CSIRO and Dept of Environment and Energy in Australia with the following FREEDOM of INFORMATION REQUEST. Their responses will be used as evidence in the class action that I plan for 2018 by large companies against the Australian government. Those with an understanding of entropy and thermodynamics may wish to read this copy of my FOI request:
FREEDOM OF INFORMATION REQUEST
In light of the matters outlined below, I ask why it is that, in considering the role of carbon dioxide, if any, in affecting Earth’s surface temperature, your Department or organization has apparently not taken into account the effect upon entropy of differing mean molecular gravitational potential energy at different altitudes in the troposphere? That effect causes the state of maximum entropy (that is, thermodynamic equilibrium) with isentropic conditions to have a stable temperature gradient in the troposphere, and that is what explains the fact that the surface temperature is higher than the temperature at the radiating altitude, not any atmospheric radiation. Radiation from carbon dioxide has no effect upon surface temperatures because the impinging Solar radiation is insufficient to explain observed temperatures in the first place.
Additional supporting information is below and in my website* and my 2013 paper Planetary Core and Surface Temperatures linked from that site.
* http://whyitsnotco2.com
The land based data is manipulated by incorrect “homogenization” based on weather stations affected by urban crawl. There is also selective elimination of weather stations that don’t show enough warming. Raw data from some Australian stations in Northern Victoria for example shows no warming in over 100 years. Only satellite measurements are reliable and, as is to be expected, they show no warming since 1998. There is, however, long-term warming of about half a degree per century since the “Little Ice Age” but it can be expected to become about 500 years of long-term cooling before the end of this century if past natural cycles continue.
However, regardless of any warming, carbon dioxide cannot be the cause as there is no valid physics that can give any reason for such. The infant science of climatology (in which there are few with qualifications in physics) has abused the laws of physics and ignored the prerequisites for such laws to apply.
Their first fundamental error was to assume that, in the absence of so-called “greenhouse gases” (1% water vapor, 0.04% carbon dioxide and some others) the Earth’s surface temperature would have been the same as that about 5Km up into the troposphere. This ignores the effect of gravity which (as has been discussed since the 19th century) forms a stable equilibrium non-zero temperature gradient in every planet’s troposphere. Now, in the 21st century, experiments with centrifuges and vortex cooling tubes demonstrate centrifugal force also creating a radial temperature gradient for the same reason that gravity does. Furthermore, a correct understanding of the process of entropy maximization in physics enables us to explain why this happens as gravity acts on molecules between collisions. So there is no need to explain the warmer surface temperature with radiation, and radiation is not the cause thereof.
The second fundamental error is that, in their unnecessary attempts to explain the fact that the surface temperature is warmer than that 5Km above, climatologists have incorrectly assumed that they can just add together the flux of radiation from the Sun and about double that flux from the colder atmosphere. The latter can have no warming effect what-so-ever on the warmer surface, whilst even the solar radiation does not always raise the existing surface temperature, especially in winter and in the early morning and late afternoon. Once again, we can confirm that radiation can not be compounded like that with a simple experiment. We can measure the temperature to which a single electric bar radiator will raise an object and then see if several such radiators achieve the results that climatologists would like to see. They don’t come anywhere near doing so.
Hey everyone, I decided to calculate the average Global Wage.
Using OECD figures I know that the average wage in the USA is thirty two thousand dollars, and the average wage in India is ten thousand dollars, and the average wage in China is seven thousand etc and the average wage in Mali is 103 dollars etc etc etc…after much calculation I calculate the Global Average wage to be $6003.26.
How useful is that!!!
Of course there are a few factors which need to be taken into consideration like for instance these figures only represent those persons of working age…currently in employment and do not include savings…pensions…tax rebates…or social security supplements) (Note: these figures are only only for countries where cash is the dominant mode of transaction…this does not include barter, co-operative sharing of produce or the narco-economy).
I’m sure this figure of $6003.26 is absolutely mathematically correct and can therefore be used in all further calculations.
….and I wonder why they call economics ‘the dismal science’!
It only becomes a science once you provide calculations for an entire century. Bonus points if you adjust the early numbers downwards and bump the later numbers upwards somewhat. Special extra super bonus if you are able to defend those adjustments with a straight face.
I have already alerted the Nobel committee and I am sure your prize is in the mail.
“Both the bride and groom have college degrees in Project Management, and they took over and put on a moving and wonderful event. And you can be sure, it was on time and under budget.”
Well there goes their chance for a government job.
No, the bride and groom work for private companies. They both went to California Poly in San Luis Obispo, and 96% of the graduating Construction Management students there had jobs in the field at $30 an hour and upwards before they left school … including both of them. Cal Poly students are seriously headhunted while still in school.
w.
Just being sarcastic about government never finishing a project on time or under budget.
Last weekend we flew home. It was a cloudless day and I was sitting in a window seat with the Sun shining on my head on the ground. Although warm, it wasn’t really bothersome. Leaving Detroit, we took an ESE departure all the way to cruise altitude and as we climbed out, I noticed my face getting warmer and warmer. After 20 minutes or so we were still on the north shore of Lake Eire and got the Sun and the full reflection of the Sun off the water and had to put the shade down as it was actually burning.
At that altitude the Sun’s reflection was from almost one side of the Lake to the other. It was an impressive amount of radiant energy being sent back into space. I know you can come up with equations to approximate what it is, but throw in partial cloud cover over the Lake or high cirrus blocking the Sun and it is really impossible. I appreciate taking averages over time but to get really granular, I’m not so sure.
This is why open water in the arctic does not lead to a runaway melting by itself.
I’m thinking it’s like saying the Sun’s surface temperature is 5,777 K, when the sun doesn’t really have a surface nor does it have a single temperature. Likewise if the color temperature of the Earth was taken from space through properly calibrated instruments and integrated, we would get an effective average temperature, it follows at some altitude or level the atmospheric temperature would be at the effective average temperature.
Yes, this has already been done and the blackbody temperature of Earth as seen from space is 254.3K
http://nssdc.gsfc.nasa.gov/planetary/factsheet/earthfact.html