Guest Post by Willis Eschenbach
In the comments to Christopher Monckton’s latest post, Nick Stokes drew attention to Soden and Held’s analysis of feedback in the climate models. I reproduce their Table 1 below:

Figure 1. Soden and Held’s Table 1, showing all of the feedback parameters calculated from the models.
I found several amazing things in this table. The first is the huge range of values for the various parameters. While all of the Planck parameters are within a few percent of each other, the lapse rate feedback varies by more than three to one from smallest to largest; the surface albedo feedback varies by nearly five to one; and the cloud feedback varies by an amazing factor of more than eight to one from smallest to largest.
Despite these huge variations, all of them can (relatively) successfully emulate the historical record when they are each fed their own special brand of forcings … which should tell us something about the models. But I digress.
What I want to look at today is the cloud feedback. This is measured as something called the net cloud radiative effect (CRE), which is the sum of the solar and longwave radiation from the clouds. There is general agreement that as a global average the CRE is negative with a value of about -21 W/m2, meaning that in general the clouds cool the earth.
However, there is little agreement about the size or even the sign of the cloud feedback. Cloud feedback is the change in the net CRE that we can expect from a 1°C change in temperature. The models say that cloud feedback is a 0.69 ± 0.10 W/m2 INCREASE in downwelling radiation for each additional degree of temperature. In other words, if there is a small warming, the models say the clouds amplify it to make a large warming. This implies a positive correlation between temperature and the net CRE.
Fortunately, the CERES data can give us actual observational data regarding this question. Figure 2 shows the correlation between temperature and the net CRE.
 Figure 2. Correlation, net cloud radiative effect (CRE) and temperature. Monthly climatology removed before calculation.
Clearly, this is a hugely complex system, where in some parts of the world the correlation is strongly negative, and in some parts it is positive. Note that the inter-tropical convergence zone (ITCZ), which I have long held is a crucial part of understanding the climate, is negatively correlated. And so is the land area north of about 50°N or so.
Overall, we can calculate the global correlation by looking at the global area-weighted average net CRE versus area-weighted global average temperature. Figure 3 shows that result:
 Figure 3. Area-weighted averages of the cloud radiative effect (CRE) and the surface temperature. Monthly averages (climatology) have been removed before calculation.
This is very bad news for the models … they all claim that there is a positive correlation between CRE and temperature, which makes the model-projected warming much larger … but in fact the global average correlation is negative.
And from this same data, of course, we can calculate the global average cloud feedback parameter, viz:
Coefficients:

                   Estimate   Std. Error  t value Pr(>|t|)

(Intercept)       -0.0006277  0.0392260  -0.016 0.987250

(Temperature)     -1.0121541  0.2695399  -3.755 0.000234 ***

---

Signif. codes:  0 ‘***’ 0.001 ‘**’ 0.01 ‘*’ 0.05 ‘.’ 0.1 ‘ ’ 1

Residual standard error: 0.5263 on 178 degrees of freedom

Multiple R-squared:  0.0734, Adjusted R-squared:  0.0682

F-statistic:  14.1 on 1 and 178 DF,  p-value: 0.0002345
The CERES observational data says that for every additional degree of warming, the net cloud radiative effect becomes 1 W/m2 more negative, meaning a cooling effect. So despite the fact that the models claim that the cloud feedback parameter is positive (0.69 ± 0.10 W/m2 per degree C), ugly reality disagrees. According to the CERES data, the real number is not only negative, it is strongly negative ( – 1.0 ± 0.27 W/m2 per °C) and is strongly significant.
Not much more I can say about that, except that it totally confirms my long-held belief that given the amazing stability of the climate system, and my hypothesis about how clouds and thunderstorms regulate the temperature, cloud feedbacks perforce must be net negative, not net positive as the models claim.
Best to everyone, my girlie is getting married in about six hours, I’ll wearing a rented tux and not drinking red wine … wish me luck.
w.
Please be clear about your objections by quoting the exact words you object to, so we can all understand the exact nature of your disagreement.
Given this vast variation in the variables, the fact that the model forecasts are not as closely grouped as is their hindcasts tells you all you need to know about their worth.
Why are the forecasts of the various models so widely spread given the tight grouping of the hindcasts of these very models?
Something very odd is afoot.
A direct comsequence of multiparameter tuning to best hindcast.
Did I just overlook it, or did no one mention Svensmark? His cloud – cosmic ray – solar wind theory seems to tie it all together.
“Svensmark publishes: Solar activity has a direct impact on Earth’s cloud cover”
Thanks, Willis
George Hebbard PE September 4, 2016 at 6:12 pm
George, the problem with Svensmark’s latest paper is simple. The paper claims that we get cloud changes from “Forbush events”, when the number of cosmic rays dip low and then come back up a few days later.
The problem is, the amplitude of the Forbush events is only about HALF of the change in the number of cosmic rays that we see each and every sunspot cycle. So whatever effect they claim is happening in the Forbush events, we should see TWICE that change over the ~ 11 year sunspot cycle.
But we don’t … it doesn’t kill his theory, but it is certainly something that he will need to explain. And to date, as far as I know he hasn’t even acknowledged the problem, much less begun to deal with it.
w.
Well, not necessarily. Forbush are short term, the change over the solar cycle is long term, giving lots of time for the atmosphere to react, or adapt. Sudden change vs slow change.
=========
Kim, I think Willis has a strong observational point. We have ICOADS and ISCCP cloud date for more than one solar cycle. There is no evidence of a solar cycle in that data. None. Essay Cloudy Clouds analyzes the data.
Thanks, Rud, observations trump theory, but a pulse is more easily detected than a slow roll.
===============
kim September 5, 2016 at 5:53 am
While that may be, it simply reinforces my point. If there is some natural adjustment mechanism that neutralizes the effect of the cosmic rays, then they don’t make any difference …
And of course, that fits exactly with my hypothesis that changes in things like the timing of daily emergence of cumulus and thunderstorms and dust devils neutralize not only changes in cosmic rays but changes in forcing of any type …
w.
kim September 6, 2016 at 6:58 am
Huh? if I have a gauge in a lake, whether it takes a year or a day for the lake to drop a foot, I can detect it either way. The same is true for say TSI, or for sunspots. I don’t believe your claim about slow versus fast.
And despite stories to the contrary, boiling frogs slowly does NOT mean that they won’t notice …
w.
Thanks, w; I’m still clinging to the wreckage here. Think of all the vortices possible in the sun-ocean-atmosphere system in which to hide a myriad of tiny changes urged by cosmic rays. I think this can even support your thermostat, even giving it eyes.
I understand your point, too, and since it is better articulated, I’ll yield. For now.
=================
I note in passing that I found in my research reported in “Precipitable Water Redux” that the increased absorption of upwelling surface radiation from water vapor was between three and four W/m2 per degree C of warming. Since half of this goes up and half goes down, that puts the water vapor feedback as being on the order of 1.75 W/m2 per degree C of warmings.
Soden and Held’s value is 1.8 ± 0.05 W/m2 for the water vapor feedback … so in that case CERES basically agrees with the models. It disagrees strongly, on the other hand, with the cloud feedback.
w.
A question Willis.
Are you using the surface temperature data provided by CERES?
Because water vapor feedback could indeed be a lower value if one uses the adjusted surface temperature from the NCDC/NCEI. Using the adjusted surface temperature data as the denominator, I always get around 1.0 W/m2/C.
Maybe the real numbers work but it is a different matter if the temperature trend is exaggerated.
Bill, always good to hear from you. I am using the CERES data. I’m not sure what you are calling “adjusted surface temperature” … adjusted for what?
w.
Interesting observation. But not the entire story, since what matters most is the upper troposphere specific humidity, not all the precipitable water lower down. The effectively constant rUTH with altitude is where the model flaw lies thatbove states WVF.
Water is treated as feedback only in the models. According to modtran there is no radiation looking down in the water bands until you get to nearly 5 kilometers. Also according to modtran when you get to 40km looking down water alone is radiating to space at 329 W/m2, about 97% of TSI.
(This is from an up vs down exercise and the red is looking down. The blue looking up is barely visible in the low wave numbers and amounts to only .17 W/m2 at this altitude)
Ristvan@2:30
If cirrus clouds are transparent to sunlight, how can I see them? Am I completely dumb here. What have I missed?
SiamUR,
Try this: http://www.livescience.com/51576-cirrus-clouds-from-space.html
I’m a little too literal minded I guess.
I think the statement that cirrus clouds are transparent to sunlight needs to be quantified. For example if you have sunny day and an approaching warm front brings a cirrus cloud shield in, there is no doubt this lowers temperatures due to decreased incoming solar. So cirrus clouds are not completely transparent and the thicker the cirrus cloud layer the less solar radiation makes it through. However, I think the word transparent in the case of cirrus is that it allows more energy through it that it allows to escape regardless of the thickness. There are other optical features to consider as well. Some cirrus clouds have near identical crystals and this causes the light to reflect and refract off the ice crystals causing sun halos, sun dogs and icebows. If this light is being scattered or redirected in this way then some must go back into space.
Ice glitters on the edges.
Global Solar Radiation and thus Net Radiation at the ground level are function of bright sunshine hours — in addition to other localised factors –. In the absence of sunshine data, I presented a model to derive sunshine hours from cloud cover — lower, middle and high clouds — [Solar Energy, 1974, 15:281-285, Pergamon Press, Printed in Great Britain].
S = 1 – f1 + f2;
wherein S = n/N is the ratio of actual hours of sunshine to the theoretical duration of sunshine;
f1 = a x e [-0.25√a] — the value in the brackets is exponential of that term]
a = [Cl + Cm + Ch]/8
wherein Cl, Cm & Ch respectively are amounts of low, medium and high clouds, mean of 0830 and 1730 hours IST observations, in Octas, varies between 0 to 1 as sky condition changes from clear [zero octas] to overcast [8 octas] and e is the exponential function
f2 = latitude correction, 0.02 + 0.08 Cos 4φ upto 45 degrees latitude and -0.06 for latitudes beyond 45 degrees latitude, φ is the latitude of the place in degrees
Dr. S. Jeevananda Reddy
“The models say that cloud feedback is a 0.69 ± 0.10 W/m2 INCREASE in downwelling radiation for each additional degree of temperature.”
Another thing with this is that the temperature is about 1 degree warmer now than in preindustrial times, that should give 0.69 ± 0.10 W/m2 increase in the dowelling radiation. However, this is of comparable size to the current global warming by all direct an indirect effects combined:
“Earth’s energy imbalance:
Earth’s energy imbalance measurements provided by Argo floats detected accumulation of ocean heat content (OHC). The estimated imbalance was measured during a deep solar minimum of 2005-2010 at 0.58 ± 0.15 W/m².[11] Later research estimated the surface energy imbalance to be 0.60 ± 0.17 W/m².[12] ”
– Wikipedia: Earth’s energy budget
(This estimate is about the same as several other estimates)
The cloud feed-back effect hypotesized hypotesized by United Nations climate panel, does not leave any room for the direct effect from CO2 and all the other direct and indirect effects the climate panel is so confident about.
I was surprised to see such a weak correlation between CRE and temperature across the interior of Australia, where cloud cover has very large effects on temperature. Max temperature reductions of 20C are not uncommon in summer on cloudy (and rainy) days, and the effect still exists in winter, albeit much smaller.
Which indicates to me that whatever increase in humidity occurs due to rising temperatures is mostly restricted to the already humid areas and the increased humidity quickly precipitates out. Increasing vertical heat transport by the water cycle (a negative feedback), and there is little or no global effect from increased WV.
Anywhere there is a Horse Latitudes High Pressure Zone you are going to have a correlation. It’s the one place where surface warmth and clouds rarely go together. But even there, at times, the Monsoon extends its reach. But that is rare enough that it merely softens the correlation.
Willis:
I wasn’t clear if your results were simply area weighted or also latitude-adjusted ?
Area weighted.
w.
Willis Eschenbach, thank you again for the essay.
At least as interesting as the weighted average is the latitudinal banding.
Willis,
Thanks for an interesting post. The CERES correlation map is particularly interesting, although I can’t get excited about the global regression, as the R-squared is only 0.07.
So far as GCMs go, note that things have moved on since the Soden and Held (2006) feedback analysis of CMIP3 models. For CMIP5, the principal feedback analysis used is per Vial et al (2013), available at: http://citeseerx.ist.psu.edu/viewdoc/download?doi=10.1.1.411.3094&rep=rep1&type=pdf .
Jessica Vial found that much of the warming influence of clouds in CMIP5 models arising from cloud changes increasing the forcing from increased CO2 concentration; see Table 2. As this effect is independent of surface temperature changes, it is classified as a (fast) adjustment and taken into account in the difference between radiative forcing (RF) and effective readiative forcing (ERF) – see the discussion at the start of Ch.8 of IPCC AR5. The surface temperature dependent cloud feedback (Table 3) is then quite small on average (~0.35 W/m2/K), and is negative for a few models.
niclewis: I can’t get excited about the global regression, as the R-squared is only 0.07.
All that means is that a 1C change in mean temp would need to be sustained many years for the multiple-year mean change in CRE to be close to -1. In all of this discussion of CO2 and climate, the interest is in sustained changes in “forcings” and “feedbacks” and their long term effects when R^2 is small for everything of potential interest.
Questions have been proposed regarding why climate models misuse cloud feedbacks. Follow the money (if you can). Models are built on sexy green watermelon grants. My hunch is that natural climate driver model (there is one model, but I believe only one model and it is likely guaranteed to not simulate observations) grants are sooo not sexy, not to mention unavailable. However, the opaque wall between CESM- http://science.energy.gov/ber/research/cesd/regional-and-global-modeling/ -and funding body leanings is nearly impossible to bridge. The careful use of wording keeps the common woman (me) from deciphering the funding bias.
For starters if you have 60 hours to spare, try to find the natural climate model:
http://www.wcrp-climate.org/
Seems like a comment I made must have triggered the nuclear option. Dunno why, but it was up there for a while. Totally benign, and can’t imagine why it would get disappeared, either by accident or by chance or deliberation.
Oh well. Hardly worth reposting.
g
hmmm. I posted. It disappeared. My bad?
“7.2.1.2 Effects of Clouds on the Earth’s Radiation Budget
The effect of clouds on the Earth’s present-day top of the atmosphere
(TOA) radiation budget, or cloud radiative effect (CRE), can be inferred
from satellite data by comparing upwelling radiation in cloudy and
non-cloudy conditions (Ramanathan et al., 1989). By enhancing the
planetary albedo, cloudy conditions exert a global and annual shortwave
cloud radiative effect (SWCRE) of approximately –50 W m–2 and,
by contributing to the greenhouse effect, exert a mean longwave effect
(LWCRE) of approximately +30 W m–2, with a range of 10% or less
between published satellite estimates (Loeb et al., 2009). Some of the
apparent LWCRE comes from the enhanced water vapour coinciding
with the natural cloud fluctuations used to measure the effect, so the
true cloud LWCRE is about 10% smaller (Sohn et al., 2010). The net
global mean CRE of approximately –20 W m–2 implies a net cooling…..”
“TS.6.2 Key Uncertainties in Drivers of Climate Change
• Uncertainties in aerosol–cloud interactions and the associated
radiative forcing remain large. As a result, uncertainties in aerosol
forcing remain the dominant contributor to the overall uncertainty
in net anthropogenic forcing, despite a better understanding of
some of the relevant atmospheric processes and the availability of
global satellite monitoring. {2.2, 7.3–7.5, 8.5}
• The cloud feedback is likely positive but its quantification remains
difficult. {7.2}
• Paleoclimate reconstructions and Earth System Models indicate
that there is a positive feedback between climate and the carbon
cycle, but confidence remains low in the strength of this feedback,
particularly for the land. {6.4}”
Not exactly news.
Willis, congratulations.
I do hope the wedding was a great success and that you are still reveling in all the joy.
Cloud feedback is an issue I’ve struggled to understand.
If I accept that clouds increase downwelling radiation shouldn’t a lot of cloud provide a lot of downwelling radiation? And a lot of cloud for a lot of hours, or even days, should provide the most downwelling radiation, right? So does this mean that if we have cloud cover for 24 hrs a day for ever, the downwelling radiation will increase earth’s temperature? If so, how do we square that with our own experience that cloudy days are invariably cooler than sunny days?
If this is really sophomoric, I apologize, but I can’t for the life of me come up with a simple cocktail party explanation of why, if clouds provide positive temperature feedback, lots of clouds are synonymous with cool days.
Help!
John, at night it is true that clouds have a warming effect, due to downwelling longwave (invisible) radiation.
In daytime, clouds reflect a great deal of incoming solar radiation (i.e., they shade the ground), which has a cooling effect, and that cooling effect greatly exceeds the warming from downwelling longwave radiation.
So, whether clouds warm or cool depends on time of day.
As an additional complication, the effect on temperature of clouds made of ice crystals is different from the effect on temperature of clouds made of water droplets, due to the differing spectra of H2O in its different states.
What’s more, cloudiness varies with time of day. Willis did some especially lovely work on one aspect of that, last year:
http://www.sealevel.info/feedbacks.html#tropicalsst
So the answer to the question of whether clouds warm or cool is, “it depends.”
Yes – and on degree of latitude and season. In winter at higher latitudes the angle of incidence of sun energy during a clear sky is such that albedo restricts service heating. While we may feel warmed by the sun, much of the energy reflects directly back out to space. The ambient temperature in the shade is low, even at midday.
I know this through personal experience as a grassland farmer. During the 3 months of winter grass growth is always higher during periods of cloudy days than sunny days. This is due to soil temperatures which are higher during cloudy weather and at their lowest during periods of sunny days and cold nights (frosts). We never get frosts under a cloudy sky
I think that those that study such things may get stuck in what occurs in the tropics. The cooling mechanisms are at their most effective at higher latitudes
There is a lot of ‘yes but’ in this topic
Regards
M
daveburton, thank you and Michael Carter for your replies. They’re helpful.
But, in the end, as Willis points out, “they (the models) all claim that there is a positive correlation between CRE and temperature, which makes the model-projected warming much larger”. His data analysis says the opposite and that, at least to me, makes more intuitive sense.
Mr. Eschenbach:
You state that the models “…claim that there is a positive correlation between CRE and temperature,
which makes the model-projected warming much larger … but in fact the global average correlation is negative.” It seems to me me that this statement confuses the global average surface temperature with the global average temperature at equilibrium. As the latter quantity is not observable it seems to me that the claim of a positive correlation is not amenable to testing.
Wow, Willis, I cannot believe the volume and breadth of the comments on this quite concise post. (Which I enjoyed, by the by)
Congrats Willis.
Willis – take a look an this
http://milesmathis.com/tilt.pdf
http://milesmathis.com/tilt2.html
http://milesmathis.com/season.pdf
for willis
http://milesmathis.com/equat.pdf
http://milesmathis.com/core.pdf
I am late to this party as I have been hiking, but I have a few issues with the lead post.
This falsely assumes that all the change in global average CRE is caused by only temperature changes. Willis and the climate modelers assume that clouds change only by a temperature change, which is a feedback. But clouds change for other reasons, which cause a temperature change, which is a forcing. Dr. Roy Spencer has written extensively about cloud changes causing temperature changes, which contaminates the correlation of clouds to temperature when estimating feedbacks. Clouds change in response to ocean circulation changes, resulting in forcings. The huge amount of noise in the cloud and temperature correlation is due to cloud changes unrelated to temperature changes.


Willis shows a graph of CRE and HadCRUT4.4 temperatures from March 2000 to February 2015. The CERES data is available to May 2016. Here is a graph of CRE, HadCRUT4.4 and UAH LT temperature data to May 2016:
Figure 3 shows “correlation = – 0.27”. The table of Coefficients says “Std. Error” of temperature is 0.2695, and the slope of the correlation is -1.012 W/m2/°C. Shouldn’t Figure 3 say “Correlation coefficient = -1.012 W/m2/°C. Std. Error = 0.27” ?
The table shows “Multiple R-squared: 0.0734, Adjusted R-squared: 0.0682”.
Could someone please explain the difference in meaning between the Multiple and Adjusted version of R-squared?
The correlation plot of CRE and HadCRUT4.4, data to Feb 2015 is here;
It shows R-squared is only 0.0327 as calculated by Excel, which is much less than reported in the in the lead post. The relation is -0.876 W/m2/°C, which is less than the -1.012 W/m2/°C reported by Willis. Why is there this different?
Using all the available CERES data with HadCRUT4.4 gives R2 = 0.0145, which is very poor. The relation is -0.444 W/m2/°C as shown here:
The HadCRUT4.4 data is hopelessly contaminated by the urban heat island effect as shown by many studies. The study by McKitrick and Michaels shows that almost half of the warming over land in instrument data sets is due to the UHIE. A study by Laat and Maurellis 2006 came to identical conclusions. The satellite lower troposphere temperatures should be used.
Using UAH lower troposphere temperatures, the R2 jumps up to R2 = 0.108, and the relation is -1.047 W/m2/°C as shown here:
Data and graphs are at:
https://www.friendsofscience.org/assets/files/CRE_CERES.xlsx
Climate modelers noted the cloud cover declined from 1986 to 2000 while surface temperatures rose, and falsely assumed that only the temperature change caused the cloud cover to change, so they estimated a strong positive feedback. Here is the Climate4you graph of cloud cover:
http://www.climate4you.com/images/CloudCoverTotalObservationsSince1983.gif
and here is the correlation plot from July 1983 to Dec. 2009:
http://www.climate4you.com/images/TotalCloudCoverVersusGlobalSurfaceAirTemperature.gif
Note that the correlation shows a relation of -0.66 °C/%change cloud cover. If one (falsely) assumes the cloud cover changed only due to the temperature change, this would imply a strong positive feedback. (I don’t know how to get CRE values before CERES data, but I assume CRE is highly correlated with cloud cover.) Climate4you correctly said that global cloud cover increase is empirically “associated with” a global temperature decrease, but did not call it a feedback.
The cloud feedback should not have changed between the 1980 – 2009 period and the 2000 – 2015 period. The fact that the cloud – temperature correlation changed dramatically proves that the cloud changes are not only caused by a temperature change, or feedback, but are also caused by forcings. The CERES CRE data is a combination of feedback in forcing in unknown proportion.
TNX.
====
Ken Gregory: Figure 3 shows “correlation = – 0.27”. The table of Coefficients says “Std. Error” of temperature is 0.2695, and the slope of the correlation is -1.012 W/m2/°C. Shouldn’t Figure 3 say “Correlation coefficient = -1.012 W/m2/°C. Std. Error = 0.27” ?
It is a coincidence that the correlation and the standard error of the regression coefficient have the same 2 leading digits. the value of -1.012 is the slope (b) of the equation y = a + b*x from the computer output; with y being cloud radiative effect and x being temperature (the slope of the temperature effect is labeled “temperature” in the output.) So, Figure 3 is correctly labeled.
Note that the correlation shows a relation of -0.66 °C/%change cloud cover. If one (falsely) assumes the cloud cover changed only due to the temperature change, this would imply a strong positive feedback.
How is that a positive feedback?
matthewrmarler;
How is “correlation = – 0.27” correct? The correlation table provide does not show this number anywhere. It isn’t the slope of the regression line. It isn’t a correlation coefficient. What is it and how was the -0.27 value determined?
Oop, my typo. I should have wrote “Note that the correlation shows a relation of -0.066 °C/%change cloud cover.” Not -0.66. This is from the equation on the chart “Y= -0.06591 * X + 19.6378” and is the slope of the regression line. It says that a -0.066 °C change in temperature is associated with a 1% point change in cloud cover. If the temperature change caused the change in cloud cover, then a temperature increase of 0.066 °C caused a 1% point reduction in cloud cover, which allows more sunlight in to heat the earth’s surface. If an increase in CO2 caused an initial temperature increase, then cloud cover would decrease, allowing in more sunlight causing a further temperature increase, thereby amplifying the initial temperature change. That is a positive feedback.
However, the CERES data from March 2000 to May 2016 shows the opposite effect. It shows an increase in temperature of 1 °C caused a 1.05 W/m2 decrease in CRE, which implies that the cloud cover increased, assuming that the CRE and cloud cover changes are due to the temperature change. The CRE becomes more negative when cloud cover increases. The increase in clouds block some sunlight from the earth, causing a temperature decrease that offset some of the initial temperature increase. That is a negative feedback. But cloud feedback can’t change sign between the two periods, proving that the initial assumption that the cloud changes were cause by only the temperature change is incorrect. The correlation does not determine the cloud feedback factor. As per Dr. Spencer’s work, the changes in ocean circulation caused some of the cloud changes. See;
http://www.drroyspencer.com/2013/11/our-new-paper-el-nino-warming-reduces-climate-sensitivity-to-1-3-deg-c/
Regarding the statement that the satellite lower tropospheric temperature data should be used because McKitrick & Michaels shows almost half the land warming to be from growth of UHIs: If the land component of HadCRUT4 is reduced by half, HadCRUT4 would still show more warming than the satellite datasets of the lower troposphere show. This is because an increase of greenhouse gases increases the lapse rate. Figure 7 in http://www.drroyspencer.com/2015/04/version-6-0-of-the-uah-temperature-dataset-released-new-lt-trend-0-11-cdecade/ shows the near-surface temperature warming more than the lower troposphere as a whole as indicated by radiosondes.
I showed that the large decline in cloud cover % from 1986 to 2000 suggests that this is a positive cloud feedback if one falsely assumes that the cloud declined only due to the rising temperatures during the period. However, the CERES data from March 2000 to May 2016 shows the opposite effect when comparing cloud radiative effect CRE) to temperature. It shows an apparent negative cloud feedback. I wrote, “I assume CRE is highly correlated with cloud cover.” I couldn’t find cloud cover on the CERES page, but the CERES help wrote me “We have both cloud coverage and cloud radiative effect (CRE) top-of-atmosphere and surface fluxes available”. Here is a plot of cloud cover vs CRE;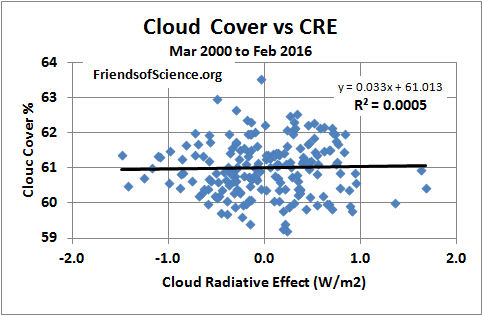
Wow! It shows for the period 2000-03 to 2016-02 there is a coefficient of determination R-squared = 0.0005. I know that clouds have different layers that behave differently, but this low R2 is surprizing to me.
I should have plotted cloud cover % anomaly vs CRE anomaly, rather than cloud cover %.
The R2 increases to 0.0013, which is still very low! This is still surprizing. Why is it so low?
More evidence from boots on the ground
Further to my posts above that discusses the importance of land surface albedo at latitude 37 Sth during clear skies in winter (enhanced cooling as compared to cloud insulation)
During clear sky weather, paddocks that slope to the north (sun direction) > 15 degrees grow 3 x more grass then those that are flat or slope to the south. How do I know? Through the number of sheep I can run/hectare/paddock. This relates directly to soil temperature
The only conditions in which the flat/sth-sloping paddocks will grow grass is cloudy weather with periodic rain. Cloud does NOT always equate to cooling
Field observation still has a place in science
Spring has arrived and summer not far off. I am going to be following the NZ Metservice forecasts throughout summer.. I believe that I may be able to demonstrate that cloud cover in summer can also be higher in mean daily temperature than clear-sky conditions. This is due to rapid night-time cooling
Clouds are Nature’s heat sinks. CuNim are tower heat sinks. As such, Nature’s heat sinks take the heat up off of “the board” and get it to where it can dissipate into space.
Thanks, James. I’ve compared CuNim towers to “heat pipes” instead of “heat sinks”, because the warm moist surface air passes through them from surface to upper troposphere without exchanging significant radiant energy with the surrounding atmosphere.
w.
“warm moist surface air passes through them from surface to upper troposphere without exchanging significant radiant energy with the surrounding atmosphere”.
More efficiently than during clear sky conditions at night? At any given time half the globe is in darkness and much of this surface area has no cloud. According to the cloud = cooling theory these conditions always contribute to warming. It don’t equate. The theory is too simplistic (IMO).
Regards
M