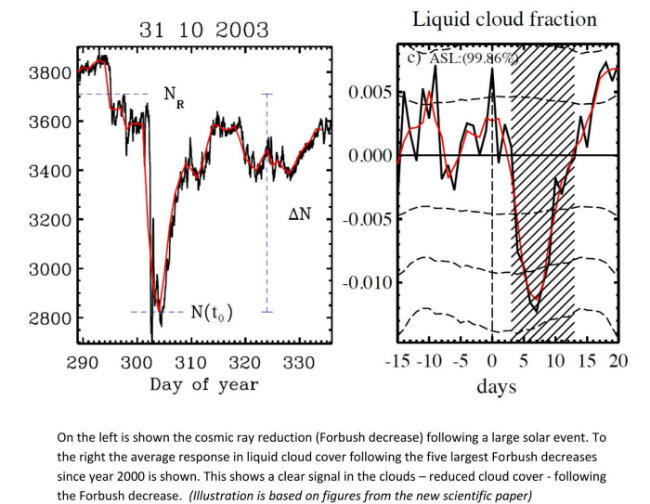
Solar variations affect the abundance of clouds in our atmosphere, a new study lead by DTU Space suggests. Large eruptions on the surface of the Sun can temporarily shield Earth from so-called cosmic rays which now appear to affect cloud formation. A team of scientists from the National Space Institute at the Technical University of Denmark (DTU Space) and the Racah Institute of Physics at the Hebrew University of Jerusalem has linked large solar eruptions to changes in Earth’s cloud cover in a study based on over 25 years of satellite observations.
The solar eruptions are known to shield Earth’s atmosphere from cosmic rays. However the new study, published in Journal of Geophysical Research: Space Physics, shows that the global cloud cover is simultaneously reduced, supporting the idea that cosmic rays are important for cloud formation. The eruptions cause a reduction in cloud fraction of about 2 percent corresponding to roughly a billion tonnes of liquid water disappearing from the atmosphere.
Since clouds are known to affect global temperatures on longer timescales, the present investigation represents an important step in the understanding of clouds and climate variability.
”Earth is under constant bombardment by particles from space called galactic cosmic rays. Violent eruptions at the Sun’s surface can blow these cosmic rays away from Earth for about a week. Our study has shown that when the cosmic rays are reduced in this way there is a corresponding reduction in Earth’s cloud cover. Since clouds are an important factor in controlling the temperature on Earth our results may have implications for climate change“, explains lead author on the study Jacob Svensmark of DTU.
Very energetic particles
“Since clouds are an important factor in controlling the temperature on Earth our results may have implications for climate change”
Galactic cosmic rays are very energetic particles originating mainly from super novae.
These particles generate electrically charged molecules – ions – in Earth’s atmosphere. Ions have been shown in the laboratory to enhance the formation of aerosols, which can serve as seeds for the formation of the cloud drops that make up a cloud. Whether this actually happens in the atmosphere, or only in the laboratory is a topic that has been investigated and debated for years.
When the large solar eruptions blow away the galactic cosmic rays before they reach Earth they cause a reduction in atmospheric ions of up to about 20 to -30 percent over the course of a week. So if ions affect cloud formation it should be possible to observe a decrease in cloud cover during events when the Sun blows away cosmic rays, and this is precisely what is done in this study.
The so-called ‘Forbush decreases’ of the cosmic rays have previously been linked to week-long changes in Earth’s cloud cover but the effect has been debated at length in the scientific literature.
The new study concludes that “there is a real impact of Forbush decreases on cloud microphysics” and that the results support the suggestion that “ions play a significant role in the life-cycle of clouds”.
Arriving at that conclusion was, however, a hard endeavor; Very few strong Forbush decreases occur and their effect on cloud formation is expected to be close to the limit of detection using global atmospheric observations measured by satellites and land based stations. Therefore it was of the greatest importance to select the strongest events for study since they had to have the most easily detected effect. Determining this strength required combining data from about 130 stations in combination with atmospheric modeling.
This new method resulted in a list of 26 events in the period of 1987-2007 ranked according to ionization. This ranked list was important for the detection of a signal, and may also shed some light on why previous studies have arrived at varied conclusions, since they have relied on events that were not necessarily ranked high on the list.
Possible long term effect
The effect from Forbush decreases on clouds is too brief to have any impact on long-term temperature changes.
However since clouds are affected by short term changes in galactic cosmic radiation, they may well also be affected by the slower change in Solar activity that happens on scales from tens to hundreds of years, and thus play a role in the radiation budget that determines the global temperature.
The Suns contribution to past and future climate change may thus be larger than merely the direct changes in radiation, concludes the scientists behind the new study.
Source: http://www.dtu.dk/english/News/Nyhed?id=b759b038-66d3-4328-bbdc-0b0a82371446
The full reference to the new paper is: J. Svensmark, M. B. Enghoff, N. J. Shaviv, and H. Svensmark, “The response of clouds and aerosols to cosmic ray decreases”, Journal of Geophysical Research – Space Physics, 2016, DOI: 10.1002/2016JA022689.
Click here or here to access the abstract and full scientific paper.
Related: (via the Hockey Schtick)
Solar physicist Dr. Leif Svalgaard has revised his reconstruction of sunspot observations over the past 400 years from 1611-2013. Plotting the “time integral” of sunspot numbers from Dr. Svalgaard’s data shows a significant increase in accumulated solar energy beginning during the 1700’s and continuing through and after the end of the Little Ice Age in ~1850. After a ~30 year hiatus, accumulated solar energy resumes a “hockey stick” rise for the remainder of the 20th century, followed by a decline beginning in 2004, all of which show remarkable correspondence to the HADCRU3 global temperature record:

“The most obvious way for warming to be caused naturally is for small, natural fluctuations in the circulation patterns of the atmosphere and ocean to result in a 1% or 2% decrease in global cloud cover. Clouds are the Earth’s sunshade, and if cloud cover changes for any reason, you have global warming — or global cooling.”
Leif – A quick question. Are graphs like the one I have linked to below just BS? I first came across the notion that sunspots have a weather influence back in my graduate school days in an economic history class. In the mid-1800’s there was work correlating wheat prices to sunspots. The reason Supply/Demand graphs have quantity on the horizontal axis is that agricultural output was considered the independent variable and prices adjusted to clear the market. I found the sunspot theory interesting, but.. Today, time series models dominate the study of macro-economic theory. Structural economic models have had little success in predicting business cycle dynamics.
Thanks
http://a-sceptical-mind.com/wp-content/uploads/2010/01/Cosmic-rays-ice-ages.jpg
n. Are graphs like the one I have linked to below just BS?
They are highly uncertain and speculative. Pretending they are not is BS.
How constant is the galactic cosmic ray flux over long (millennia) periods of time?
How constant is the galactic cosmic ray flux over long (millennia) periods of time?
The galactic cosmic ray flux is very constant over millennia. But the flux that reaches the atmosphere is not, because it depends on the screening by the Earth magnetic field, which changes a lot with time. Even goes away at times.
Mr. Svalgaard, I suppose you studied a possible influence of the Earth magnetic field on the Climate as well. Could you tell us whether you’ve found something interesting / important to know?
As long as it’s not ‘BS’… RE: Beryllium-10, 10be can come from the planets in our own solar system.
No Sparks, it cannot.
10be can be produced in Earth’s atmosphere from radiation of planets.
No, 10Be is produced by Galactic Cosmic Rays.
Radiation drawn in from the so-called “gas giants” by the sun at solar minimum is more than enough to explan 10be on earth, regardless of climate. what is your opinion Leif?
‘Opinion’ dosn’t count here. Facts do. And the fact is that 10Be is created by by rather high energy Galactic Cosmic Rays. Not by ‘Jupiter Rays’. End of discussion.
“Jupiter rays”?? You know I’m correct! how does Jupiter know to draw in Galactic Cosmic Rays? How does the sun know?
Leif, high energy Galactic Cosmic Rays are produced in a galaxy far far away. Apparently! just saying.
Galactic Cosmic Rays [creating 10Be] are produced in out Galaxy.
[“In and outside” of the galaxy? Or “Inside our galaxy”? .mod]
The planets that orbit all this “Galactic Cosmic Rays” produce more radiation.
As I said: end of discussion.
The planets produce more radiation than the galactic background does.
Sparks, GCRs are near light speed particles that have mass that can tear apart basic matter upon impact. Radiation is photons which at best have the energy to kick out an electron every now and then.
Can we keep the discussion on high-energy physics and how it does cause the creation of high-energy ions in the atmosphere and how those high energy ions might impact CCN formation, which affects clouds, which affects climate.
Leif, I’ve read all your comments (I believe). I believe they all rely on 20th century data. In my opinion the CERN CLOUD experiment results support fairly strongly that the Svensmark hypothesis was operational prior to fossil-fuel burning becoming common (ie. before the industrial age). That would mean the hypothesis appears to be operational for 100’s of millions of years ending around 1850. Do you have any rebuttal to that statement? (i.e using 19th century and older data.)
https://home.cern/about/updates/2016/05/cloud-shows-pre-industrial-skies-cloudier-we-thought
“CLOUD has also found that ions from galactic cosmic rays strongly enhance the production rate of pure biogenic particles – by a factor 10-100 compared with particles without ions. This suggests that cosmic rays may have played a more important role in aerosol and cloud formation in pre-industrial times than in today’s polluted atmosphere.”
http://www.nature.com/nature/journal/v533/n7604/full/nature17953.html
“We find that ions from Galactic cosmic rays increase the nucleation rate by one to two orders of magnitude compared with neutral nucleation. Our experimental findings are supported by quantum chemical calculations of the cluster binding energies of representative HOMs. Ion-induced nucleation of pure organic particles constitutes a potentially widespread source of aerosol particles in terrestrial environments with low sulfuric acid pollution.”
That would mean the hypothesis appears to be operational for 100’s of millions of years ending around 1850.
We don’t really have reliable data for those 100’s of millions of years, let alone the last few hundred before 1850, so it must all just be conjecture or beliefs, not much science.
>>That would mean the hypothesis appears to be operational for 100’s of millions of years ending around 1850.
>We don’t really have reliable data for those 100’s of millions of years, let alone the last few hundred before 1850, so it must all just be conjecture or beliefs, not much science.
I assume that lack of basic science knowledge is why a budget over $6B Euros was put in place to cover the 2008-2016 CLOUD experiment :
http://cordis.europa.eu/project/rcn/88279_en.html
http://cordis.europa.eu/project/rcn/104657_en.html
They have recreated in the lab pre-1850’s conditions and found GCRs are an important amplification factor in seeding clouds with CCNs.
Seems something worthy of paying attention to.
I assume that lack of basic science knowledge is why a budget over $6B Euros was put in place to cover the 2008-2016 CLOUD experiment :
Perhaps you are off by three orders of magnitude…
>> I assume that lack of basic science knowledge is why a budget over $6B Euros was put in place to cover the 2008-2016 CLOUD experiment :
> Perhaps you are off by three orders of magnitude…
I did mis-read it. Probably confirmation bias on my part (ie. $6M Euros seems too small to be right.)
Surely that $6M Euros doesn’t cover the actual experiment. I wonder what CERN’s contribution was?
I will get back to you gregfreemyer enjoyed your insight of stupid, but for now I’ll leave you with this.
https://youtu.be/IFUjwj_RB5o
Sparks, My funding quotation error doesn’t change the fact that the CERN CLOUD experiment is widely recognized as the best experiment out there attempting to investigate GCR effects on cloud formation, and so far they have shown the proposed mechanism is real (in the absence of sulfuric acid pollution).
So please do address the science.
All energy in our solar system [- +] is dragged toward the sun whether it’s from a Planet or the rest of the universe, it is still energy travelling from A to B.
There is evidence of fluctuation in GCR flux over millions of years, at least, thanks to 60Fe records in deep-sea, ferromanganese crust, and variation in the production rate of stable, cosmogenic radionuclides, such as 21Ne, and radioisotopes with different half-lives, such as our old friend 10Be, 26Al and 53Mn.
Equating such variation with climatic and evolutionary events on earth however is difficult, although attempts have been made. For instance, GCRs might have been relatively more important as cloud condensation nuclei during the Cretaceous, when biological CCN production was low, thanks to amazingly hot oceans.
For instance, GCRs might have been relatively more important as cloud condensation nuclei during the Cretaceous, when biological CCN production was low, thanks to amazingly hot oceans.
So apparently, the effect of GCRs was not cooling the Earth much back then…
They would have cooled the earth by making more clouds, but not enough to counteract the effects of highly active seafloor spreading and the other phenomena then of the lithosphere on the atmosphere and biosphere. Earth at that time had no permanent ice and cold-blooded reptiles live at high latitudes.
GCRs can’t go it alone, but they can have big effects at the margins.
not enough to counteract the effects of highly active seafloor spreading
Such as much more CO2?
There was more CO2 in the Cretaceous, but not nearly enough to account for the observed or inferred heat. Running GCMs for the mid-Cretaceous needs an ECS of something like 6.0 even to get close, and then still can’t explain the equanimity, ie lack of difference between the equator and poles.
That’s why paleoclimatologists have turned to clouds. The GCMs don’t take sufficient stock of them. But when you assume less cloud cover due to lower biological CCN production in the hot oceans, Cretaceous climate can be better modeled. CO2 was an effect of higher temperatures, not the primary cause.
However, if you crudely apply the best estimates for average CO2 and average temperature over the whole Period, you get an ECS under 2.0. Mean CO2 for the whole, long Period is estimated to have been around 1700 ppm, with GASTA some four degrees higher than now (18 v 14 degrees C). So more than two doublings from the present 400 ppm “forced” only four degrees gain, ignoring all the more important other variables.
The fit is even worse for other geological periods.
One of the cloud “experiments” via modeling, from 2008:
https://chriscolose.wordpress.com/2008/04/13/the-uncloudy-cretaceous/
Original Science article requires subscription, but abstract is available on line. I was unable to download a .pdf of the it.
The Cretaceous actually started out cooler than the Mesozoic average, because there was an Ice House interval at the Jurassic-Cretaceous boundary. Ice sheets didn’t form as in the other Ice House phases, which occur at about 150 million year intervals, because of the prevailing warmth.
But later in the Early Cretaceous Epoch and in the beginning of the Late Cretaceous, earth was as hot as at any time during the Phanerozoic. Toward the end of Late Cretaceous, climate cooled again, but not as much as at the end of the Late Jurassic.
During the mid-Cretaceous (which should have its own epoch, but doesn’t), the oceans invaded the land to such an extent that an inland sea stretched from the Gulf of Mexico to the Arctic Ocean. Naturally, CO2 came out of solution in such hot water, but, as noted, the atmospheric increase was more an effect of the climate than a cause.
i do not understand the logic of this:
“The solar eruptions are known to shield Earth’s atmosphere from cosmic rays. However the new study, published in Journal of Geophysical Research: Space Physics, shows that the global cloud cover is simultaneously reduced, supporting the idea that cosmic rays are important for cloud formation. The eruptions cause a reduction in cloud fraction of about 2 percent corresponding to roughly a billion tonnes of liquid water disappearing from the atmosphere.”
because failure to nucleate water vapor does not imply a reduction of water vapor
because if clouds cause cooling and there are no clouds then it should be warmer – and warmer means more water vapor can be held in the atmosphere and warmer means more water vapor is generated, too.
Fog??
Prof. Brian Cox, I can sense that the time for your apologies to senator Malcolm Roberts and Australian ABC’s QandA audience is coming. Can you sense it, too?
So you haven’t read Leif’s posts then?
I haven’t overread them either. Forbush events barely affect atmospheric temperatures. How GCRs affect ocean temperatures and climate is unknown, but ‘barely’ shows a mechanism. Hark for’ard!
===============
I can’t access the paper – the Dropbox connection keeps being “reset while the page was loading”. Anyone got a better link?
https://dl.dropboxusercontent.com/u/51188502/Forbush_long_JGR_rev3_nored.pdf worked fine for me
Well, thanks for the link, but the connection got dropped for me again. I’ll put it down as one of the web’s wonders, and wait ’til it turns up somewhere else.
Those Svensmark Effect-based climate models might still turn out to be close to the mark.
http://i.imgur.com/jOLMXcP.gif
By the end of 2021 I’ll know if my prediction was seriously off-track or still in the right ballpark.
By 2030 we will have a more accurate assessment of how much solar activity affects climate on decadal scales.
After reading the comments on this blog it became painfully clear that there is absolutely zero chance that 97% of scientists could even agree on what day it is , much less the driving causes of climate change.
Make that 97.99%. Tell everyone else to do the same.
Cosmic rays don’t affect cloud formation, they affect vapor albedo. Sunlight generating thermal energy in water masses that evaporate affects cloud formation.
Vapor isn’t a cloud, it is a vapor. So yes, cosmic rays increase albedo from water vapor but they do not make clouds. I see it all the time down in Florida. Same clouds whether I can see the blue or not.
This is a failure in translation that’s being used as an argumentation point.
Can’t help it, that sounds pretty confused to me. Sorry.
The strongest ionization is over the polar circles, and not over the equator.
http://sol.spacenvironment.net/nairas/Dose_Rates.html
The strongest ionization is in lower stratosphere (about 15 km).
The strongest impact GCR refers to changes in temperature in the lower stratosphere.
http://www.cpc.ncep.noaa.gov/products/stratosphere/strat_a_f/gif_files/gfs_toz_sh_f00.png
Here is a visible influence of Earth’s magnetic field.
http://www.cpc.ncep.noaa.gov/products/stratosphere/strat_a_f/gif_files/gfs_z05_sh_f00.png
GCR has a big impact on climate change, because ozone accumulates in the high latitudes and there runs ionization GCR.
http://www.ospo.noaa.gov/data/soundings/atovs/profiles/RODF_RT_20_noaa19_D1_t1.png
Does it not make a difference whether the clouds are formed during the day(cooling) or formed at night (warming) and at what altitude ? Just curious…..
Or maybe we are just missing a very big piece of the puzzle….For example…
“UCI physicists confirm possible discovery of fifth force of nature”
https://news.uci.edu/research/uci-physicists-confirm-possible-discovery-of-fifth-force-of-nature/
The current state of science on clouds:
“I’ve looked at clouds from both sides now
From up and down and still somehow
It’s cloud illusions I recall
I really don’t know clouds at all”
From the song, “Both Sides Now”
“Rows and flows of angel hair And ice cream castles in the airAnd feather canyons everywhere, I’ve looked at clouds that way.”
From the same song. Also fits some of this discussion quite well, though I am finding it enjoyable in any event.
As I have pointed out there are many factors that determine global cloud coverage it is not just galactic cosmic rays therefore unless the values for GCR reach high threshold values for a sustained period of time it will be hard to see a correlation.
The same can be said when the sun is in it’s normal 11 year so called sunspot cycle very hard to see the solar/climate connections.
Some that try in vain to say a solar/climate connection does not exist try to isolate a given solar parameter versus the climate as an x change in one will equal an x change in the other and treat it as if it is in isolation which is misleading.
As far as the data in my opinion it proves that the current climate is in no way unique ,it shows each and every time there is a prolonged solar minimum period the global temperature response is down and vice versa .
I have laid out the extreme solar parameters which I think will bring global temperatures down which up to today since the ending of the Dalton Minimum have not taken place except for a brief period of time between years 2008-2010, therefore we did not have any cooling or any other notable solar effects versus the climate through out that entire time period, which I have said time and time again would be the case. The solar effects are there however, but normal climate noise obscures them to the point where no real pattern can be discerned.
Once my solar values are reached and sustained which I have posted many times only then will the solar/climate connections start to show up in a more obvious way. At that point the solar effects should be able to rise beyond the normal climate noise which is in the climatic system.
I expect this is happening now ,and I think this time the duration of the low average value solar parameters I have called for moving forward will be long enough so that a more definite solar/climate connection will start to be realized.
We should find out as we move ahead.
lsvalgaard
August 25, 2016 at 3:36 pm
“The past several solar cycles, the sun has become quieter and cosmic rays have increased, which should have cooled the climate. Instead it has warmed. So, no evidence of a significant GCR influence.
~~~~~~~~~~~~~~~~~~~~~~~
When Leif says “it has warmed”, he means the mathematical abstraction called “global average temperature” built from cooked books involving Orwellian adjustments to past records shows recent warming, being the post-modernist socially-constructed version of “warming,” in which the total volume of ice observed in a system can increase even while the mythical system-average temperature rises at an alarming rate.
In fact, the weather associated with the onset of the deep solar minimum sent climatologists and their huge flock of media representatives into a bipolar frenzy, as anyone with a memory that extends further into the past than the most recent news cycle would know.
Astronomy Picture of the Day
September 24, 2008
Why has the Sun been so quiet recently? No one is sure. Our Sun has shown few active regions — that house even fewer associated sunspots — for over a year now, and such a period of relative calm is quite unusual.
==============
A First! Snow Falls in Baghdad
By CHRISTOPHER CHESTER (AP)
Jan 11, 2008
==============
Arctic blast brings London earliest snow for 70 years
Mark Prigg (Evening Standard)
Oct 10, 2008
It is a sight not seen in the capital since 1934.
Londoners today woke up to the earliest snow cover for more than 70 years as a freezing blast of wind from the Arctic hit the capital.
==============
Spokane, Washington., residents cope with record snow
By NICHOLAS K. GERANIOS (AP)
Jan 7, 2009
SPOKANE, Wash. (AP) – More than 6 feet of snow in the past three weeks has left Spokane residents frustrated. Tempers are so frayed that a man was arrested for shooting at a snow plow operator.
==============
The day the sea froze: Temperatures plunge to MINUS 12C and forecasters say it won’t warm up until Sunday
Daily Mail
Jan 8, 2009
Temperatures plunged so low yesterday that the sea actually began to freeze as Arctic conditions continued to grip the UK.
In the exclusive enclave of Sandbanks in Poole, Dorset, a half-mile stretch along the shoreline reaching about 20 yards out to sea is covered in ice.
==============
Beijing’s Heaviest Snow in 54 Years Strands Thousand
Bloomberg News
Nov 12, 2009
[…] In Beijing, snowfall is the heaviest since weather data began in 1955, according to the administration’s Web site.
============
Heavy snow continues as temperatures set to plunge minus 20C
Herald, Scotland
Jan 6, 2010
Heavy snow has brought more chaos to parts of Scotland amid warnings that temperatures could plunge to minus 20C this weekend.
The prolonged Arctic blast is now the worst cold spell seen in Scotland for almost 50 years, according to the First Minister.
============
Quiet sun puts Europe on ice
New Scientist
May 4, 2010
===========
‘Polar vortex’ grips the US in coldest temperatures in decades
Telegraph.UK
Jan 04, 2014
The United States is spending the first days of 2014 in the grips of record-breaking cold and snow as freezing Arctic winds sweep across the country.
===========
Niagara Falls frozen: tourists flock to see icy spectacle
Guardian
January 13, 2014
===========
Scientists: Don’t make “extreme cold” centerpiece of global warming argument
WaPo
February 20, 2014
===========
Historical Great Lakes Ice Cover
NCDC/NOAA
March 2, 2014
===========
Niagara Falls comes to a halt AGAIN
DailyMail
March 4, 2014
===========
Great Lakes covered in record-shattering amount of ice this late in spring
WaPo
April 23, 2014
===========
US weather in pictures: ‘Polar vortex’ brings big freeze to North America
Telegraph UK
Aug 13, 2014
===========
Stunning satellite images show [Arctic] summer ice cap is thicker and covers 1.7million square kilometres more than 2 years ago…despite Al Gore’s prediction it would be ice-free by now
DailyMail
August 31, 2014
===========
Antarctic Sea Ice Reaches New Record Maximum
NASA
October 7
===========
Cold winters have been caused by global warming: new research
Climate sceptics often claim that recent icy winters show that global warming is not happening. New research suggests the opposite is true.
Telegraph.UK
Oct 27, 2014
===========
Earliest ice on record appears on Great Lakes
CBC,
Nov 24, 2014
===========
Fall snow cover in Northern Hemisphere was most extensive on record, even with temperatures at high mark
WaPo
December 4, 2014
“Global average temperature” is a fiction that only serves a propaganda purpose.
Khwarizmi, weather is just ‘weather’, local and temporal, how extreme and unusual it can be. ‘Climate’ is about a 30 year mean.
‘Climate is about a 30 year mean’. This old chestnut keeps popping up whenever one speaks of a solar related cooling. Oddly, it hardly ever gets mentioned when the warmists talk about the hottest ever day/month/year…..Sigh.
Jay Hope August 27, 2016 at 9:44 am “‘Climate is about a 30 year mean’.(…) Oddly, it hardly ever gets mentioned when the warmists talk about the hottest ever day/month/year…..’ ”
Jay Hope you are right. 9 Out of 10 ten ‘alarming’ media messages are not about climate but about weather events. We all should say it every time, over and over again: “Weather isn’t the same as climate”. Media would diminish the number of alarming messages with at least 90%, I guess. Changing ‘weather’ for ‘climate’ is one of the main mechanisms of Media (and politicians) to keep the alarming idea alive.
So let’s control ourselves and others in speaking about climate only when it really is climate. And it is only climate, when it is about an average over at least a period of 30 years. Look at the definitions of well known institutes:
NOAA
http://cpo.noaa.gov/AboutCPO/Glossary.aspx
The average of weather over at least a 30-year period. Note that the climate taken over different periods of time (30 years. 1000 years) may be different. The old saying is climate is what we expect and weather is what we get.
NASA
http://www.nasa.gov/mission_pages/noaa-n/climate/climate_weather.html
What Climate Means
In short, climate is the description of the long-term pattern of weather in a particular area.
Some scientists define climate as the average weather for a particular region and time period, usually taken over 30-years. It’s really an average pattern of weather for a particular region.
WMO
http://www.wmo.int/pages/prog/wcp/ccl/faqs.php
What is Climate?
Climate, sometimes understood as the “average weather,” is defined as the measurement of the mean and variability of relevant quantities of certain variables (such as temperature, precipitation or wind) over a period of time, ranging from months to thousands or millions of years.
The classical period is 30 years, as defined by the World Meteorological Organization (WMO). Climate in a wider sense is the state, including a statistical description, of the climate system.
KNMI – the Netherlands
http://www.sciamachy-validation.org/klimaatmaatwerk/KEW/data/index.html
Enkele definities
Wat is klimaat? Het klimaat van een bepaald gebied is het gemiddelde weer, dus het gemiddelde over langere tijd van de meteorologische grootheden zoals temperatuur, neerslag, vochtigheid, zonneschijn en wind, inclusief de extremen. Vaak wordt een periode van 30 jaar gebruikt om een klimaat te beschrijven.
Translation:
(Some definitions
What is climate? The climate of a specific area is the average weather, so the average over a longer period of the meteorological parameters like temperature, precipitation, humidity, sunshine and wind, inclusive the extremes. Often a period of 30 years is used to describe a climate.)
Deutsche Wetterdienst (German Meteoservice)
http://www.dwd.de/DE/service/lexikon/Functions/glossar.html?lv2=101334&lv3=101462
(….) Im allgemeinen wird ein Zeitraum von 30 Jahren zugrunde gelegt, die sog. Normalperiode, es sind aber durchaus auch kürzere Zeitabschnitte gebräuchlich.
Translation:
((….) Generally a period of 30 years is used, the so named normal period, but surely there have been shorter periods used.)
Britannica:
https://www.britannica.com/science/climate-meteorology
The best modern definitions of climate regard it as constituting the total experience ofweather and atmospheric behaviour over a number of years in a given region. Climate is not just the “average weather” (an obsolete, and always inadequate, definition). It should include not only the average values of the climatic elements that prevail at different times but also their extreme ranges and variability and the frequency of various occurrences. Just as one year differs from another, decades and centuries are found to differ from one another by a smaller, but sometimes significant, amount. Climate is therefore time-dependent, and climatic values or indexes should not be quoted without specifying what years they refer to.
WIKIPEDIA
https://en.wikipedia.org/wiki/Weather_and_climate
There is often confusion between weather and climate. Weather is the condition of the atmosphere at a particular place over a short period of time, whereas climate refers to the weather pattern of a place over a long period, long enough to yield meaningful averages.[1][2]
https://en.wikipedia.org/wiki/Climate
“Climate is the statistics (usually, mean or variability) of weather, usually over a 30-year interval.”
A 25% decrease in cosmic ray intensity results in roughly 1% decrease in cloudiness. A 1% change in cloudiness corresponds to a 0.5% change in radiation reaching the surface (for an albedo of 0.33) which leads to 0.4C temperature change, in this case an increase.
So … would it follow that a 0.1% decrease in cloudiness, over a 10 year period would result in the same 0.4C temperature change ….. just stretched out over a longer period of time??
I ask this because as with all the “math-a-ma-goo” approaches to everything science, the unpredictable influences of unknown factors always plays a role .. and hence, why in areas like “climate”, none of the models ever match. I know the “ASSumption” is that the radiation balance equation will seek equillibrium, blah blah blah, and that the 0.1% increase will lead to a 0.1% decrease in outgoing radiation, but I’m not sure that this is the case given that 70% of that 0.1% increase is going to penetrate the ocean and not surface for years.
I agree ED.
During a solar eclipse, the moon shields part of the earth from solar radiation. So wouldn’t this study have a direct bearing on the issue being discussed. GK
http://www.universetoday.com/130455/citizen-scientists-help-crack-300-year-old-mystery-eclipse-wind/
What effect does the sun and clouds have on temperature?….
…when you know temperatures and temperature history have been jiggered to the point of nonsense
It seems logical that solar cycles play a significant role in long-term global climate cycles.
The Little Ice Age lasted from 1280~1850, which corresponds to four Grand Solar Minimum events: Wolf (1280~1350), Sporer (1450~1550), Maunder (1645~1715) and Dalton (1790~1820).
When theses GSMs ended, so did the Little Ice Age.
The Modern Warming Period also closely follows to the strongest 63-yr string (1933~1996) of solar cycles in 11,400 years.
When these strong solar cycles ended in 1996, so did the global warming trend (excluding the recent strong El Niño), despite 30% of all manmade CO2 emissions since 1750 being made over just the last 20 years:
http://www.woodfortrees.org/plot/rss/from:1996.6/to:2015.7/plot/rss/from:1996.6/to:2015.7/trend/plot/esrl-co2/from:1996.6/to:2015.7/normalise/trend/plot/esrl-co2/from:1996.6/to:2015.7/normalise
CAGW’s global warming projections vs. reality are already 2 standard deviations off, and with: the coming cold La Niña cycle, the PDO already in its 30-yr cool cycle, the AMO starting its 30-year cool cycle around 2019, the current solar cycle at near zero sunspots by 2018, and the weakest solar cycle since 1790 starting in 2022, by 2021, the global warming hiatus should hit 25 years of duration and the disparity between CAGW projections will likely exceed 3 standard deviations, which is the point where CAGW becomes even a bigger joke than it already is.
CAGW is dead… In 5~7 years, it will be laughed at and ridiculed.
The eccentricity of the orbit swings TSI a total of 90 W/m^2. Add the precession of Malinkovitch and CAGW vanishes in the haze.
SAMURAI, great comment… If what we’re in for is anything like what we saw back in ’08 then this could get interesting. Seeing how we just had our el nino, it’s not likely that there will be another one to bail us out when we hit bottom at the next solar minimum (as did happen in 2010). So, pull up your arm chair and get your popcorn ready, cause this could be quite a show…
read that 7 years ago
7 years ago, there were only12 years of a little over one standard deviation of divergence.
Now there are close to 20 years of over two standard deviations of divergence, which is technically sufficient criteria for hypothetical disconfirmation.
In 5~7 there will be over 25 years of over 3 standard deviations of divergence….
See a pattern developing?
Any serious and virtuous scientist will have to concede CAGW is a bust by 2021~2023 with that level of both duration of divergence…
…LOL……299 gold stars.. ;o)
[The mods wonder: What is the error bar and trend line on that 299 gold star award? .mod]
…+ / -1….97 out of 100 times… ? Trend line is definitely up but I can’t show you my work….because you might find something wrong with it !! ….. ;o)
Let’s see the changes in GCR in South.
http://neutronm.bartol.udel.edu/realtime/southpole.html
In the south as in the north there are waves in stratosphere, that affect the polar vortex.
http://www.cpc.ncep.noaa.gov/products/stratosphere/strat-trop/gif_files/time_pres_WAVE1_MEAN_JAS_SH_2016.png
http://www.cpc.ncep.noaa.gov/products/intraseasonal/temp10anim.gif
How does this affect the weather? Here you can see.
http://www.cpc.ncep.noaa.gov/products/stratosphere/strat-trop/gif_files/time_pres_HGT_ANOM_JAS_SH_2016.png
In 2009, during the very low solar activity were observed strongest sudden warming of the stratosphere.
http://adsabs.harvard.edu/abs/2009AGUFM.A21C0202D
“The warming affected the upper stratosphere (~ 40-45 km) first, and then propagated rapidly from the upper to the lower stratosphere.”
I am so glad to see so many of us agree on the solar/climate connection.
AND, Salvatore, nice to see that svalgaard is taking a nap. He tends to stunt the discussion, sucking up all the oxygen in the room. I don’t think you were rude up top. No, more like righteous indignation. He tends to bring it upon himself with his obtusely shallow argumentation. Too bad anthony has him all wrapped up in bubble wrap, only makes him worse. BUT, it is anthony’s blog and blogs are monarchies not democracies. (if we don’t like it we can get our own blog…)
That is how he is but it does not matter what matters is what the climate does going forward and why.
Sunspot time-integral plus net of all ocean cycles plus effect of water vapor increase provides a 98% match to measurements 1895-2015 at http://globalclimatedrivers2.blogspot.com Water vapor increase is countering the temperature decline that would otherwise by occurring and might also be contributing to recent flooding.
It might be arguable whether it is cosmic rays or solar wind or both but it is definitely sunspots.
off topic…anyone have a good reburt to this paper? http://multi-science.atypon.com/doi/abs/10.1260/0958-305X.26.3.417
No rebuttal is possible, unless you can challenge the proxy data.
Whatever actual warming has occurred since 1916 is well within normal, natural limits, especially coming out of the LIA, which ended in the 19th century. Thus, the null hypothesis cannot be rejected.
There is nothing going on with earth’s climate about which to worry. So far, one more molecule of plant food per 10,000 molecules of dry air has been a good thing.
Thanks !