


Above, examples from Las Vegas illustrate the issue, but aren’t part of the original paper. Source: NWS WSFO, Las Vegas. NV.
HUNTSVILLE, Ala. (April 29, 2016) — Scientists using long-term surface temperature data to track climate change caused by greenhouse gases would be best served using only daily high temperature readings without the nighttime lows, according to new research at The University of Alabama in Huntsville.
Using temperature data from Alabama going back to 1883, scientists in UAH’s Earth System Science Center developed and tested various methods for creating stable, reliable long-term climate datasets for three portions of inland Alabama.
In addition to creating some arcane mathematical tools useful for creating climate datasets, the team also found daytime high temperature data is less likely to be contaminated by surface issues — such as deforestation, construction, paving and irrigation — than nighttime low temperatures.
“If you change the surface, say if you add buildings or warmer asphalt, you can enhance night time mixing of the lower atmosphere,” said John Christy, the ESSC director and a distinguished professor of atmospheric science at UAH. “That creates a warming caused by vertical mixing rather than changes in greenhouse gases.”
Summer high temperatures are particularly useful in this regard, because summer temperatures tend to be more stable, while cold season temperatures are subject to larger swings due to natural variability. These often wild swings in temperature introduce “noise” into the data, which can mask long-term trends and their causes.
Results of this research were published recently in the American Meteorological Society’s “Journal of Applied Meteorology and Climatology.”
Basically, under pristine natural conditions, in most places a cool layer of air forms close to the ground after the sun sets. This layer of denser, cooler air creates a boundary layer that keeps out warmer air in the deep layer of the atmosphere above it.
Then people move in. People tend to do all sorts of things that mess with the local climate. Breezes blowing around buildings can cause nighttime turbulence, breaking apart the cool boundary layer. Streets, parking lots and rooftops absorb heat during the day and release it into the atmosphere at night, also causing turbulence. Irrigation increases dry soil’s ability to hold heat and releases a powerful greenhouse gas (water vapor) into the lowest levels of the atmosphere over dry and desert areas.
That’s the short list.
When the cool layer of air near the surface is disturbed, warmer air aloft is drawn down to the surface. All of those cause real changes in the local climate, raising local surface temperatures, especially at night, by amounts large enough to be noticed both by weather station thermometers and by people living in some of those areas.
But none of those changes has anything to do with widespread climate change in the deep atmosphere over large areas of the globe, such as might be seen if caused by increased concentrations of carbon dioxide in the atmosphere.
“Over time this might look like warming or an accumulation of heat in the temperature record, but this temperature change is only caused by the redistribution of warmer air that has always been there, just not at the surface,” said Richard McNider, a distinguished professor of science at UAH.
So how can climatologists use existing long-term surface temperature records to accurately track the potential effects of enhanced CO2? Take the nighttime boundary layer (and all of the things we do to interfere with it) out of play, say Christy and McNider.

“We prefer to take temperature measurements in the deep layer of the atmosphere, which is why we use instruments on satellites,” Christy said. “But the satellite data only goes back to the last few days of 1978. We use the surface record because it is longer, and we really want to look at data that goes back much further than 1978. “Because of the natural mixing of the atmosphere caused by daytime heating, daily maximum temperatures are the best surface data to use to look at temperatures in the deep atmosphere. At the surface, the daytime maximum temperature just represents more air than the nighttime low.”
The new temperature datasets extend the existing climatology for three regions of interior Alabama (around Montgomery, Birmingham and Huntsville) by a dozen summers, all the way back to 1883. Summers in Alabama have been cooling, especially since 1954. Interior Alabama’s ten coolest summers were after 1960, with most of those after 1990. As might be expected given that cooling, climate models individually and in groups do a poor job of modeling the state’s long-term temperature and rainfall changes since 1883.
The researchers conclude the models — the same models widely used to forecast climate change — show “no skill” in explaining long-term changes since 1883.
Time Series Construction of Summer Surface Temperatures for Alabama, 1883–2014, and Comparisons with Tropospheric Temperature and Climate Model Simulations
Alabama Office of the State Climatologist, and Earth System Science Center, The University of Alabama in Huntsville, Huntsville, Alabama
Earth System Science Center, The University of Alabama in Huntsville, Huntsville, Alabama
Three time series of average summer [June–August (JJA)] daily maximum temperature (TMax) are developed for three interior regions of Alabama from stations with varying periods of record and unknown inhomogeneities. The time frame is 1883–2014. Inhomogeneities for each station’s time series are determined from pairwise comparisons with no use of station metadata other than location. The time series for the three adjoining regions are constructed separately and are then combined as a whole assuming trends over 132 yr will have little spatial variation either intraregionally or interregionally for these spatial scales. Varying the parameters of the construction methodology creates 333 time series with a central trend value based on the largest group of stations of −0.07°C decade−1with a best-guess estimate of measurement uncertainty from −0.12° to −0.02°C decade−1. This best-guess result is insignificantly different (0.01°C decade−1) from a similar regional calculation using NOAA’s divisional dataset based on daily data from the Global Historical Climatology Network (nClimDiv) beginning in 1895. Summer TMax is a better proxy, when compared with daily minimum temperature and thus daily average temperature, for the deeper tropospheric temperature (where the enhanced greenhouse signal is maximized) as a result of afternoon convective mixing. Thus, TMax more closely represents a critical climate parameter: atmospheric heat content. Comparison between JJA TMax and deep tropospheric temperature anomalies indicates modest agreement (r2 = 0.51) for interior Alabama while agreement for the conterminous United States as given by TMax from the nClimDiv dataset is much better (r2 = 0.86). Seventy-seven CMIP5 climate model runs are examined for Alabama and indicate no skill at replicating long-term temperature and precipitation changes since 1895.
Full text (open source) here: http://journals.ametsoc.org/doi/full/10.1175/JAMC-D-15-0287.1
1) CO2 traps outgoing IR between 13 and 18µ. There is no way to warm anything by trapping outgoing radiation. If the earth’s surface, the radiating body, is 15°C, there is no way for that surface to warm the atmosphere above 15°C (unless the energy is changed in form, ie triggers combustion). Record high daytime temperatures are evidence something other than CO2 is causing the warming, so are the warming oceans. Record high temperatures are caused by incoming, not outgoing radiation. Cleaner air, more transparent air or a warmer sun causes surface warming. CO2 doesn’t cause the surface or oceans to warm, it just traps some of the radiation it emits.
2) To demonstrate the impact of CO2 on the atmosphere, simply measure the temperature of the air in direct sunlight over a highway, then measure the temperature air in the shade. The air in the shade is trapping outgoing radiation, but is shielded from incoming radiation. Both locations have equal CO2, but wildly different levels of radiation.
3) Use MODTRAN to measure the impact on the lower 100m of the atmosphere, the area where all ground-measurements are located, of CO2. You will see that CO2 has no measurable impact on the temperature near the earth’s surface, zero, for the relevant ranges of CO2. I repeat, zero, even for a doubling of CO2.
1) Yep, incoming radiation, which is transparent to CO2 is warming the earth. Radiation must reach the earth’s surface to warm it, that is a simple fact. Radiation must pass through CO2 to reach the earth, visible light does that. Visible light warms the surface and the oceans. Warming is due to incoming radiation, CO2 slows the cooling by trapping outgoing radiation. The mechanisms are completely different.
2) CO2’s impact would be identified by the temperature difference between the peak day and peak night time temperature. A nighttime reading of temperature would show much more warmth above a highway than the desert surface, not because of CO2, but because the highway is far greater heat sink than sand. It is black and far more dense than sand.
1) Yep, once again, incoming radiation is what warms things. Turn off the sun for a day and we will plunge into an ice age no matter how much CO2 we have in the atmosphere.
2) You have to control for all the other factors to isolate the impact of CO2. Laying millions and millions of miles of asphalt over the past 60 years has made the surface a much more efficient radiator and sink of heat, and that has nothing to do with CO2. Warming is expected if you change the surface from grassland to highway, and it has nothing to do with CO2.
The question needs to be how does CO2 cause a record daytime temperature? It can’t under the GHG theory. Trapping outgoing radiation can’t warm the atmosphere above the temperature of the radiating body, if it could we would have the potential for a perpetual motion machine where energy is created from nothing, or magnified. The CO2 signature would be a narrowing between the day peak and night low temperatures. That would demonstrate that the CO2 is preventing the earth from cooling. If day temperature reached 22°C, and the night low fell to 14°C, and over time day temperatures of 22°C were followed by 15°C, and then 16°C and then 17°C, then you would have identified a CO2 signature (ceterus paribus)
Surely, the point of the paper is not that minimum temperatures, or minimum temperature trends, are per se unimportant to the evaluation of global warming, life, the universe, and everything, but that land use changes, including most importantly, perhaps, UHI, make discerning the real data for minima much more difficult than for maxima. That seems rather uncontentious to me.
sorry .. should say ‘discerning the real data TRENDS’
“but that land use changes, including most importantly, perhaps, UHI, make discerning the real data for minima much more difficult than for maxima. That seems rather uncontentious to me.”
Nope.
I worked for a few years as a Forecaster at Birmingham A/p (England not the US).
It’s a old airfield dating back to the 1930’s. In that time the environs of the city have built up around it and it should have indeed reflected a UHI effect.
However given calm/clear nights the Met station would often report one of the lowest night minima in the English Midlands.
This effect may actually have been accentuated by the urban effect in stilling warmer air surrounding and allowing the air over the airfield to stagnate more than otherwise.
IOW a micro-climate that was insulated from the UHI.
However on a night when there was a light/moderate breeze from across the city to the west then (although not immediately noticeable) temps would have been held a little higher than in it’s earliest days.
An amusing little anecdote to be sure.
I have a few of my own…would you like to hear them?
Be warned, they completely contradict everything that you have recalled in your biased little recollections of yesteryear.
It’s called meteorology my friend.
That you are ignorant of it is one thing but to wear it as a badge on here is another.
Try saying something intelligent and pertinent to the post.
I will site right next to you and take any test on any day on any subject in the field of physical geography, or physical chemistry, or about any other real science, and bet dinner on who does better.
Winner picks the restaurant.
I repeat…
Try saying something intelligent.
You try first, toneb.
” The question needs to be how does CO2 cause a record daytime temperature? It can’t under the GHG theory. Trapping outgoing radiation can’t warm the atmosphere above the temperature of the radiating body, if it could we would have the potential for a perpetual motion machine where energy is created from nothing, or magnified. The CO2 signature would be a narrowing between the day peak and night low temperatures. That would demonstrate that the CO2 is preventing the earth from cooling. If day temperature reached 22°C, and the night low fell to 14°C, and over time day temperatures of 22°C were followed by 15°C, and then 16°C and then 17°C, then you would have identified a CO2 signature (ceterus paribus)”
And it is this type of analysis that I’ve been working on, and there is a preponderance of evidence that CO2 is not the source of climate change.
https://micro6500blog.wordpress.com/2015/11/18/evidence-against-warming-from-carbon-dioxide/
You’d also get an increase in the day time temperatures.
” You’d also get an increase in the day time temperatures.”
Quite possibly, but that heat doesn’t last either.
Go look at the graphs of mxdiff.
Maybe maybe not, that is why I said ceteris paribus. The next day could be cloudy and lead to cooling. One would expect however that ceteris paribus if you start as a warmer temperature and add equal energy that you would end up with a warmer temperature. That is why the AGW describes a doomsday theory, there is no way for CO2 to result in cooling. Higher CO2 levels would always result in higher temperatures, and we know from the geologic record that that isn’t true. Mother nature isn’t a fool. That is why she made CO2 to have an exponential decay in its absorption, and H20 precipitates out of the atmosphere above a certain concentration.
Co2 doesn’t trap heat.
It slows the rate of cooling by raising the effective radiating level.
Basic physics.
Demonstrate otherwise and collect your Nobel
Steve, exactly how much of the increase in Las Vegas minimums would you attribute to UHI versus AGW?
Is there any weather stations nearby but without population or development that could be used for a Kim(2002) type study for UHI?
Those two things aren’t mutually exclusive. A thermos and insulation traps heat and slows cooling, that is what CO2 does. It absorbs and then re-radiates IR between 13 and 18µ. Instead of that radiation passing immediately into outer-space, it is absorbed and re-radiated in a 360° pattern. This slows, but doesn’t prevent that radiation from reaching outer-space, it just takes a much longer path to get there.
Holy H cow, there’s some faeries on this pin or what!!! or is it Data Torture?
There is much talk here-in of the temperature of The Surface Of The Earth (SOTE), Stevenson screens, boundary layers and whatever.
Are these things, thermometers esp, actually in contact with, or part of, the SOTE. If we want to measure The Earth, why is a our measuring kit planted in a box 4, 5, 6 feet above, or even miles high in the sky? Why are the thermometers not actually buried in the dirt?
You must try it with one or more of our host’s Weathershop data loggers. Saves a *lot* of grief for your Excel spreadsheet working out averages.
Similarly, has anyone ever left the water in their bath then dunked a differential thermometer in there. (An easy experiment for single men to do perhaps) Pop one side of it in the water and the other hanging on the outside. Try it with the window open or closed.
There is presently sitting on the grass in my garden via a wire out of my kitchen window, a little CO2 data logger. It measures temeparure as well and it takes a reading every 15 minutes. Mauna Loa acurracy it is not but it tells me that CO2 levels in my garden can be 100ppm higher in the early morning when it is coldest than when it falls to maybe 390ppm in late afternoon – when it is warmest. During The Day. Every day in fact.
now what is going on there? Is carbon oxide trapped in the boundary layer, why is the boundary layer so cold, what about the humidity, why has that faerie effed off down the pub?
so many questions..
My bath is the hot spa connected to my swimming pool, and it is always a toasty 104 to 110 F.
Does that disprove your point?
(I keep it hooked up to the solar dealio on the roof, and use a set of boiler controls to operate a control circuit I designed.)
Do not ignore the effect of photosynthesis on carbon dioxide levels in a local environment. As the sun comes up, your grass and other landscaping begin sucking the carbon dioxide out of the air. Depending on the vegetation, wind, and other factors, the drop could be quite significant.
OK…so you start using daytime highs. How far back does that record go? Seems to me that this will make the available historical temperature record even shorter. But then, when you think about it, what exactly are they measuring when they say that back in 1916 the temperature was 2 degrees C lower than it is now? How do we extract daytime highs from the Medieval Warm period?
Nope…the more I read about this, the more I am convinced that all this climate4 change stuff is based on miserable data that is being attributed WAY more accuracy than it ever should. This science is built on a very weak foundation.
Wide and varied discussion in the comments here, but it seems to me the paper is really discussing the challenges of data sampling. This topic can be quite challenging even for manufacturing processes in a relatively simple controlled system. Seldom do I see respect for the complexity of global sampling. It is ludicrous the way we collect, adjust and average temperature data to determine “global warming.” It is ludicrous the way we identify “unprecedented changes” by comparing day-by-day primary measurements with some secondary quantities tortured from geologic witnesses.
This is a good example of the folly of using averaged temperatures, especially annual averages. Vegas appears to be quite a pleasant place with a wonderful 82F average temp. Imagine the surprise in summer when the daily highs are well above that. The only thing that really matters is at the highest temperature of the day what will survive and what will not. You can ask the same question about low temps also. Everything else is just bullsh*t.
Excellent paper, powerful argument.
Could this be extended to the Central England set and also the worldwide data set?
Where can you get temperature data in Excel form please?
littleoil on April 30, 2016 at 5:46 am
Excellent paper, powerful argument.
Could this be extended to the Central England set and also the worldwide data set?
Where can you get temperature data in Excel form please?
_________________________________
You can always open a .txt file WHEN IN Excel. Change ‘type of files’ to ‘all’ and select your File.
Excel suggests dividing into colums by patterns of blanks in the text File.
Of course it’s up to you to control +repair the outcome.
_________________________________
In fact that’s easier done in unix with awk.
Not longer common nowadays, guessing.
If you’re looking for an effect of CO2, look at night when convection is absent and radiation dominates (e.g. cooling rates). In daytime convection rules and bring with it a wealth of confounding effects that even today totally stumps the modelers. This ignorance of the effects of convection is a convenient excuse to parameterize it as trivial and leave a enormous hole for a “Greenhouse Effect” which can then be presumed to dominate the climate.
Bingo!!! The entire field of climate science seems to be based upon ignoring the scientific method and widely accepted scientific practices. The AGW theory is that warming results from CO2 trapping outgoing radiation between the wavelengths of 13 and 18µ. That is the unique contribution of CO2 to global warming. I never see climate scientists try to isolate the effect of CO2, I never see them use controls, I never see them try to directly tie an observation to CO2, they simply say there is warming, therefor it must be due to CO2. It is a belief, not a proof.
1) Incoming radiation causes the warming, simply feel the effect of a cloud on a hot summer day, or the shade of a tree. Daytime temperatures due to incoming radiation make trapping outgoing IR insignificant.
2) H2O is the dominate GHG, so any atmosphere with H2O in it that is warming is warming due to H20, not CO2. MODTRAN proves that beyond any reasonable doubt.
3) To isolate the impact of CO2 you need a control. CO2 is a constant 400 ppm in the N and S Hemisphere, at the surface all the way up to 80 km. CO2 evenly blankets the earth, in other words, CO2 is a constant. To measure the impact of CO2 you need to isolate those areas where only CO2 is present, and measure the impact of increasing CO2 over time. The controls for CO2 are the very very dry deserts and Antarctica. Those climates have CO2 but no H20. The change in night-time lows relative to daytime peaks would give a CO2 signal, ceteras paribus. Everyone but the Climate Scientists seem to understand this concept.
http://discoveringantarctica.org.uk/oceans-atmosphere-landscape/atmosphere-weather-and-climate/key-factors-behind-antarcticas-climate/
4) The N Pole loses ice relative to the S Pole because it is impacted by ocean currents, not CO2. Once again, everyone seems to understand this except the climate scientists. CO2 and IR between 13 and 18µ doesn’t warm the oceans.
That quote highlights another control for CO2, Verkhoyansk, north-east Siberia. Temperature changes in Verkhoyansk, north-east Siberia would provide a CO2 signal. It is equal CO2, not no H2O to the rest of the world. Assuming that H20 saturates the GHG effect, one would compare an area with constant humidity over a time period and measure its change in temperature relative to Verkhoyansk.
co2islife:
“I never see climate scientists try to isolate the effect of CO2, I never see them use controls, I never see them try to directly tie an observation to CO2, they simply say there is warming, therefor it must be due to CO2. It is a belief, not a proof.”
You obviously weren’t looking.
But that’s hardly a surprise on here.
http://phys.org/news/2015-02-carbon-dioxide-greenhouse-effect.html
“H2O is the dominate GHG, so any atmosphere with H2O in it that is warming is warming due to H20, not CO2. ”
And:
“Assuming that H20 saturates the GHG effect”
No. It masks the effect. Different thing. The two act together.
The effect is greatest at the poles (drier throughout the trop) and in the higher troposphere where pressure broadening of the absorption bands does not occur and allows discrete windows to space.
Above a humid surface airmass there is dry air.
https://scienceofdoom.com/2011/03/07/understanding-atmospheric-radiation-and-the-%E2%80%9Cgreenhouse%E2%80%9D-effect-%E2%80%93-part-eight/
“To measure the impact of CO2 you need to isolate those areas where only CO2 is present, and measure the impact of increasing CO2 over time.”
We have thanks…
http://decarboni.se/sites/default/files/imagecache/620xH/publications/22562/advanced/fig01.jpg
“The N Pole loses ice relative to the S Pole because it is impacted by ocean currents, not CO2. Once again, everyone seems to understand this except the climate scientists. CO2 and IR between 13 and 18µ doesn’t warm the oceans.”
No the NP/Arctic is hemmed in by land mass.
Not much room for ocean currents to get through. Though the NAD has a go before sinking into the AMOC.
http://www.ucsusa.org/sites/default/files/legacy/assets/images/ce/conveyor-belt.gif
Antarctica is, hemmed in by ocean. And is therefore dominated by the Antarctic Circumpolar Current.
No, climate scientists know more than you do my friend as is obvious by this post. Not least because you have learned your *climate science* by reading their studies (if you have).
I am most pleased to see a smart, obviously educated, informed and very knowledgeable climate scientist displaying their talents professionally with integrity. You are a credit to our society. Sadly, the mendacious propaganda has fooled the “poorly educated” (Trump’s classification) and perniciously politicized the topic. Most on here behave as if they’re on a reality show acting the part of a climate scientist and remain obnoxiously ignorant. Keep up the smart, well-thought out comments of science and integrity. To paraphrase Einstein it only takes one to prove him wrong, and he’d accept that graciously and embrace it. You have no competent opposition on this thread so I don’t see that happening in this forum. I know as a retired (less active) scientist you’d welcome a healthy discussion and opponent for that’s how science moves forward.
Morose:
Thank you again.
@ToneB, is that a joke? Oklahoma and the North Slope of Alaska? There is plenty of H2O in the air of both those spots, and the different latitude makes it apples and oranges. How about Oklahoma and Death Valley, or the coast of Antarctica and the interior. That “experiment” was so poorly designed you can get any reading you want by simply choosing the right wrong location. 22 ppm CO2? Really? That change literally has no measurable impact on W/M^2 looking down from 100 m, literally zero. Doubt me? Take a look at MODTRAN and do the calculations.
There is plenty of humidity around the N Slope of Alaska.
http://www.weatherforyou.com/reports/index.php?pands=north+slope+county%2Calaska
@Toneb, check the numbers yourself, a change of 22 ppm results in an immeasurable impact on W/M^2 looking down from 0.1 km.
http://climatemodels.uchicago.edu/modtran/
The entire “experiment” is a joke, and demonstrates a compete ignorance of the scientific method, controls and modeling.
http://phys.org/news/2015-02-carbon-dioxide-greenhouse-effect.html
1) Oklahoma is at 35° N, and Barrow Alaska is 71°, both areas has H2O in the atmosphere, in fact the North Slope is on the coast.
2) If you wanted to show a control you would use areas on the same latitude, one with a rain forest and one with a desert. The Kalihari, Great Sandy and the Amazon would be the obvious choices, or Death Valley and South East Asia.
3) Because CO2 is a one way street, all it does is trap hear and result in warming, you would have to show that areas void of H2O, and near the temperature most effectively absorbed by CO2, -50 to -110°C show warming. Siberia and Antarctica. Neither show warming correlated to CO2. The very fact that the study you identified avoided these areas given the available data demonstrates that they are either incompetent or deceitful, neither of which is good.
http://www.john-daly.com/stations/amundsen.gif
@Toneb, no it doesn’t mask it, it saturates it. You can’t absorb more than 100%, and H2O absorbs 100%. Simply learn to use MODTRAN.
http://climatemodels.uchicago.edu/modtran/
As H20 precipitates out of the atmosphere, CO2 replaces part of the absorption that was being performed by H2O. In a way you can H2O is masking CO2, but the result is the same, with our without CO2 the W/M^2 is the same in the lower atmosphere. Only when H2O is gone does the CO2 signature appear, and it is way up in the atmosphere. The signature just begins to appear at 3 km up, and it traces the temperature of the atmosphere at that level, showing that it isn’t trapping much heat.
Once again, if CO2 impacted temperatures near the ground it would be in Siberia and inland Antarctica, and those area show no warming trend at all. Even with all the data tampering. ?w=640
http://www.john-daly.com/stations/amundsen.gif
@Toneb, you don’t seem to be able to grasp the concepts. The oceans and their warmth is causing the N Pole to lose ice, CO2 doesn’t cause the oceans to warm. CO2 also can’t cause the local warming under the Larsen B and Ross Ice shelves. CO2 can’t cause localized pockets to warmth, something else must. Care to explain how IR between 13 and 18µ can warm the oceans? Care to explain how CO2 can cause the localize hotpots off the coast of Antarctica? Care to explain what inland Antarctica and Siberia aren’t warming with increased CO2? Care to explain how CO2 can cause a record daytime temperature if the day before was colder than the previous day? Care to explain why climate scientists rely on ground measurements when they know the impact of CO2 in the lower 0.1 km is totally immeasurable? Arctic sea ice is greatly impacted by the oceans, the ice floats on the water. Inland Antarctica is the prefect control for CO2, yet it is ignored by the climate pseudo scientists.
@Toneb, is this a joke? This is a “settled science” and “this effect has not been experimentally confirmed outside the laboratory until now.” That article was published in 2015, and the experiment is a complete joke. Are you telling me that these nit wit climate scientists reached a “settled” state BEFORE they had any experimental evidence? You pretty much proved what a joke climate science is with your post. Thanks for providing me even more evidence that climate “science” is a sham. What a joke, 2015. Really?
“@ToneB, is that a joke? Oklahoma and the North Slope of Alaska? There is plenty of H2O in the air of both those spots, and the different latitude makes it apples and oranges.”
No joke. SCince.
Try rading it.
Spectroscopic analysis my friend.
APples and oranges?
No becasue of the above.
Oh I for got. Your “Dragon-slayer” hand-waving” – “CO2 and IR between 13 and 18µ doesn’t warm the oceans.”
LWIR does heat the oceans. Obviously. As all energy that is absorbed by a body, whether on it’s skin or elsewhere, must.
http://moyhu.blogspot.co.uk/2010/10/can-downwelling-infrared-warm-ocean.html”
ANd it’s be observed directly….
http://www.realclimate.org/index.php/archives/2006/09/why-greenhouse-gases-heat-the-ocean/
If you don’t like the site then go direct to the paper (paywalled)
“Thus, if the absorption of the infrared emission from atmospheric greenhouse gases reduces the gradient through the skin layer, the flow of heat from the ocean beneath will be reduced, leaving more of the heat introduced into the bulk of the upper oceanic layer by the absorption of sunlight to remain there to increase water temperature.”
And no the energy is not used up in evaporation at the skin. No thermodynamic process is 100% efficient and water below the skin is heated via conduction.
SCince… Try rading it… APples and oranges
It’s late, Toneb. Put away the cooking sherry. Bedtime.
It’s the refractive index that reflects the LWIR back. Not!
co2islife:
“Are you telling me that these nit wit climate scientists reached a “settled” state BEFORE they had any experimental evidence?”
I’m sorry but anyone calling scientist, climate ones or otherwise, “nit-wits” has my contempt.
Hubristic arrogance beyond words. Individually there may be some, but they get found out. Many on here. Collectively certainly not.
We no longer live in Gallileo’s day.
What makes you superior to climate scientists? just becases you inhabit the *contrarian* Blogosphere?
While you use the data, and the physics that climate scientists and physicists have evolved for you.
They are not incompetent.
They are not fraudulent.
They know more than you.
Obviously. Just obviously. By the vast balance of probability.
The “settled” bit pertains to the unarguable fact that CO2 is a GHG. That it slows cooling when present in the atmosphere.
That a known quantity has a known back radiative effect (Beer-Lambert).
The experiment I linked separates out the back-radiation of CO2 AWAY FROM OTHER GHG’s including WV via spectroscopic analysis.
What is not settled is the nuances of the conveyance of heat around the climate system, not least becasue the oceans hold ~93% of it and can hide it awy in cycles such as the PDO/ENSO.
No, WV does not saturate the GHE of CO2. Try reading the science.
Cherry picking graphs is not science.
That’s been done for you by the scientists who took the data you cherry-pick and the foundation goes all the way back the Arrhenius.
https://www.aip.org/history/climate/co2.htm
Oh, BTW – I know that you, as most others on this echo-chamber will not be swayed … but someone has the give those less delusional the science that you gainsay.
” That it slows cooling when present in the atmosphere.”
In the surface temperature record, this is buried in measurement uncertainty, and is indistinguishable from 0.
I would encourage everyone to save the link that Toneb used to support his comment mocking me as a smoking gun exposing just how pathetic a “science” climate science truly is. The best evidence he could find to refute my comment exposed just how pathetic the experiments are in the field of climate science, but most importantly, it exposes that they didn’t even bother to run the most basic of experiments needed to even begin to “settle” this science UNTIL 2015!!!. How do you “settle” a science when all you have done is run one single pathetically designed experiment? What a complete and utter joke. Thanks Toneb for providing the badly needed evidence that climate science is a joke. Yes you were right, I was wrong in saying that they never run experiments. I should have said these clowns have in fact run one pathetically designed experiment to fool the ill-informed and scientifically illiterate followers of the global warming cult. One experiment, what a complete joke. Is that all you really have? Two site over 10 years and they “settle” this science? Are you kidding me? Imagine a drug company going to the FDA with such crap. They would be laughed out of the office. Thanks Toneb, you’ve proved my point that climate science is a complete and utter joke, and a very very very bad joke at that.
Here is the smoking gun quote that exposed Climate Science as a complete joke. Note the date.
http://geekandsundry.com/wp-content/uploads/2015/06/heath-ledger-e1433504175941.jpg
pochas,
This ignorance of the effects of convection is a convenient excuse to parameterize it as trivial and leave a enormous hole for a “Greenhouse Effect” which can then be presumed to dominate the climate.
___________________________________
Yaa!
Spares out clouds, particulates as in dust, pollen + other organics, turbulence and viscosity in air, water, clouds, windspeed -whatever parametrized over grid cells with 100’s of km width –
promoting GHG’s dominating ‘climate change’.
Good post, interesting discussion –
Thanks to all – Hans
” If you’re looking for an effect of CO2, look at night when convection is absent and radiation dominates (e.g. cooling rates). ”
Exactly, on a clear night temps fall like a rock, so I started looking at how much temps drop at night, and when you compare falling temps to how much temps went up the day before, it’s obvious co2 has not caused a loss of cooling.
https://micro6500blog.wordpress.com/2015/11/18/evidence-against-warming-from-carbon-dioxide/
“This ignorance of the effects of convection is a convenient excuse to parameterize it as trivial and leave a enormous hole for a “Greenhouse Effect” which can then be presumed to dominate the climate.”
No ignorance at all.
The process is far to complex to be explicitly modelled even in NWP models.
It can now be done in small area meso-scale models however.
So grateful we have you here to illuminate us dweebs with you snappy one line scientificamacal explantations.
Sooooo very grateful.
Thanks a heap.
I refer you to my reply to you upthread.
I see what’s going on here. First it were global warming, then it were global climate change, now it is climate change inside my parking garage.
It makes a big difference here in the forested east US whether you’re in a city or the country. Temps in the low-mid 90s or more were common where I was growing up near the city, and still today. Almost non-existent here in the country now (and I’d guess back then too — thermometers were almost exclusively near/in cities). Transpiration from forests/croplands is my guess for the effect — as long as it’s not bone-dry like the 30s, 50s-60s. Didn’t reach 90F here in summer of 2013 and 14, and 90F for an hr 2015, and 7-10F hotter in the cities at those times.
““Over time this might look like warming or an accumulation of heat in the temperature record, but this temperature change is only caused by the redistribution of warmer air that has always been there, just not at the surface,”
Yes, this effect is reinforced by concentrating the absorption and kinetic warming from CO2 in a shorter altitude profile as concentration increases. Surface LWR is essentially extinct at 100 meters anyway in CO2 bands. The radiative warming was always there, we just bring it closer to the surface.
Interesting to consider which effect, radiative or mixing, is larger. Sparks is correct to emphasize the adiabatic component. When you consider that any temperature metric; low, high, average, is consistently several degrees higher under a synoptic ridge than a trough…
I would not use summer high temperatures if I were looking for a CO2 signature, I would use low temperatures. The impact of CO2 would not be expected to so much raise daytime highs as it would be expected to moderate low temperatures at night by returning a portion of the infrared being radiated into space as the surface cools down. It would act like water vapor does in keeping nighttime temperatures warmer (though not as pronounced as water vapor). So I would use nighttime temperatures in desert areas where there hasn’t been a lot of irrigation or dams added to increase humidity in the area.
Like this.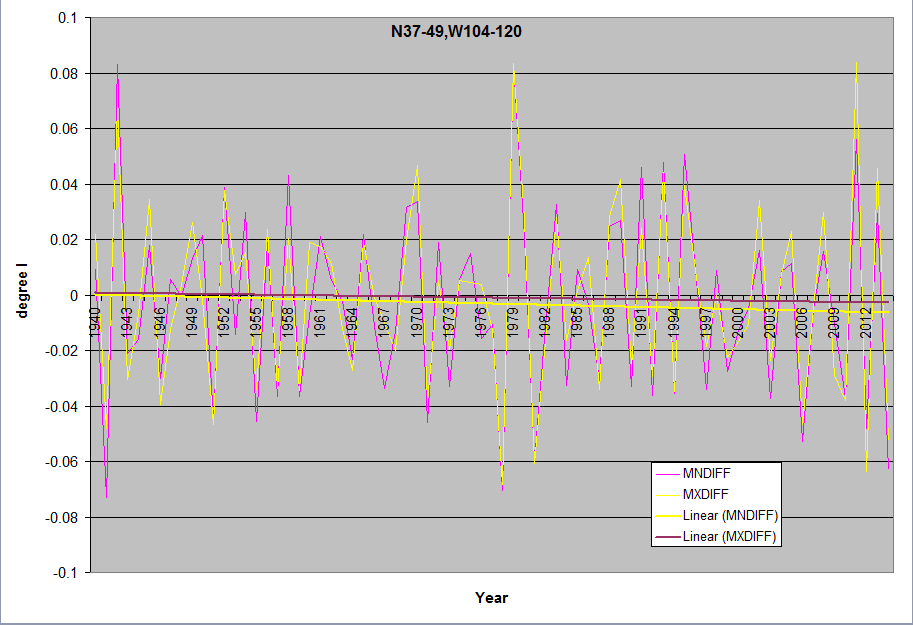 ?w=696
This is the difference between daily rising temps and the following nights falling temps.
The trend is cooling, not warming.
Quite possibly so. There are so many land use changes that impact temperatures that trying to take averages is useless, really. Increased farming/irrigation, increased development, all sorts of things can impact temperatures around individual monitoring stations and taken together, those impact the average. Local microclimate changes added together can make it appear that the overall climate is changing, particularly when some stations are used to “adjust” others for homogenization purposes.
” Quite possibly so. There are so many land use changes that impact temperatures that trying to take averages is useless, really. Increased farming/irrigation, increased development, all sorts of things can impact temperatures around individual monitoring stations and taken together, those impact the average. Local microclimate changes added together can make it appear that the overall climate is changing, particularly when some stations are used to “adjust” others for homogenization purposes.”
This is a derivative of the change in temps on a day to day, it’s not been adjusted or homogenized (other than what NCDC might do to the station records).
It’s based on my own methods, explained here, with links to code and raw reports.
https://micro6500blog.wordpress.com/2015/11/18/evidence-against-warming-from-carbon-dioxide/
“The trend is cooling, not warming.”
Agree completely.
And the more one digs down into the particulars, across a wide range of evidence types, the more obvious it becomes that this is very likely the case.
Oh, except for them deep oceans…where all that missing heat is hiding *rolls the eyes*, making our best attempts to find the truth subject to the very few individuals who control access to the measurement devices placed there.
Why would that be? Hotter days result in colder nights? Sounds contradictory and counter-intuitive at first. It is likely due to hotter days being more humid, and having greater upward convection. H20 is an effective heat sink in the atmosphere so it is quickly pulled away from the surface to higher altitudes. Condensation also quickly released energy to the atmosphere, so the later nights would be expected to be colder than the early night. Most obvious however would be that the hottest days will occur during clear days where the most visible sunlight can reach earth. Clear cloudless skies have nothing but CO2 stopping the radiation from escaping to outer-space, and it doesn’t do a good job at that. That is why if you sleep naked in a desert you will freeze to death, but would sleep comfortably in a rain forest.Record high daytime temperatures is completely consistent with falling nighttime temperatures if you think about the physics.
To show that CO2 is causing the warming, the lower line would be converging with the upper line over time, and the spread would be narrowing until the point where no energy gets released and the peak equals the bottom temperature.
http://www.islandnet.com/~see/weather/graphics/photos0910/deathvalleyca-tempprecipnormal.gif
” Why would that be? Hotter days result in colder nights? Sounds contradictory and counter-intuitive at first. It is likely due to hotter days being more humid, ”
When I first saw this, it didn’t make sense to me.
But I started paying attention to my weather, and finally noticed within a few days of each other, we’d have warm days,and then hot days, and the hot days were more humid, but it was where the air mass was coming from, the oceans heat and evaporate a lot of water, which in some cases moves poleward to cool.
These air masses carry warmth with them as water vapor, which greatly slow nightly cooling, making those days warmer, by 10 to 20F in Ohio.
BINGO!!!! CO2 slows the release of IR between 13 and 18µ to outer-space. CO2 slows outgoing radiation,, it is transparent to incoming visible radiation, that radiation that actually warms the planet. Warming night time low temperatures relative to daytime peaks is the very very very dry deserts and Antarctica is the CO2 signature. Check those data sets and you don’t find a signature, in fact many of the likely areas show cooling.
Looks like the theory developed on the fly in an above post has already been thought of.
This is what was concocted above as a theory. Seems it isn’t too far off. Question is how can we reach this conclusion simply posting on a blog and the “real” climate “scientist” fail to grasp the simplest of concepts?
” It is likely due to hotter days being more humid, and having greater upward convection. H20 is an effective heat sink in the atmosphere so it is quickly pulled away from the surface to higher altitudes.”
While this might be true in the tropics, it is not true in Ohio, the hotter days are humid, and when dry Canadian air moves in, the max temp is much cooler.
Here are the Death Valley data. There is almost a 15°C drop in almost any month. Death Valley is a control for CO2, because there is very very very little H2O. If climate “science” were a real science, you would find easily published data showing that the spread has narrowed over time. That would have been the starting point of any effort to “settle” this science. Does anyone know of any research showing that the spread between day and night temperatures in death valley have been narrowing? That is a simple data analysis to start making the case for CO2.
based on climate statistics gathered from 1981 to 2010.
Average Death Valley temperatures
High °F Low °F High °C Low °C
67 40 January 19 4
73 46 February 23 8
82 55 March 28 13
91 62 April 33 17
101 73 May 38 23
110 81 June 43 27
117 88 July 47 31
115 86 August 46 30
107 76 September 41 24
93 62 October 34 16
77 48 November 25 9
65 38 December 18 4
91 63 Year 33 17
More info on Death Valley. You can literally freeze to death in death valley.
How Often Death Valley Has Cold Temperatures
Death Valley winters are considerably cooler than the other seasons. On about half of winter nights, the thermometer drops below 40 degrees. The desert averages seven nights a year of freezing weather, which can occur in December, January and February. Any overnight frost normally thaws the next day, as daytime highs are typically always above 32 degrees.
https://www.currentresults.com/Weather/California/Places/death-valley-temperatures-by-month-average.php
Highest temps at Death Valley (F):
1913: 134°
1960, 1998, 2005, 2007, 2013: 129°
Lowest temps:
1913: 15°
1928: 18°
1919, 1924, 1950: 19°
1912, 1922, 1963, 1990: 20°
High and low record temps were set in 1913.
Warmest mean max summers (Jun-Jul-Aug):
1917: 117.9°
1994: 117.2°
1996: 117.0°
2006: 116.8°
2002: 116.6°
Coldest mean max summers:
1983: 107.9°
1982: 108.9°
1941: 108.8°
1976: 109.6°
1965: 109.7°
1944: 110.0°
Coldest mean min winters (Dec-Jan-Feb):
1928: 32.4°
1919: 32.5°
1913: 32.9°
1946: 35.3°
1950: 36.2°
1998: 32.4°
Warmest mean min winters:
2005, 2015: 46.5°
1978: 46.0°
1980: 44.3°
Looks like winters aren’t as cold as they used to be.
I plotted July low-high mean temp differentials from 1923-2015 in Excel and see no trend. Of course that’s not the same as averaging daily day-night differentials.
” Of course that’s not the same as averaging daily day-night differentials.”
I would love to have a second person do this, replicate my results, but you have to split the days, so you compare the cooling of the prior days warming, a thermal cycle.
That coldest mean winter in 1998 is a real eye opener. As is the lowest temp in 1990. More interesting is the clustering of the peak temperatures for the record highs. That implies that we have cleaner air, clearer air, a warmer sun, of all three.
co2islife:
“That coldest mean winter in 1998 is a real eye opener.”
Arg. I misread/mistyped. Temps there are in ascending order. 1998 is 6th coldest at 37.4°F.
Sorry about that, and thanks for opening my eyes to it.
micro6500:
I have the daily max/min through 2014 for Death Valley and Greenland Ranch that preceded it, maybe I’ll give it a shot. You also have to watch for time of observation. If it’s AM then max is the previous day. I noticed that in NOAA’s record temperatures they don’t bother to correct the date for record highs.
” If it’s AM then max is the previous day.”
I’ve done my work with the global summary of days data set, it doesn’t have time stamps, and they might actually correct for that.
But, my code allows me to reject stations that don’t get enough daily samples or enough years , for 1940 to 2014 with 360 samples per year, there’s over 70 million samples.
Imagine a min and max are swapped, the difference will be the negative sign, for the day before, but the day after will also have the opposite sign, which averages out, so I think in the end, it’s not a very big deal.
I have avoided trying to out correct the people who took the measurements, I figure they are the only people who have a clue on what the error is, and how to correct it.
But, if you’re going to try this, think it through, and let me know.
“I have avoided trying to out correct the people who took the measurements, I figure they are the only people who have a clue on what the error is, and how to correct it.”
I’m not sure what you’re referring to. I’ve talked with people who take the measurements at COOP stations here in Arizona who tell me the measurements they submit are not always what appear in online data sources. Years ago I noticed that “old” data from WRCC didn’t jibe with “new and improved” SCENIC “historic station data lister” for a local station. I printed out the two daily listings side-by-side and compared them to hand-written station records at the local station. Where the WRCC and SCENIC readings disagreed, some from WRCC matched the written records, some from SCENIC.
The ranger who ran that station took measurements morning and afternoon and submitted them by telephone to the NWS. He insisted on doing this because the high temperature for the day sometimes occurred after his 1700 observation. Perhaps this confused some of those tasked with recording the information.
I first noticed this issue because there was a record low high listed on the NWS website that correctly listed the high temperature that occurred after 1700 on 19 Aug 2014. When the “official” record first appeared at the NOAA site it was colder, as they used the 1700 observation. It was later corrected.
NOAA lists another record low high at a station a few miles away that takes measurements at 0700. Problem with that record is that it’s listed for 20 Aug, not 19 Aug when the low high actually occurred. Since the previous low high occurred when the station was recording at 1700, NOAA actually compared 19 Aug with 20 Aug for that daily record.
” I’m not sure what you’re referring to. I’ve talked with people who take the measurements at COOP stations here in Arizona who tell me the measurements they submit are not always what appear in online data sources.”
This is the kind of thing, if your looking at a small are, and know the people taking the measurements and have original measurements, great, but the people taking measurements in the 30’s are likely gone, I think it’s likely any changes now would make the less accurate.
I have over 130 million records, I can’t manually fix them, and any programmatic process is more likely to be wrong.
According to NOAA’s records, the Highest Max Temperature record for Beaver Dam, AZ, was tied on 19 Aug 2014 with a TMAX of 111°.
Beaver Dam switched from 1800 to 0700 observations in Dec 1990, after which TMAX at Time of Obs is actually the previous day’s high. So the 111° TMAX actually occurred on 18 Aug, not 19 Aug.
High temperature on 19 Aug 2014 was actually 88°. The record Lowest Max Temperature for Beaver Dam on 19 Aug is 88°, set in 1984 when Time of Obs was 1800.
So, contrary to NOAA records, Beaver Dam actually tied the record for Highest Max Temperature on 18 Aug and tied the record for Lowest Max Temperature on 19 Aug.
(People at NOAA are aware of this issue but don’t care to discuss it.)
Another minor correction to my compilation of numbers: 1941 is the second coldest mean max summer, not the third. Correct order:
Coldest mean max summers:
1983: 107.9°
1941: 108.8°
1982: 108.9°
1976: 109.6°
1965: 109.7°
1944: 110.0°
“O, what a tangled web we weave, when first we practice to deceive.”
The warmist consensus on this thread is suggesting that CO2 should not be expected to raise daytime temperatures. It’s signal is in higher lows. If CO2 cannot raise daytime temps, as many warmists on here are asserting, where does the 33C come from in Hansen’s model.
Are we to believe that without CO2, the earth would be at -18C? And since CO2 is only going to reduce cooling does this mean that daytime and nighttime temperatures would be constant at this number? Because if it never gets above -18C, it would have to stay at that number 24/7.
Deserts and tropics prove water vapor cools. So you can’t blame higher temps (33C above black body) on the greenhouse gas of water vapor.
If CO2 and H2O can’t raise daytime temps, the GHG null hypothesis is validated. AGW is a scam, and the 33C is a gravitational effect derived from the established gas laws as validated by measurements on other gaseous planets.
Time of Observation for Greenland Ranch (now Death Valley USC00043603) and Death Valley (USC00042319) in data downloaded today from CDO-Web is listed as 0800 from Jun 1911 through Oct 2015. This is absurdly wrong, as can easily be seen by comparing TOBS with TMAX and TMIN. If TMAX is 102° and TOBS is 100°, it should be clear to anyone with an iota of logic that Time of Obs is not 0800.
An older data file from another source shows Time of Obs as 1800 from 1958 until it changed to 0800 in 1982. It was in the early ’80s that NOAA started encouraging COOPs to switch to AM Time of Obs.
Today’s file shows a change from 0800 to 2400 in Nov 2015. The station is now automated and is no longer a COOP.
What Christy and McNider write about was named the “warming hole” by Pan et al. and there are several papers over the last 20 years or so discussing it. Just google “warming hole”