Guest essay by Quang M. Nguyen, P.E.

Summary
As suggested monthly by the mainstream media since April 2015, NOAA and NASA officially declared that 2015 surpassed the 2014 record to become the new hottest year on record and that 2016 could be hotter than 2015! The average global temperatures calculated by NOAA and NASA, however, appear to be inaccurate and unreliable for the following reasons:
- According to data on the NOAA website, 1997 was truly the hottest year on record at 62.45 oF. The average global temperature in 2015 was 58.62 oF or 3.83 oF below the 1997 temperature.
- According to data on the NOAA website, the temperatures such as the 20th century average temperature and annual temperature anomalies, which must be fixed, have different values in the annual global analyses.
- NOAA and NASA corrected historical temperature data and fabricated temperature data in areas without temperature record systematically, widely, and uni-directionally to “cool” the past in an attempt to prove the soaring temperature trend.
- NOAA and NASA made efforts to discredit their own satellite data – which is consistent with the balloon data – because it suggests a global warming hiatus since 1998 contradicting with the NOAA and NASA preferred narrative.
- NOAA and NASA refused to give data and information requested by the US House of Representatives Science, Space and Technology committee. There is no reason for them to withhold the data and information, which are public domain, unless they have something to hide.
The headline “last year was the hottest year on record, this year is hotter than last year, and next year could be hotter than this year” is likely to be repeated years after years until funding for climate change is stopped!
INTRODUCTION
As suggested monthly since April 2015 [1-9], the mainstream media today announces that: “It’s official: 2015 was the hottest year on record” [10-13]. This “hot news” was delivered immediately after the National Centers for Environmental Information (NCEI) of the National Oceanic and Atmospheric Administration (NOAA) issued its “Global Analysis – Annual 2015” [14]. According to this 2015 global analysis, “… the average global temperature across land and ocean surface areas for 2015 was 0.90°C (1.62°F) above the 20th century average of 13.9°C (57.0°F), beating the previous record warmth of 2014 by 0.16°C (0.29°F)” to become the hottest year on record. “We’re really looking at a long-term trend, and this is just a symptom of a long-term trend,” and “if 2016 turns out to be as warm as we anticipate, that would be unprecedented in our record book,” said Gavin Schmidt, director of the Goddard Institute for Space Studies (GISS) of the National Aeronautics and Space Administration (NASA) [10,15]. That is not surprised because a report published previously by the British Met Office suggested that “next year [2016] will likely be the warmest on record thanks to El Niño and ongoing climate change” [16].
However, there are evidences indicating that the average global temperatures calculated by NOAA and NASA appear to be inaccurate, unreliable, and especially inconsistent with the satellite temperature data. This paper is an attempt to understand why, for a long time, the average global temperatures calculated by NOAA and NASA have been considered by “skeptical” scientists and meteorologists as a fraud, or diplomatically, unscientific!
UNDENIABLE EVIDENCES
Concerns regarding the accuracy and reliability of the average global temperatures calculated by NOAA and NASA were not given close and thoughtful attention until NASA declared that: “The planet’s temperature departure from the long-term average of 1.04 Celsius in October [2015] is the greatest of any month ever recorded by NASA. It marked the first time a monthly temperature anomaly exceeded 1 degrees Celsius in records dating back to 1880. The previous largest anomaly was 0.97 Celsius from January, 2007.” [17] Since then, many evidences have been discovered and posted on the internet.
Which year was the hottest year on record?
The NOAA’s Global Analysis – Annual 2015 [14] states that, “… the average global temperature across land and ocean surface areas for 2015 was 0.90°C (1.62°F) above the 20th century average of 13.9°C (57.0°F), beating the previous record warmth of 2014 by 0.16°C (0.29°F).” As a result, the average global temperature across land and ocean surface areas for 2015 was 14.8 oC or 58.62 oF. The NOAA’s Global Analysis – Annual 1997 [18] states that, “The global average temperature of 62.45 degrees Fahrenheit for 1997 was the warmest year on record, surpassing the previous record set in 1995 by 0.15 degrees Fahrenheit.”
Based on these NOAA’s global analyses, the average global temperature for 1997, i.e. 16.92 oC or 62.45 oF, was higher than that for 2015, i.e. 14.80 oC or 58.62 oF by 2.12 oC or 3.83 oF. Therefore, 1997 was actually the hottest year on record, surpassing all subsequent years including 2015!
Constant parameters with varying values
A few temperature parameters that must be constants are shown with varying values in the NOAA global analyses. Without close attention, it is difficult to recognize because they are located in individual analyses.
The first parameter that has direct effects on the NOAA assessment is the 20th century average. In the annual global analyses prior to 2010, the 20th century average is shown as 56.9 oF or 13.9 oC (actually, it should be 13.83 oC. Its value is shown as 57.0 oF or 13.9 oC from 2010 to present [19].
Additionally, in the Global Analysis – August 2015 [20], NOAA reported: “The combined average temperature over global land and ocean surfaces for August 2015 was 0.88°C (1.58°F) above the 20th century average of 15.6°C (60.1°F) and the highest August in the 136-year record.” The variation of the value for the 20th century average has not been explained by NOAA or NASA.

Table 1 – Varying values of annual anomalies
The second parameter is the annual anomaly, i.e. the difference between the annual average global temperature and the 20th century average. The value of this parameter, which must be a constant, varies from analyses to analyses. For example, the 2010 anomaly – which is shown as 1.12 oF in the Global Analysis – Annual 2010 – increases to 1.15 oF in the 2011 Analysis and to 1.19 oF in the 2012 and 2013 Analyses, decreases to 1.17 oF in the 2014 Analysis and then increases again in the 2015 Analysis, as shown in Table 1.
Correct and fabricated temperature data
Questions regarding the reliability, accuracy, and adequacy of the temperature data used by NOAA and NASA to calculate the average global temperature were raised by Joseph D’Aleo, the first Director of Meteorology and co-founder of the cable TV Weather Channel, and Anthony Watts, a 25-year broadcast meteorology veteran and currently a meteorologist for KPAY-AM radio and the report published by the Science & Public Policy Institute (SPPI) in 2010 [21].
Following an inclusive assessment of the surface temperature record of Climatic Research Unit (CRU) of the East Anglia University in United Kingdom, NASA’s GISS, and NOAA’s National Climatic Data Center (NCDC), the authors concluded that: “Instrumental temperature data for the pre-satellite era (1850-1980) have been so widely, systematically, and uni-directionally tampered with that it cannot be credibly asserted there has been any significant ‘global warming’ in the 20th century… Global terrestrial temperature data are compromised because more than three quarters of the 6,000 stations that once reported are no longer being used in data trend analyses… In the oceans, data are missing and uncertainties are substantial. Changes in data sets introduced a step warming in 2009.”
The D’Aleo and Watts report encouraged additional assessments by other scientist around the word to scrutinize adjustments or fabrication of temperature data in the NCDC and CRU databases. These additional assessments confirm that NOAA and NASA, systematically and widely, adjusted historic data and fabricated temperature data in areas with no measurements [22-35] to “cool the past” in order to show the increasing global temperature trend as interpreted by NOAA and NASA (See Figure 1).

Figure 1 – NASA “cools” the past to the prove global warming trends [22]
Discredit the satellite data
Since 1978, NOAA has used weather satellites to monitor the temperature of the earth atmospheric. According to a study conducted by NASA in 1990 [36], “while several government and university meteorologists around the world have concluded that average surface temperature have increased significantly in recent years, the report’s author said that their satellite analysis of the upper atmosphere is more accurate, and should be adopted as the standard way to monitor global temperature change.”

Figure 2 – Satellite’s temperature anomalies of the global lower atmosphere [37]

Figure 3 – NASA’s global land-ocean temperature anomalies [38]
Satellite data from 1979 (Figure 2) shows that the temperature of the global lower atmosphere has not risen since 1998, contradicting with the NASA’s soaring trend, as shown in Figure 3. For that reason, NOAA and NASA have made efforts to discredit the temperature data collected by their own satellites.
The first effort was a study conducted by Thomas R. Karl, director of NOAA’s National Centers for Environmental Information (NCEI), and his NOAA colleagues. The study, which was published online in the journal Science [39], concludes that: “Much study has been devoted to the possible causes on an apparent decrease in the upward trend of global surface temperature since 1998, a phenomenon that has been dubbed the global warming ‘hiatus.’ Here, we present an updated global surface temperature analysis that reveals that global trends are higher than those reported by the Intergovernmental Panel on Climate Change, especially in recent decades, and that the central estimate for the rate of warming during the first 15 years of the 21st century is at least as great as the last half of the 20th century [Figure 4]. These results do to support the notion of a ‘slowdown’ in the increase of global surface temperature.”

Figure 4 – NOAA’s global temperature trend analyses [Internet]
The second effort was a propaganda video, which was participated by the “famous climate scientists” such as Michael Mann (the author of “The Hockey Stick”), Kevin Trenberth (admitting that “it’s a travesty that we can’t account for the lack of warming at the moment”), and Ben Santer. The video was funded by a climate activist foundation to cast doubt on the satellite data [40]. But this video appears to be a slap in their face because (1) the satellite data is verified by the independent balloon data (Figure 5) while the temperature data calculated by NOAA and NASA is not verified, (2) the use of satellite for monitoring the global temperature changes was recommended by NASA, and (3) Jason-3 – the latest weather satellite launched into orbit – is an international mission in which NOAA is partnering with NASA, the Centre Nationale d’Études Spatiales (CNES), the French Space Agency, and the European Organisation for the Exploitation of Meteorological Satellite (EUMETSAT)) [41].

Figure 5 – Satellite data verified by balloon data [40]
Hide data and methods used for scientific investigations
In July 2015, concerning the scientific integrity of the NOAA study to prove “no pause in global warming,” Rep. Lamar Smith (R-Texas), the US House of Representatives Science, Space and Technology committee Chairman, asked NOAA for both data and documents related to the study. Although Rep. Smith request was legitimate and the requested information is public domain, NOAA refused to give the committee the requested dada and information because “it is a long-standing practice in the scientific community to protect the confidentiality of deliberative scientific discussions” [42]. Why did NOAA refuse the request? “There is absolutely no reason for the NOAA to withhold their information unless they have something to hide. And as a federal agency it is their obligation to cooperate with Congressional oversight” [42].
NOAA continued to withhold the requested data and information until Judicial Watch filed a lawsuit, on December 2, 2015, seeking the same documents subpoenaed by the House committee. The lawsuit sued the Department of Commerce (DOC) for failing to respond a Freedom of Information Act (FOIA) request because NOAA is a component of the DOC. On December 15, 2015, NOAA began to turn over the requested documents to Congress [43].
The depth of problems in NOAA’s data practices was probably revealed for the first time in 2007 when climatologist Roger Pielke and meteorologist Anthony Watts found serious problems with the US surface temperature monitoring network, which was administered by the National Climatic Data Center (NCDC), a branch of the NOAA. They made an effort to validate this network, but “the NCDC removed all website access to station site locations, citing ‘privacy concerns.’ Without this data (which had been public for years), the validation effort was blocked” [44].
CONCLUSIONS
As repeated frequently by the mainstream media since April 2015, NOAA and NASA officially declared that 2015 was hotter than 2014, the old hottest year on record and “promised” that 2016 could be hotter than 2015! However, the are undeniable evidences indicating that the average global temperatures calculated by NOAA and NASA appear to be inaccurate, unreliable and inconsistent with the satellite data.
According to data on the NOAA website, 1997 was truly the hottest year on record at 62.45 oF. The average global temperature in 2015 was 58.62 oF or 3.83 oF below the 1997 temperature.
According to data on the NOAA website, the parameters such as the 20th century average temperature and the annual temperature anomalies, which must be constants, have varying values in the annual global analyses.
NOAA and NASA corrected historical temperature data and fabricated temperature data in areas without temperature record systematically, widely, and uni-directionally to “cool” the past in an attempt to prove the soaring temperature trend.
NOAA and NASA made efforts to discredit their own satellite data – which is consistent with the balloon data – because it suggests a global warming hiatus since 1998 contradicting with the NOAA and NASA preferred narrative.
NOAA and NASA refused to give data and information requested by the US House of Representatives Science, Space and Technology committee. There is no reason for them to withhold the data and information, which are public domain, unless they have something to hide.
The headline “last year was the hottest year on record, this year is hotter than last year, and next year could be hotter than this year” is likely to be repeated years after years by the mainstream media until funding for climate change is stopped!
REFERENCES
[1] Andrea Thompson. April 17, 2015. “2015 Hottest Year to Date, Could Top 2014 Record.” Climate Central. http://www.climatecentral.org/news/2015-hottest-year-to-date-18895
[2] Jay Michaelson. May 16, 2015. “2015 Is the Hottest Year On Record.” The Daily Beast. http://www.thedailybeast.com/articles/2015/05/16/2015-is-the-hottest-year-on-record.html
[3] Jon Edrman. Jun 18, 2015. “2015 Still On Pace as Hottest Year On Record.” The Weather Channel. http://www.weather.com/news/climate/news/earth-warmest-january-may-2015
[4] Brian Clark Howard. July 24, 2015. “See Why 2015 May Be the Hottest Year Ever.” National Geographic. http://news.nationalgeographic.com/2015/07/071524-this-year-may-be-hottest-ever/
[5] Andrea Thompson. August 20, 2015. “2015 May Just Be Hottest Year on record.” Scientific American. http://www.scientificamerican.com/article/2015-may-just-be-hottest-year-on-record/
[6] Adam Vaughan. September 17, 2015. “US science agency says 2015 is 97% likely to be the hottest year on record.” The Guardian. http://www.theguardian.com/us-news/2015/sep/17/2015-hottest-year-on-record-noaa
[7] Justin Gillis. October 21, 2015. “2015 Likely to Be Hottest Year Ever Recorded.” The New York Times. http://www.nytimes.com/2015/10/22/science/2015-likely-to-be-hottest-year-ever-recorded.html?_r=0
[8] WMO. 25 November 2015. “WMO: 2015 likely to be Warmest on Record, 2011-2015 Warmest Five Year Period.” WMO. https://www.wmo.int/media/content/wmo-2015-likely-be-warmest-record-2011-2015-warmest-five-year-period
[9] Tom Randall. December 17, 2015. « A White-Hot Christmas Wraps Up Earth’s Hottest Year on Record.” Bloomberg Business. http://www.bloomberg.com/news/features/2015-12-17/a-white-hot-christmas-wraps-up-earth-s-hottest-year-on-record
[10] Jason Plautz. January 20, 2016. “It’s Official: 2015 Was Hottest Year on Record.” National Journal. http://www.nationaljournal.com/s/399249/its-official-2015-was-hottest-year-record?mref=scroll
[11] Brandon Miller. January 20, 2016. “2015 is warmest year on record, NOAA and NASA say.” CNN. http://www.cnn.com/2016/01/20/us/noaa-2015-warmest-year/
[12] Alyssa Newcomb. January 20, 2016. “Earth Had Its Hottest Year on Record in 2015, Says NASA, NOAA.” ABC News. http://abcnews.go.com/Technology/earth-hottest-year-record-2015-nasa-noaa/story?id=36400929
[13] Justin Gillis. January 20, 2016. “2015 Was Hottest Year in Historical Record, Scientists Say.” The New York Times. http://www.nytimes.com/2016/01/21/science/earth/2015-hottest-year-global-warming.html
[14] National Centers for Environmental Information. Retrieved January 20, 2016. “Global Analysis – Annual 2015.” NOAA. http://www.ncdc.noaa.gov/sotc/global/201513
[15] Deborah Netburn. January 20, 2016. “2015 was the hottest year on record, and the forecast for 2016 is warmer yet.” The Los Angeles Times. http://www.latimes.com/science/sciencenow/la-sci-sn-2015-hottest-year-20160119-story.html
[16] Justin Worland. December 17, 2015. “2016 Expected to Be the Warmest Year on record, Report Says.” Time. http://time.com/4154331/warmest-year-2016-climate-change-el-nino/
[17] Jason Samenow. November 17, 2015. “Record-crushing October keeps Earth on track for hottest year in 2015.” The Washington Post. https://www.washingtonpost.com/news/capital-weather-gang/wp/2015/11/17/record-crushing-october-keeps-earth-on-track-for-hottest-year-in-2015/
[18] NOAA National Climatic Data Center, State of the Climate: Global Analysis for Annual 1997, published online January 1998, retrieved on May 4, 2015 from http://www.ncdc.noaa.gov/sotc/global/199713
[19] National Centers for Environmental Information. “State of the Climate: Global Analysis.” NOAA. http://www.ncdc.noaa.gov/sotc
[20] NOAA National Centers for Environmental Information, State of the Climate: Global Analysis for August 2015, published online September 2015, retrieved on January 22, 2016. http://www.ncdc.noaa.gov/sotc/global/201508
[21] Joseph D’Aleo and Anthony Watts. August 27, 2010. Surface Temperature Records: Policy-Driven Deception? Science & Public Policy Institute.http://scienceandpublicpolicy.org/images/stories/papers/originals/surface_temp.pdf
[22] Paul Homewood. January 29, 2015. “Temperature Adjustments Around the World.” Not A Lot of People Know That. https://notalotofpeopleknowthat.wordpress.com/2015/01/29/temperature-adjustments-around-the-world/
[23] Christopher Booker. February 7, 2015. “The fiddling with temperature data is the biggest science scandal ever.” The Telegraph. http://www.telegraph.co.uk/news/earth/environment/globalwarming/11395516/The-fiddling-with-temperature-data-is-the-biggest-science-scandal-ever.html
[24] Selwyn Duke. February 9, 2015. “Global Conning: temperature Data Cooked in ‘Biggest Science Scandal Ever’.” The New American. http://www.thenewamerican.com/usnews/item/20081-global-conning-temperature-data-cooked-in-biggest-science-scandal-ever?utm_source=Newsletter&utm_campaign=d162567509-The_Editors_Top_Picks_3_12_143_12_2014&utm_medium=email&utm_term=0_8ca494f2d2-d162567509-289802733
[25] James Delingpole. February 7, 2015. “’Breathtaking’ Adjustments to Arctic Temperature Record. Is There Any ‘Global Warming’ We Can Trust?” Breitbart. http://www.breitbart.com/london/2015/02/07/breathtaking-adjustments-to-arctic-temperature-record-is-there-any-global-warming-we-can-trust/
[26] John Hinderaker. May 5, 2015. “NOAA Caught Rewriting US Temperature History (Again).” Powerline. http://www.powerlineblog.com/archives/2015/05/noaa-caught-rewriting-us-temperature-history-again.php
[27] Paul Homewood. July 20, 2015. “NOAA Tampering Exposed.” Not A Lot of People Know That. https://notalotofpeopleknowthat.wordpress.com/2015/07/20/noaa-tampering-exposed/
[28] John Hinderaker. September 27, 2015. “Almost All US Temperature Data used in Global Warming Models Is Estimated or Altered.” Powerline. http://www.powerlineblog.com/archives/2015/09/almost-all-us-temperature-data-used-in-global-warming-models-is-estimated-or-altered.php
[29] John Goetz. September 27, 2015. “Approximately 92% (or 99%) of USHCN surface temperature data consists of estimated values.” Watts Up With That. http://wattsupwiththat.com/2015/09/27/approximately-92-or-99-of-ushcn-surface-temperature-data-consists-of-estimated-values/
[30] Larry Bell. November 17, 2015. “Data Tweaking heats up climate hype.” CFACT. http://www.cfact.org/2015/11/17/data-tweaking-heats-up-climate-hype/
[31] Tony Heller. November 19, 2015. “Record Crushing Fraud From NOAA And NASA Ahead of Paris.” The Real Climate Science. http://realclimatescience.com/2015/11/record-crushing-fraud-from-noaa-and-nasa-ahead-of-paris/
[32] Judith Curry. November 5, 2015. “Is the government tinkering with global warming data?” Fox News. http://www.foxnews.com/opinion/2015/11/05/is-government-tinkering-with-global-warming-data.html
[33] Paul Homewood. November 21, 2015. “NOAA’s Fabricated ‘Record Temperatures’.” Not A Lot People Know That. https://notalotofpeopleknowthat.wordpress.com/2015/11/21/noaas-fabricated-record-temperatures/
[34] P Gosselin. November 20, 2015. “’Massive Altered’… German Professor Examines NASA GISS Temperature Datasets.” NoTricksZone. http://notrickszone.com/2015/11/20/german-professor-examines-nasa-giss-temperature-datasets-finds-they-have-been-massively-altered/#sthash.lEDY4hkl.TeBUOeAB.dpbs
[35] Steven Goddard. November 22, 2015. “NOAA Data Tampering – Much Worse Than It Seems.” Real Science. https://stevengoddard.wordpress.com/2015/11/22/noaa-data-tampering-much-worse-than-it-seems/
[36] Steven Goddard. January 7, 2014. “NASA 1990: No Global Warming – Surface Temperature Record Should Be Replaced by More Accurate Satellites.” Real Science. https://stevengoddard.wordpress.com/2014/01/07/nasa-1990-no-global-warming-surface-temperature-record-should-be-replaced-by-more-accurate-satellites/
[37] Barbara Hollingsworth. January 21, 2016. “NASA/NOAA: 2015 ‘Warmest Year on Record’ – Except Earth’s Lower Atmosphere.” CNSNews. http://www.cnsnews.com/news/article/barbara-hollingsworth/nasanoaa-2015-warmest-year-record-except-earths-lower-atmosphere
[38] Goddard Institute for Space Studies. Retrieved on January 23, 2016. “GISS Surface temperature Analysis.” NOAA. http://data.giss.nasa.gov/gistemp/graphs_v3/
[39] Thomas R. Karl, et al. June 26, 2015. ”Possible artifacts of data biases in the recent global surface warming hiatus.” Science, Vol. 348, Issue 6242. http://science.sciencemag.org/content/sci/348/6242/1469.full.pdf
[40] Ronald Bailey. January 15, 2016. “Global Temperature Trend Propaganda Video: Who Needs Pier Review?” Reason.com. http://reason.com/blog/2016/01/15/global-temperature-trend-propaganda-vide
[41] Satellite and Information Service. January 17, 2016. “Jason-3 Officially Reaches Orbit!” NOAA. http://www.nesdis.noaa.gov/jason-3/
[42] Jeff Dunetz. October 28, 2015. “Why Is NOAA Hiding its Climate Data from Congress?” The Lid. http://lidblog.com/why-is-noaa-hiding-its-climate-data-from-congress/#
[43] Judicial Watch. December 22, 2015. “Judicial Watch Sues for Documents Withheld From Congress in New Climate Data Scandal.” Judicial Watch. http://www.judicialwatch.org/press-room/press-releases/judicial-watch-sues-for-documents-withheld-from-congress-in-new-climate-data-scandal/
[44] Michael Asher. August 7, 2007. “New Scandal Erupts over NOAA Climate Data.” Daily Tech. http://www.dailytech.com/New+Scandal+Erupts+over+NOAA+Climate+Data/article8347.htm
Gosh, that beautiful red sunset makes me yearn for summer….
When you have the first sleet in subtropical Okinawa since weather records began there in the 1600’s
https://en.wikipedia.org/wiki/January_2016_East_Asia_cold_wave
In late January 2016, a cold wave struck much of East Asia, parts of mainland Southeast Asia and parts of northern South Asia, bringing record cold temperatures and snowfall to many regions. sleet was reported in Okinawa for the first time on record, and many other regions saw their coldest temperatures in decades
And sub-tropical Amami-Oshima island ~150 miles north east of Okinawa gets snow —
http://www.japantimes.co.jp/news/2016/01/24/national/heavy-snow-hits-western-central-japan/#.VrIYxjZf2cx
Heavy snow clobbers central, western Japan
The first snowfall in almost 115 years was recorded on Amami-Oshima island, a subtropical island located some 380 km (235 miles) southwest of the city of Kagoshima, while temperatures fell to record lows in western and southern Japan.
There is a problem with Global warming models.
Frankly, there is accumulating evidence — like snow! — that were are in an emerging, solar inactivity driven, mini-ice age cooling period, not human caused period of warming.
I am in awe of these “scientists” who can predict where 2016 will be one month into the year
Both satellite data sets show a record high January, even above 1998. And in 1998, the final average was very close to the January anomaly. Will it happen this year? I do not know, but with similar ENSO numbers for 1997 and 2015, it certainly cannot be ruled out.
Early last year I spent quite a lot of time trying to understand the outputs of homogenization processes. I do not think that there is deliberate manipulation of the data. Rather there are very strong biases in how data output is analyzed – or rather it is not analyzed. I like to quote one very articulate blogger explaining the homogenization process.
That is, if something is outside our capacity to explain and understand, then we should reject it. If you believe that warming should be happening and there are thermometers that find cooling, then you reject it. If on the other hand there is a genuine, but slight, UHI bias (and many of the thermometers are in cities) then you will accept it.
As an example of the bias, the climate experts are left scratching their heads about the pause. The theory says if the rate of emissions increases accelerates to the extent they have, so should the warming rates. It is the same biases on temperature data that cause the multiple (and often contradictory) explanations for the pause. Over 50 are listed at the WUWT excuses page.
With normal science, we try to understand the real world by rigorously testing out hypotheses against the data. If there is a conflict the hypotheses are modified or rejected. But in climatology, if the real world data does not conform to our collective understanding, then the data must be biased and gets amended.
“NOAA and NASA made efforts to discredit their own satellite data – which is consistent with the balloon data – because it suggests a global warming hiatus since 1998 contradicting with the NOAA and NASA preferred narrative.”
No, they do not discredit their own data.
An example of the biases in temperature data (and not I believe of deliberate tampering) is the Gistemp breakdown of temperature anomalies by eight bands of latitude.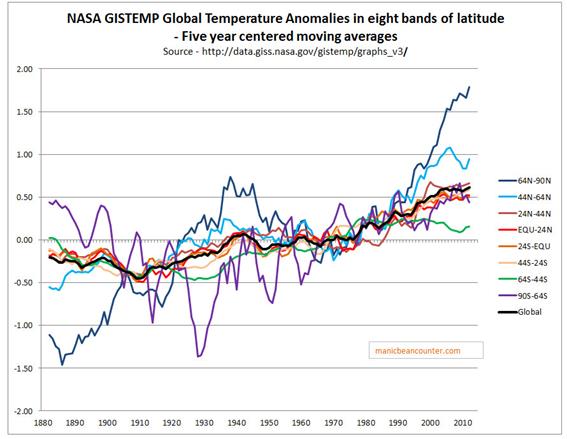 ?w=600
The most surprising is the most southerly, covering 5% of the earth’s surface and covering an area slightly bigger than Antarctica. There is massive cooling to 1930, going against (and helping to cancel) the warming trend in the Arctic. But how did they manage to get temperature data for Antarctica before the late 1950s when the first permanent bases were established? They used as a proxy a small island with its own micro climate that is quite different from anywhere else.
https://manicbeancounter.com/2015/05/24/base-orcadas-as-a-proxy-for-early-twentieth-century-antarctic-temperature-trends/
Thanks, Quang M. Nguyen.
It will be warmer, we pay them to make it so.
Very nice summary about moving average temperatures – ie average temperatures which keep moving. It is interesting that we were still in the ice ages during the 20th century – at 13.9 o C global mean temperature… What happened to the Planets anticipated temperature of 288 K by the solar insolence 1342 watts per square meter… Forget about radiative forcing – we can calculate the hot air see https://www.academia.edu/21176248/21st_Century_Global_Anthropogenic_Warming_Convective_Model [one typo in page 5 col 2 line 24 — 0.066 oC should have been 0.66 oC] –