In the tropics, warmest August in the satellite temperature record
Global climate trend since Nov. 16, 1978: +0.11 C per decade
August temperatures (preliminary)
Global composite temp.: +0.28 C (about 0.50 degrees Fahrenheit) above 30-year average for August.
Northern Hemisphere: +0.25 C (about 0.45 degrees Fahrenheit) above 30-year average for August.
Southern Hemisphere: +0.31 C (about 0.56 degrees Fahrenheit) above 30-year average for August.
Tropics: +0.52 C (about 0.94 degrees Fahrenheit) above 30-year average for August.
July temperatures (revised):
Global Composite: +0.18 C above 30-year average
Northern Hemisphere: +0.33 C above 30-year average
Southern Hemisphere: +0.03 C below 30-year average
Tropics: +0.48 C above 30-year average
(All temperature anomalies are based on a 30-year average (1981-2010) for the month reported.)


Notes on data released Sept. 8, 2015:
Driven by a growing El Niño Pacific Ocean warming event, temperatures around the globe continued to rise through August, setting a new August record in the tropics for the satellite record, said Dr. John Christy, director of the Earth System Science Center at The University of Alabama in Huntsville. Temperatures in the tropics averaged 0.52 C (about 0.94° F) warmer than seasonal norms in August, surpassing the previous record of +0.46 C set in August 1998.
Globally it was the third warmest August in the satellite record, trailing only August 1998 and 2010. It was also the third warmest August in the Southern Hemisphere, behind August 1998 and August 2002.
Compared to global temperature anomalies from all months, August 2015 tied as the 32nd warmest month since the satellite record began in December 1978. It was tied with five other months, all since October 2005. In the tropics, August 2015 tied with September 2009 as the 17th warmest month, when compared to seasonal norms for all months.
Compared to seasonal norms, the warmest average temperature anomaly on Earth in August was in eastern Russia, near the town of Aldan. The August temperature there averaged 3.01 C (about 5.42 degrees F) warmer than seasonal norms. Compared to seasonal norms, the coolest average temperature on Earth in August was in East Antarctica Concordia Station, where the average August 2015 temperature was 3.35 C (about 6.03 degrees F) cooler than normal.
The complete version 6 beta lower troposphere dataset is available here:
http://vortex.nsstc.uah.edu/data/msu/v6.0beta/tlt/uahncdc_lt_6.0beta3
Archived color maps of local temperature anomalies are available on-line at:
As part of an ongoing joint project between UAHuntsville, NOAA and NASA, Christy and Dr. Roy Spencer, an ESSC principal scientist, use data gathered by advanced microwave sounding units on NOAA and NASA satellites to get accurate temperature readings for almost all regions of the Earth. This includes remote desert, ocean and rain forest areas where reliable climate data are not otherwise available.
The satellite-based instruments measure the temperature of the atmosphere from the surface up to an altitude of about eight kilometers above sea level. Once the monthly temperature data is collected and processed, it is placed in a “public” computer file for immediate access by atmospheric scientists in the U.S. and abroad.
Neither Christy nor Spencer receives any research support or funding from oil, coal or industrial companies or organizations, or from any private or special interest groups. All of their climate research funding comes from federal and state grants or contracts.
— 30 —
Are these the satellite measurements which show the warmer August or some other measure?
If it is a different measure, it seems misleading to state Satellite Era…
Yes, this is UAH version 6 data.
Thanks, Anthony. I’ll get the new LT August temperatures map up in my climate and meteorology pages as soon as UAH has published it in their website.
Interesting. We might beat 1998 yet although region 1-2 is still lagging a bit the RRR (ridiculously resilient ridge) is more than making up for it.
Here’s hoping at least some rain fills the reservoirs in California this year.
There is absolutely no way that UAH will beat 1998 in 2015. With an 8 month average of 0.223, the average over the next 4 months needs to be 1.00 to beat 1998 this year. The highest anomaly ever was in April 1998 when it was 0.742. It is a big jump from 0.276 in August to 0.742. However while 0.742 could get beaten by December, there is no way that we can average 1.00 over the last 4 months of 2015.
The same general situation applies to RSS.
Doesn’t “32nd warmest month since the satellite record began in December 1978” mean it was the 5th coldest?
Got it, compared to ALL months, not just all Augusts. Great to see the data.
Anomalies of 0.x C.
These are statistical hallucinations not real measurements.
I disagree. These are real measurements. It is the land and sea based measurements that have been tweaked so many times they should now be classified as fiction. The satellite measurements have undergone far fewer adjustments and are the only ones I trust these days. We need data. Without data we are reduced to shouting assertions at each other, and the loudest and most committed shouters will win.
You can see that the Polar Jet Stream became more waving during August in the NH.
By the row of blobs of “warm” “cool” “warm” “cool” areas across the NH.
That is correct for UAH6.0beta3. In 2001, the August anomaly was 0.269 versus 0.276 for 2015.
However for RSS, August 2001 was 0.437 versus 0.390 for 2015, so August 2015 is the 4th warmest on RSS.
NOAA will soon be calling August the hottest ever.
Followed by NASA, for sure.
Whatever figure they are now fabricating, we in Scotland have had a cold summer.
With so many countries looking to get their snouts in the trough of global warming, the global temperature is now just a fiction.
I’d southern England Id say it was actually so perfectly normal-as-in-my-1950s-childhood as to be totally remarkable.
As if late 20th century warming had never happened…
And the Antarctic highlands are also showing excessive warming.
For August, the Temperature rose from -94 deg. C all the way up to -93.25 deg. C, so it is not just you Scots, who are getting roasted.
g
Just a reminder that the base line for the anomaly is 1981-2010 which means that what happened during the prior 10,970 years of the Holocene is taken to be irrelevant.
It seems weird to keep re-basing temperature. The Dow is now at 100. Again.
I have the UAH version 6.0 global temperature data in a spreadsheet. According to my spreadsheet the 0.28° C global temperature anomaly for August has a zero slope trend line for the last 18 years and 5 months.
Natural warming due to the latest el Niño.
Wake me when someone produces a measurement quantifying the fraction of global warming attributable to human CO2 emissions. Until then, ‘man-made global warming’ is just an opinion.
DB
So you base (in large part) your lack of acceptance on the fact that no one can give you an exact fraction of the human contribution? Really? Let me ask you this. Do you accept that smoking increases your chances of getting lung cancer. If your answer is yes, then please give me the exact fraction? If your answer is no, then that explains everything.
I think they do have that fraction quantified. with statistically significant support for the Cancers being smoking caused.
the CAGW story does not have that level of understanding. If you don’t believe that consider the total lack of errors in virtually all elements of the discussion.
That is death in science as was the norm in my time.
Logical fallacy of a false analogy.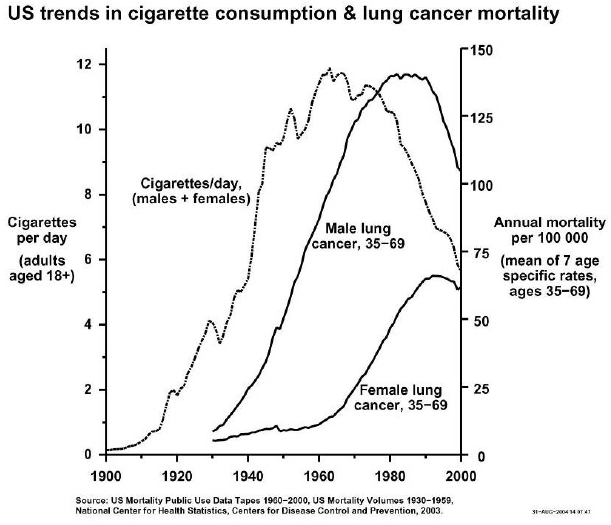
Lung cancer was virtually an unknown disease before tobacco smoking, particularly as cigarettes, became popular:
The climate has always changed and always will:
http://clivebest.com/blog/wp-content/uploads/2013/12/Global-temps.png
Sadly they don’t each logic and clear thinking in schools nowadays.
Chris
Sorry but that is not true. Lung cancer has always been a killer. Many non smokers die from it around the world. Now if you can give me an exact figure of my chances if I say…. smoke 20 a day that would be impressive. Why, because it is not statistically possible to do so. But….according to DB, unless you can I’m well within my rights to say there is no correlation between smoking and lung cancer.
I think you will find they give a band. Smoke 10 a day, your chances are ? to ?. Smoke 15 they go up to ? to ?.
Chris
“Sadly they don’t “each” logic and clear thinking in schools nowadays.”
Seems they don’t teach spelling either.
Chris
And re your logical fallacy that climate has always changed so this change can’t be caused by humans (I’m assuming that is your point). No one would ever dispute that climate has changed before and always will. And no one with any sense would deny that it always changes for a reason. So the question is why is it now? The best option at this point is it is primarily (but perhaps not all) caused by the increase in greenhouse gases. Come up with a better reason and you will be famous.
Same as it has for at least most of the last 100+ years, ocean circulation moving water heated by the sun from one place to another, dumping massive amounts of heat stored in water vapor down wind causing land based thermometers to show warming. When taken together and looked at on a yearly change, since 1940 it’s averaged 0.0F +/-0.1F for all land stations that collected at least 360 days samples per year form NCDC’s Global Summary of Days data set, 72 some million samples.
micro6500
Brilliant. Quick call every representative scientific body on the planet and tell them they are wrong.
” Come up with a better reason and you will be famous.”
“Brilliant. Quick call every representative scientific body on the planet and tell them they are wrong.”
Why? Because like you a better answer doesn’t fit their narrative even when one is presented.
Maybe you should consider how much of the Earth’s surface is actually measured in their global mean temperature, and wonder how they come up with the rest of their answers.
“Chris … And re your logical fallacy that climate has always changed so this change can’t be caused by humans (I’m assuming that is your point) …” (Simon @ur momisugly 6:40 pm) .
===========================
That is not my point, why would you assume that?
===========================
“So the question is why is it now? The best option at this point is it is primarily (but perhaps not all) caused by the increase in greenhouse gases. Come up with a better reason and you will be famous …”.
===========================
There you go again using another logical fallacy viz. appeal to ignorance: ’Argument from ignorance (Latin: argumentum ad ignorantiam), also known as appeal to ignorance (in which ignorance stands for “lack of evidence to the contrary”), is a fallacy in informal logic. It asserts that a proposition is true because it has not yet been proven false (or vice versa)’ (Wiki).
A further point Simon, it’s not “greenhouse gases” as there is no evidence of positive water vapour feedback in the system although water vapour in the form of clouds obviously plays a part probably being a net negative feedback.
Obviously, a doubling of atmospheric CO2 will cause just over 1C warming all other things being equal — and there’s the rub.
Simon. In your scenario tobacco companies could claim cigarette smoke stopped the global warming. Perhaps it already is in the pause excuses. But why tempt it?
So, how about agreeing studies on 0.3-0.5 kg rats & 50-100 kg men cannot be compared with studies on a 5 972 190 000 000 000 000 000 000 kg planet? Then the analogue can be left to religious fundamentalists etc. The rest of us are more inclined to understand measurement science anyway https://en.wikipedia.org/wiki/Metrology
Sorry Simon, the best option is as always, the Null Hypothesis. That being, whatever caused previous climate change is causing this one.
Until you can disprove the Null Hypothesis, your belief that CO2 is causing it is just a pet peeve, it fails to rise to even the level of hypothesis.
Simon, I don’t have to tell them. The scientists who have been quiting those organizations in droves have been telling the politicians that run them that already.
MarkW
Which scientists, where, when, why?
Anyway back to DB. Or not. My point is entirely relevant given he trots out the same old argument…. re you can’t give me a number so it’s not real. Am I the only one here who thinks that’s silly?
Oh noes! Not the tobacco argument again!!! Read and learn about Warmist hypocrisy on the dreaded weed. I have much more for oil, coal and natural gas too!!! Ya wanna see it?
The BBC Pension fund, as at 31 March 2013, had investments in the following tobacco companies:
Altria Group
British American Tobacco
Imperial Tobacco
Reynolds American
—
Al Gore, the climate change campaigner, has been quoted in 1996 by the New York Times saying:
Earlier in the same article the New York Times said:
—
—
One of the founders of the wildlife and climate campaigning WWF is Dr. Anton Rupert. The now deceased Dr. Rupert made his fortune from the cigarette manufacturing company called Voorbrand, re-named Rembrandt, now consolidated into Rothmans.
Ref: http://www.telegraph.co.uk/news/obituaries/1508360/Anton-Rupert.html
Simon,
We know pretty much exactly the amount of CO2 being produced annually. We also know how much human emissions add. And we know how much global warming has occurred (not much, lately).
So we know all the measurement parameters of CO2 and temperature. But funnily enough, despite thousands of scientists looking, all in hopes of snagging a Nobel Prize for their discovery, they have yet to measure any man-made global warming (MMGW).
They’ve been searching for more than fifty years for that measurement. They can’t quantify it. So yes, ‘dangerous MMGW’ is no more than an opinion. A conjecture. Really, it’s just an assertion. Science is all about data. Measurements are data. But there are no measurements quantifying MMGW. There are two possible rerasons:
First, maybe MMGW doesn’t exist at all. Or, MMGW is so minuscule that it cannot be measured. I think the second possibility is correct. MMGW is just too tiny to worry about.
And your strawman attempt to link it with smoking versus lung cancer falls flat on its face for one simple reason: there is plenty of evidence that smoking causes harm. We can quantify the number of smokers who get lung cancer, so there is no credible comparison.
So I challenge you to produce evidence of any global harm due to the rise in CO2. In fact, every alarming prediction made in that regard has been flat wrong. No one can demonstrate global harm due to the rise in that beneficial trace gas. It’s all assertions, all the time.
Where do you find those silly arguments, anyway? I suggest that you stop reading blogs that emit that kind of nonsense. Think for yourself, you will be much better off.
Jimbo
and your point is?
DB
“Where do you find those silly arguments, anyway? I suggest that you stop reading blogs that emit that kind of nonsense. Think for yourself, you will be much better off.”
Actually Db I did think of it myself. Give me a quantifiable measurable reason why you think I didn’t, otherwise I most certainly did…. which I did.
I already made it.
http://wattsupwiththat.com/2015/09/11/global-temperature-report-august-2015/#comment-2026380
Jimbo
Well if your rather long winded point is that some companies who are concerned with AGW also support tobacco products, then what on earth has that got to do with with my issue that DB?
…. issue with DB
Simon sez:
Actually Db I did think of it myself.
I really doubt that you thought up the tobacco argument on your own, Simon. I’ve read it for years. It’s an alarmist talking point, and it makes no more sense now than it ever did. The percentage of smokers versus non-smokers who get lung cancer has been repeatedly measured and quantified.
Your argument shows fuzzy thinking. It’s plainly ridiculous, as you can see from all the comments here. If that’s the best argument you can come up with, it’s no wonder no one agrees with you.
Simon, there are no empirical, testable, verifiable measurements quantifying the percentage of man-made global warming (MMGW) out of total global warming from all causes, including the planet’s natural recovery from the LIA, and the sun, and volcano activity, etc.
MMGW is just too tiny to measure. But cancer rates between smokers and non-smokers has been measured for decades, with wide agreement.
So, Simon, if that’s the best argument you’ve got, why not just admit that ‘dangerous MMGW’ is your new green religion? I can understand someone having blind faith, which ipso facto requires no evidence at all. It’s your religion, so there’s no need to clutter it up with silly illogical arguments. We understand your motivation: you Believe, and that’s enough for you.
Db
Or this one.
http://nca2014.globalchange.gov/highlights/report-findings/our-changing-climate#intro-section-2
Simon sez: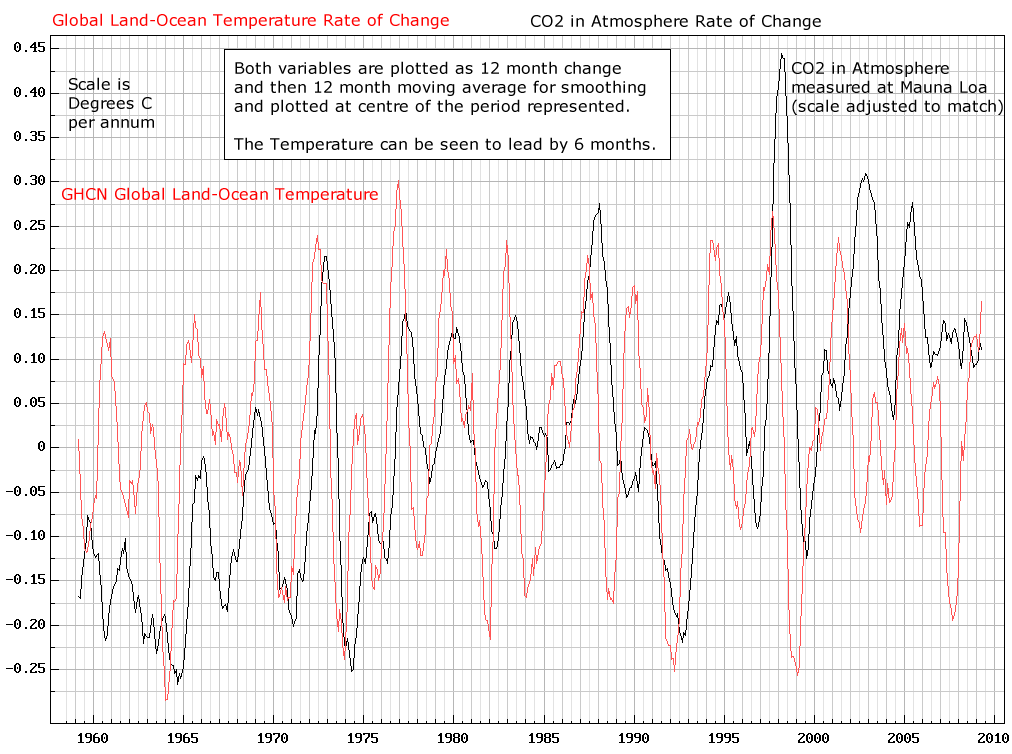
…CO2 and temp are very much linked to each other.
I agree. There is plenty of empirical evidence showing that ∆CO2 is caused by ∆T.
See, the alarmist crowd got it backward from the get-go: There are no measurements showing that changes in CO2 cause subsequent changes in temperature. But there is plenty of evidence showing that changes in global T are the cause of changes in CO2. See the difference?
When you start off with a wrong premise, then your conclusions will be wrong. And that is exactly what happened.
Next, your links are nothing more than overlays. None of them show cause and effect. Since you don’t seem to know the difference between the two, here is an example of a chart that shows cause and effect:
[click in chart to embiggen]
You can clearly see that changes in global temperature cause changes in CO2. But not vice-versa.
I have lots of charts like that, on all time scales from months to hundreds of millennia. They all show that ∆T causes ∆CO2.
But I don’t think you will be able to find a verifiable chart showing that a rise in CO2 is repeatedly followed by a rise in global T. I’ve searched extensively, and I’ve asked others to produce such a chart. No one ever has.
DB
Here is pretty compelling evidence. which part don’t you understand.
http://nca2014.globalchange.gov/report/our-changing-climate/observed-change#graphic-16678
It’s nonsense based on the processing of the data, it is not what was actually measured.
micro6500
Really? I think you are wrong. Please tell me how it is can make such a statement, or is it what you do when you see a graph that clearly demonstrates what you don’t want to believe, and that is, CO2 and temp are very much linked to each other.?
It’s what the measured data actually says, not that graph that is mostly made up.
Now as someone who’s probably never looked at the data, nor processed any data, nor run a simulatir, built dozens of models, nor been paid to do all of this for hundreds of the biggest companies in the world, maybe you just can’t recognize garbage when you see it, I got the data to look at it directly myself.
Also what I’ve found is that people who buy that swill either have no skills in any of the required areas, or are getting paid to produce that trash.
Simon,
The only thing “compelling” is your religious belief. Once more for the slow learners: an overlay chart does not show cause and effect. All it shows is two graphs overlaid on the same chart. That may be enough to satisfy your confirmation bias. But rational folks understand that it doesn’t show what you believe it shows.
DB
What is it telling you DB? And as you know it is only one of many lines of evidence. You asked for one. You got it. And will you lay off the religious thing. I’m not a religious man. Causes far too many problems on this planet… including climate change denial.
There’s one line of evidence that matters, surface measurements, day to day average changes in both min and max temps for all stations with 360 samples per year since 1940 show 0.0F +/-0.1F based on 72 million records from NCDC global summary of days data set.
Simon sez:
…it is only one of many lines of evidence. You asked for one. You got it.
Wrong again, Simon me boi. I have repeatedly asked you to produce verifiable, testable, empirical measurements. Just about anything can be claimed to be “evidence”, even an overlay chart. But measurements are data. That’s what we need. And that’s what is missing from the debate. You have no measurements.
Produce meausurements quantifying AGW, and you will be the first… and on the short list for a Nobel Prize. Hey, you’re as qualified as Obama. Now all you need are the measurements.
I’m not a religious man.
Oh, don’t be so shy. Sure you are:
Today, one of the most powerful religions in the Western World is environmentalism. Environmentalism seems to be the religion of choice for urban atheists. Why do I say it’s a religion? Well, just look at the beliefs. If you look carefully, you see that environmentalism is in fact a perfect 21st century remapping of traditional Judeo-Christian beliefs and myths.
There’s an initial Eden, a paradise, a state of grace and unity with nature, there’s a fall from grace into a state of pollution as a result of eating from the tree of knowledge, and as a result of our actions there is a judgment day coming for us all.
We are all energy sinners, doomed to die, unless we seek salvation, which is now called sustainability. Sustainability is salvation in the church of the environment. Just as organic food is its communion, that pesticide-free wafer that the right people with the right beliefs imbibe.
[source]
micro6500
“Now as someone who’s probably never looked at the data, nor processed any data, nor run a simulatir, built dozens of models, nor been paid to do all of this for hundreds of the biggest companies in the world, maybe you just can’t recognize garbage when you see it, I got the data to look at it directly myself.”
Haha. So you know everything. Well there you go.
I’m one of the best in my field, and have been for more than 30 years, so yeah, I know a thing or two.
micro6500
Well with all due respect, why don’t you actually say something that shows me the level of your understanding and not the size of your ego? Tell me why you don’t accept a graph from an internationally recognised organisation. Tell me why it is wrong. Not just that the data is manipulated or corrupt. That’s an easy way out. A bit like DB saying climate concern is a religion. They are just meaningless words.
Day to Day Temperature Difference

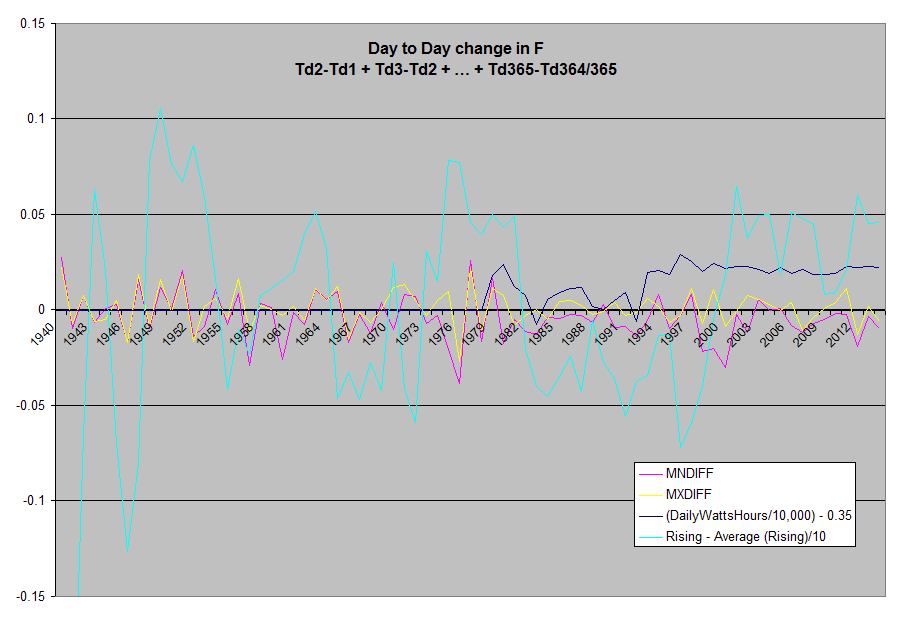


Surface data from NCDC’s Global Summary of Days data, this is ~72 million daily readings,
from all of the stations with >360 daily samples per year.
Data source:
ftp://ftp.ncdc.noaa.gov/pub/data/gsod/
Code:
http://sourceforge.net/projects/gsod-rpts/
This is a chart of the annual average of day to day surface station change in min temp.
(Tmin day-1)-(Tmin d-0)=Daily Min Temp Anomaly= MnDiff = Difference
For charts with MxDiff it is equal = (Tmax day-1)-(Tmax d-0)=Daily Max Temp Anomaly= MxDiff
MnDiff is also the same as
(Tmax day-1) – (Tmin day-1) = Rising
(Tmax day-1) – (Tmin day-0) = Falling
Rising-Falling = MnDiff
Average daily rising temps
(Tmax day-1) – (Tmin day-1) = Rising
Normalized Day to day difference with Daily Solar Forcing(WattHrs) and Rising temps
Yearly Average Min and Max Diff w/trend line Plus Surface Station count.
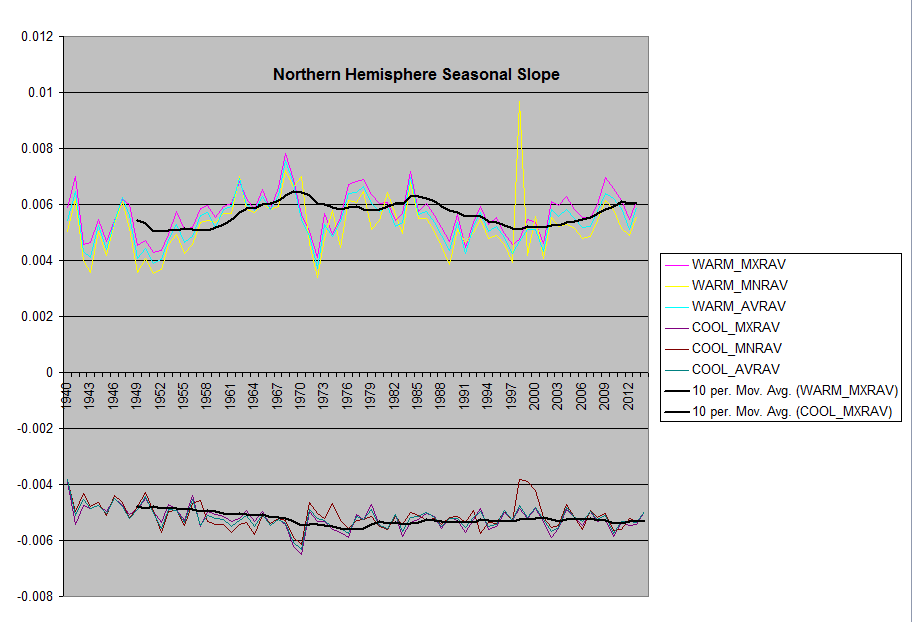
Day to Day Seasonal Slope Change
If you plot daily MnDiff daily for a year, it’s a sine wave.
You can take the slope of the months leading up to and past the zero crossing,
both for summer (cooling) and winter (warming)
and plot thoses.
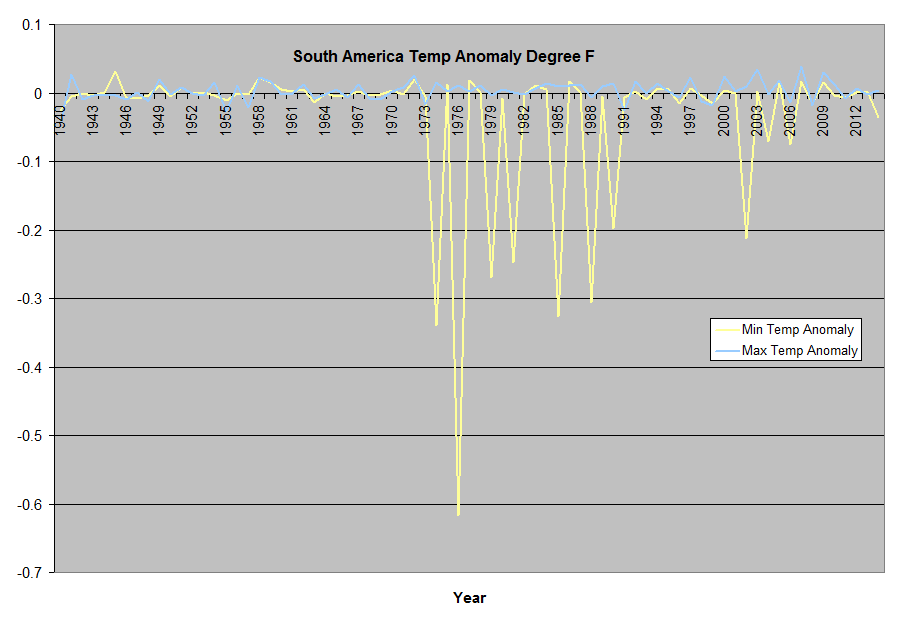
Global
Southern Hemisphere
is flat, other than some large disturbances in the 70’s and 80’s, and then again 2003.
Northern Hemisphere has a slight curve. A disturbance in 1973 when surface stations were changed,
And 1988
There are a number of regions with few stations, making some areas susceptible to large fluxuations,
or it could be a real disturbance in temps, they are timely to the transistions in the
Ocean cycles and the warm cycle and the start of the cooling cycle.
US Seasonal Slope
The US has the best surface station coverage in the world.
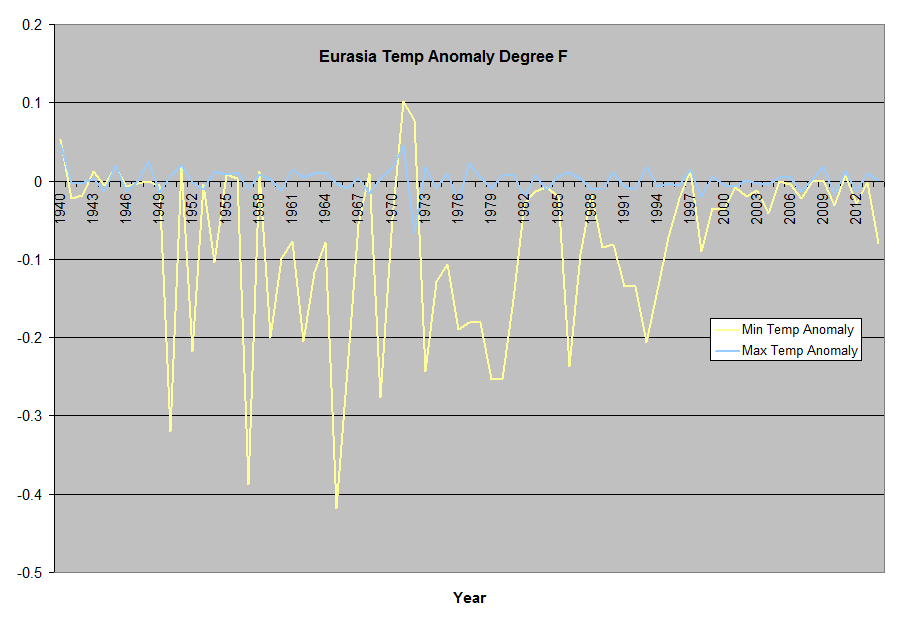
Eurasia Seasonal Slope
Northern Hemisphere w/trend line
Southern Hemisphere w/trend line
IR
Here is a sample of IR readings for a couple clear sky days.
You can see how cold the sky is in 8u-14u, and how the surface warms and cools.
The ground cools until Sunrise.And the Grass acts as if it’s insulation,
ie trapped air allows the top surface to warm and cool quickly.
Regional Graphs
Regional annual averaged daily differences.
(Tmin day-1)-(Tmin d-0)=Daily Min Temp Anomaly= MnDiff
(Tmax day-1)-(Tmax d-0)=Daily Max Temp Anomaly= MxDiff
Global Average
US +24.950 to +49.410 Lat: -67 to -124.8 Lon
Tropics -23.433 to +23.433 Lat
Southpole -66.562 to -90 Lat
Southern Hemisphere -23.433 to -66.562 Lat
South America -23.433 to -66.562 Lat: -30 to +180 Lon
Northpole +66.562 to +90 Lat
Northern Hemisphere +23.433 to +66.562 Lat
Eurasia +24.950 to +49.410 Lat: -08 to +180 Lon
Australia -23.433 to -66.562 Lat: -100 to -180 Lon
Africa -23.433 to -66.562 Lat: -100 to -30 Lon
Max Rel Humidity limiting surface humidity.
At night, days of high humidity, as it cools off, Rel humidity
reaches 100% at which point water condenses out, some of which ends up in the water table
and does not reevaporate the following day.
Source Code with the data that was turned into all of these graphs.
http://sourceforge.net/projects/gsod-rpts/
The raw data from NCDC is here
ftp://ftp.ncdc.noaa.gov/pub/data/gsod/
L. P. Buckingham says:
… instead of being a lazy old man, and asking other people to produce a measurement of MMGW, why don’t you get off of your lazy butt, do the science, and publish the results?
For the very simple reason that the ‘dangerous man-made global warming’ (MMGW) conjecture is what the alarmist crowd is trying to sell. It is their conjecture.
See, skeptics have nothing to prove. The onus is entirely on the side making the conjecture or hypothesis. Skeptics have no obligation to prove anything. All we need to do is falsify the conjecture, if at all possible. And in the case of MMGW, it has been falsified so many times that there’s nothing left standing. It is now a subject of ridicule.
The alarmist crowd is incapable of producing a measurement of MMGW — but you demand that skeptics must produce it?? It always makes me laugh when someone demands that skeptics must, in effect, prove a negative. The claim is that rising CO2 will cause dangerous global warming — but those making the claim have never produced a single measurement to support their conjecture! They failed.
You have a lot to learn about the Scientific Method, the climate Null Hypothesis, and Occam’s Razor for that matter.
*****
And Simon, what’s your CV? From your comments, it appears you’re a new proselyte for MMGW. You’re far from being up to speed on the subject.
DB
“proselyte ” you really have a thing for religion. So tell me DB are you a religious man? Maybe you are one of these “God would never let anything bad happen to his flock” people? You know the religious nutter crew. If not why do you keep bringing it up?
And I am not as versed as you in the dubious data that’s for sure. I tend to stick to mainstream stuff.
” And I am not as versed as you in the dubious data that’s for sure. I tend to stick to mainstream stuff.”
Well that’s your problem, the mainstream stuff is the dubious stuff. 🙂
So, Buckingham, produce a verifiable, empirical measurement quantifying the percentage of man-made global warming….
…or admit that you can’t. Because you are the one making the preposterous demand that skeptics must support your conjecture.
This whole debate is about the total lack of AGW measurements. That’s a major fail in science.
*****
And Simon sez:
…you really have a thing for religion.
No, Simon. That’s your thing. ‘Dangerous AGW’ is your catechism.
(And I note that you have no answer to my post @ur momisugly 6:27 above. Silence is concurrence. And still no CV??)
Simon,
I’m not religious like you think. Certainly nothing like you are. Re-read Dr. Crichton’s epistle that I linked to. You will see yourself there. If not, lots of others see you like that.
You originally wrote in this conversation:
So you base (in large part) your lack of acceptance on the fact that no one can give you an exact fraction of the human contribution?
No. I base my skepticism on the fact that no one can produce ANY verifiable fraction of AGW, out of total global warming.
If you can’t quantify the “A” portion of AGW, then it’s just too tiny to measure. Otherwise, it would have been measured – many years ago. We wouldn’t even be having this discussion, and the question of the climate sensitivity number would have been resolved long ago. But they’re still arguing about it. Why? Because there are no measurements of MMGW!
*****
@Lewis Buckingham:
Louis hissed, “If you want a measurement of MMGW, go out, collect the data, then publish your results. That is how science is done. It is not done by making ‘demands’ on a blog.”
I see lots of commenters whose signature ‘contribution’ to the discussion is to inject a nasal snarkiness. I imagine utterances such as these as being spoken in the voice of Peter Lorre speaking to Bogart in Casablanca:
“You despise me, don’t you Rick?”
“If I thought about you, Ugati, I probably would.”
How’s that for snarkiness? ☺
So, Lewis, I guess you can’t produce produce any verifiable, empirical measurements quantifying the percentage of man-made global warming. Got it. But don’t feel bad, no one else has, either. (And excuse me for using the term “demand”. I didn’t mean to ruffle your feathers.)
As I pointed out above:
The onus is entirely on YOU to falsify the AGW hypothesis.
(By ‘you’ I meant anyone on your side who believes in dangerous AGW. That is the central scare. It has morphed into a major hoax; a scam. Now, it’s a huge racket, with more than a $Billion propping it up – every year!)
The onus is not on skeptics, Lewis, because: Ei incumbit probatio, qui dicit, non qui negat; cum per rerum naturam factum negantis probatio nulla sit. – The proof lies upon him who affirms, not upon him who denies; since, by the nature of things, he who denies a fact cannot produce any proof.
As to the hypothesis that CO2 is causing “unprecedented” global warming: the onus lies on those who say so. As to the belief that there has been a recent, alarming rise in global temperatures: the onus lies on those who say so.
The onus is on the alarmist crowd, Lewis. Not on skeptics. The alarmists are the real deniers. But they can’t find a single measurement quantifying something they believe surely must be happening. That failure alone falsifies their conjecture — or at least, it would in any other of the hard sciences. But ‘climate science’ is special. It has its own rules; they’re based on beliefs, not on measurements.
Lewis,
I’m not confused, you just didn’t understand. You say:
1( You continually ask for a measurement of MMGW, yet at the same time you post, “Because there are no measurements of MMGW”.
Actually, my statement makes complete sense, you just have a hard time understanding it. Personally, I would really like to know how much global warming can be attributed to human CO2 emissions, if any. I want the truth, not the assertions of the climate alarmist crowd. I can handle any data, no matter where it leads — and so far, the data shows that dangerous MMGW is complete nonsense, no matter what you might believe. I’ve been asking for measurements of AGW for years. But no one has ever produced any. Thus, your ‘dangerous MMGW’ conjecture is just a baseless opinion, nothing more.
If we had a definitive measurement of AGW, it would clarify the entire debate: we would have the answer to the climate sensitivity number, which in turn would give us the necessary tool to predict how much global T would rise per unit of CO2 emitted.
I don’t claim AGW doesn’t exist and I never have. My position all along has been that it is too minuscule to measure with current instruments.
Next:
2) You are also wrong about where the “onus” lies… You can falsify a hypothesis, but you can’t “prove” one.
You are right, I shouldn’t use the word “prove”. But I’m happy to point out that the catastrophic AGW conjecture (not ‘hypothesis’) has been repeatedly falsified. Let me give you just one example:
A Conjecture, Hypothesis, Theory and Law all have one thing in common: to be valid they must all be capable of making repeated, accurate predictions. But as we know, the climate alarmists’ scary predictions have been wrong. All of them; no exceptions. Therefore, their conjecture is wrong. It has been falsified by their failure to make acccurate predictions.
And that takes care of your incorrect #3. You may believe that catastrophic AGW has not been falsified. But that’s just your eco-religion clouding your thinking. As Prof. Richard Feynman said, you are the easiest person to fool.
Lewis Buckingham says:
Of course, I’m sure you will not be able to provide a link to a peer reviewed scientific paper that says so. If you have one, please post it
I’ll do better than that. Here is satellite data:
http://www.woodfortrees.org/plot/rss/from:1997/plot/rss/from:1997./trend
I’m sure you will agree that data trumps a paper, whether it’s peer reviewed or not.
And here is the temperature data with a CO2 overlay:
http://www.woodfortrees.org/plot/rss/from:1997/plot/rss/from:1997/trend/plot/esrl-co2/from:1997/normalise/offset:0.68/plot/esrl-co2/from:1997/normalise/offset:0.68/trend
And just to show you where we are now, here’s a chart of the past 4.6 billion years:
http://www.newscientist.com/data/images/archive/2839/28392301.jpg
You will notice that we are at the cold end of the range. How about that, Lewis? We could sure use a few degrees more warming. Unfortunately, the opposite is more likely.
Finally, you say:
All I have to do is find one prediction that came true and it falsifies your statement.
You’re confused, Lewis.
Lewis,
Why, certainly I can give you the chart’s provenance. But I’ll let you find it. [Hint: look in the upper right corner.] Note that it’s from a well known climate alarmist source.
Next, you say that Satellite data is not “peer reviewed”
Correct, it’s not. It’s much better than any peer reviewed paper. Data is what writers use for their papers. It’s the original source. Besides, that lame ‘peer review’ appeal to authority logical fallacy is what alarmists use when the data contradicts their belief system.
Next:
Satellite data doesn’t measure surface temperatures, and in fact are not a measure of global temperatures.
Surface stations don’t measure surface temperatures, either. And as a matter of fact, satellites do measure global T, unlike many others that ignore oceans.
Question: who is feeding you all that misinformation?
Next:
Your woodfortrees chart is another cherry pick…
But it is much more accurate than your own cherry-picks. GISS is preposterously wrong, and hadCRUT4 replaced version 3, which was closer to RSS. You can believe that pseudo-science if you like, I’ve seen other wacky beliefs here so you’re not alone.
And:
YOUR CHART FOR THE PAST 4.6 BILLION YEARS IS FUNNY
Complain to New Scientist, it’s their chart. Oh, dang, I just gave away the provenance.
Next:
The earth is less than 4.5 billion years old .
No, it’s more: it’s about 4.55 billion years old.
Next:
Did you mistake “million” for “billion?”
Nope. It appears you dislike geologists for some reason. Maybe because geology is one of the hard sciences? Geologists study those things. You could, too, if you wanted.
Next:
Your graph of ice core temperature data doesn’t have the proper resolution to compare it with present day temperatures.
You’re confused again. My chart was intended to show that warmth is rare; the usual situation is a much colder world.
Next:
Too bad you didn’t address the two examples of predictions that have come true. You posted ” But as we know, the climate alarmists’ scary predictions have been wrong. All of them; no exceptions. ” I have provided two examples. They falsify your assertion. But then, all you are doing is making “assertions” without evidence.
Every alarming prediction has been wrong. No exceptions.
Regarding your “two examples”, they’re just more misinformation you’ve been fed. Here is Hansen’s totally wrong prediction:
http://rankexploits.com/musings/wp-content/plugins/BanNasties/imageDiversion.php?uri=/musings/wp-content/uploads/2008/06/hansencomparedrecent.jpg
Even Hansen’s own GISS couldn’t fudge the numbers enough to make Hansen correct. And your other ‘example’ starts in 1900. I guess there was no polar ice before that, eh? Of course, the alarmist cult always shows only Arctic ice. The Antarctic contains ten times the ice volume of the Arctic. Maybe this is the reason the cult ignores the Antarctic:
http://www.climate4you.com/images/SeaIceNHandSHlastMonthSince1979.gif
So those “two examples” have been decisively falsified by the real world.
You respond to contrary facts just like any other cult member:
Can you falsify AGW? Got real evidence ?
Ever hear of Dr. Leon Festinger? He became famous in the 1950’s by studying a flying saucer cult called the ‘Seekers’ (flying saucers were a big thing in the ’50’s). The Seekers believed their cult leader, a ‘Mrs. Keech’, who told them that a flying saucer would arrive on a precise time and day, and rescue them while the earth and everyone in it was being destroyed. Only the Seekers would be saved.
But on the appointed day and time, no flying saucer appeared. So did the Seekers realize they were wrong?
No!
Dr, Festinger reported that they became even more convinced that they were right, and they immediately accepted Mrs. Keech’s assurance that she had miscalculated the day and time. Nothing and no one could convince the Seekers that their belief in a flying saucer was ridiculous. They became even more fervent in their belief that Mrs. Keech was right.
I’m sure you see where this is going. Many others more educated than I am have repeatedly falsified the ‘dangerous AGW’ hoax, using real facts, evidence, data and measurements. But nothing can possibly convince you of that, because you Believe. That kind of belief is typical of all cult members, including the cult of climate alarmism.
No matter how much data I post, you will still make comments such as:
Can you falsify AGW? Got real evidence? Your Belief is ironclad, and no reasoning, facts, or measurements (or the lack of any measurements) can convince you otherwise.
So, why do I reply to your questions? I do it for two reasons:
First, because I enjoy it. It amuses me. And second, because this is a heavily trafficked site with new readers every day. I enjoy giving them counter arguments. Then they can make up their own minds, without reading only the opinions of ‘dangerous global warming’ cultists. And I have to say, I don’t think you are at all convincing. Maybe that’s because you’re fairly new to the subject. Stick around here; others have had the scales fall from their eyes, and realized there was no flying saucer coming to save them. So it’s always possible that you might see the light some day.
” The Y-axis of the satelite data does not show the voltage reading”
And surface stations show the voltage on the pt thermistors? And GISS, Best, and Had cru temps aren’t but about 25% surface station data, the rest is made up.
Lewis,
I knew you’d throw in the towel. Too bad, because I have lots more facts to post. But I’m sure we’ll meet again.
And it’s sure fun making you spin up like that. Four comments in a row! Careful there Lewie, your head might explode. So, to deconstruct your nonsense:
Dbstealey says, ” satellites do measure global T, :
…
No, they measure the lower troposphere temperatures.
,,,
The more you post, the more you show how clueless you are.
Lewie, you’re conflating two different things there. Satellites measure global T, and it doesn’t matter if it’s the troposphere or the ground. It’s global, see? Or maybe you don’t understand.
Next:
Dbstealey says, ” GISS is preposterously wrong:
…
You make another assertion.
…
You have evidence for it?
Of course I have evidence.
You can start your climbdown now… unless you want more evidence. Just ask, and I’ll post it.
Next:
Dbstealey uses “New Scientist” as a source.
Deliberately. Because it’s a climate alarmist publication — your own side published it, so you’re just laughing at yourself. But if you want a different source, I can provide that, too. Got even more, if you want ’em. Just ask. Or, continue your climbdown.
Insults? Again? They prove nothing but your inability to provide anything but government-funded papers by government-funded bureaucrats for government-funded bureaucrats.
Lewis,
You gave up because all you have left are your usual ad hominem insults, while I have facts, evidence and logic to present. You say:
AGW predictions have come to pass.
You’re confused again. As I’ve said repeatedly since this site began, I accept that AGW exists. I have never said otherwise. But AGW is so tiny that no one has ever been able to quantify it with an empirical, testable measurement. So in other words, your entire argument amounts to a baseless assertion.
Now, if what you claim is that alarming man-made global warming (MMGW) predictions have come to pass, as I’ve explained to you several times now: no, they haven’t. Not one scary prediction has ever happened. No exceptions.
I destroyed your two lame attempts to find an alarming prediction that happened, but as we see, neither one of them could be classified as alarming. One was Hansen’s failed prediction, and the other one showed a natural fluctuation in Arctic ice. I understand that you don’t want to discuss Antarctic ice, because that would blow your ‘ice’ scaremongering attempts out of the water completely.
Finally, as a ‘dangerous MMGW’ cultist, I thought you’d be interested in this passage. Try to guess who wrote it:
A man with a conviction is a hard man to change. Tell him you disagree and he turns away. Show him facts or figures and he questions your sources. Appeal to logic and he fails to see your point. We have all experienced the futility of trying to change a strong conviction, especially if the convinced person has some investment in his belief. We are familiar with the variety of ingenious defenses with which people protect their convictions, managing to keep them unscathed through the most devastating attacks. But man’s resourcefulness goes beyond simply protecting a belief. Suppose an individual believes something with his whole heart; suppose further that he has a commitment to this belief, that he has taken irrevocable actions because of it; finally, suppose that he is presented with evidence, unequivocal and undeniable evidence, that his belief is wrong: what will happen? The individual will frequently emerge, not only unshaken, but even more convinced of the truth of his beliefs than ever before. Indeed, he may even show a new fervor about convincing and converting other people to his view.
That’s you, Lewis. It describes you. Nothing can change your Belief.
Louie sez:
So you are wrong.
No, Lewis, and as usual your reading comprehension is as lacking as your AGW measurements.
The Arctic was ice-free some 6,000 years ago, before any AGW. You are attempting to re-frame the argument to your advantage, but that only works with some folks.
Arctic ice fluctuates. But of course, if you agree with that fact, there goes your assertion. I wasn’t wrong. See, your chart showed nothing alarming. What I’ve been saying all along is that no alarming predictions have happened. And they haven’t.
Not a single alarming prediction has happened. Not one; no exceptions.
” Well, they predicted that the Arctic sea ice extent would shrink, and it has.”
Just like it did 75-80 years ago,
Louie,
I’ll refute everything you mistakenly believe tomorrow. Other things take precedence right now.
But before I go, just to let you know you’re wrong to put your trust in government data manipulation, here’s what is fed to the gullible public:
http://tinypic.com/view.php?pic=vnmhoo&s=5#.VfeT5kLKlJ0
http://tinypic.com/view.php?pic=2co31gi&s=3#.VfeUpkLKlJ0
And as we see, global sea ice is right at its long term average:
http://www.climate4you.com/images/NSIDC%20GlobalArcticAntarctic%20SeaIceArea.gif
That is not ‘alarming’. QED
13 years? Try the DMI historical charts from 1900-1954
Lewie,
You couldn’t figure out that the passage I posted was written by Prof. Leon Festinger? I guess I’ve been giving you too much credit.
And that quote describes you exactly. That’s why I posted it. So just wait, Lewis, the flying saucer will be here real soon to give you a ride.
That quote you posted certainly does apply to you.
Ha, ha!! As expected, another reading comprehension FAIL. What’s that, number 3 or 4 now?
Lewis Buckingham,
I’ve gotta say, when you get your misinformation from blogs like “digitaljournal” and “The Conversation”, you’re getting led by the nose in the wrong direction. Those are not science sites like this is; they are fed talking points by vested interests in the climate scare.
For example, one of your links itemizes ten failed predictions:
Ten predictions about Global Warming that have come true
“Global Warming trends have been forecasted for 100s of years, but very few believe it will ever happen, but some of the forecasts or predictions are already coming true. Warmer climates, earth’s ice melting rapidly, more hurricanes and other predictions.
“10 predictions by others that have come true so far regarding Global Warming:”
1. As more carbon dioxide is released into air, the Earth will become warmer. We have seen warmer climates for a longer period than before. This was predicted by Svante Arrhenius in 1893.
That is a failed prediction: global warming stopped almost 20 years ago.
2. We will see noticeable changes in Earth’s climate by around 2000, predicted by IPCC scientists.
^That^ sentence is meaningless. Even Lewis B. should agree about that. In fact, there is nothing either unusual or unprecedented happening. Everything observed now has happened in the past, repeatedly, and to a much greater degree.
3. Sea Level would start to rise, predicted by a UN Panel.
“Start to rise”?? The sea level has been rising since the last great stadial. Now it’s about 6 inches a year, or a little less. The alarmist prediction has always been that sea level rise will accelerate; another failed prediction.
4. Earth’s Ice would start to melt rapidly, we already heard before how chunks of ice are floating in the sea from Arctic and Antarctic and melting. It was predicted by James Hansen.
Chunks of ice are floating in the sea?? EVERYBODY PANIC!! …not.
Sea ice is at its 30-year average, and there is no indication that the trend has changed. So that’s another failed prediction.
5. Alfred Russel Wallace in 1900 predicted that hurricanes would increase in intensity.
Well then, Alfred Russel Wallace was flat wrong. Another failed prediction.
6. Species would start to become extinct because of drastic climate change patterns.
Hasn’t happened; thus, another failed prediction.
7. The land of Australia will become drier. Australia is already seeing a decline in some animal species and faces the threat of extinction also.
Australia is pretty dry already, and the long term trend hasn’t changed. The second sentence is meaningless in the context of human CO2 emissions. It’s just another of the alarmist crowd’s favorite tactics: Say Anything, then add ‘global warming’ or ‘threat’ or ‘climate change’. And it looks like the author is saying that ‘the land of Australia’ also ‘faces extinction’. It’s worse than we thought! Except, that’s just another wrong prediction.
8. Tropical diseases will increase multifold because of change in weather. The London School of Hygiene and Tropical Medicine estimates that of ten of the world’s most dangerous vector-borne diseases, nine will increase their coverage because of climate change.
Then the London School of Hygiene and Tropical Medicine estimates was flat wrong. Another failed prediction assigned to “climate change”. Apparently they don’t understand that the climate always changes. They should read WUWT. Then they would understand that ‘weather’ is not the same as ‘climate’.
9. Food crops would be adversely affected; we can see that in many areas.
The planet is measurably GREENING as a direct result of the added CO2 emissions. So, wrong again. In fact, just the opposite has been happening, making that one a really wrong prediction.
10. More carbon dioxide is released into the atmosphere and the ocean; in the latter it will acidify the ocean. When Carbon dioxide mixes with water it forms carbonic acid which becomes deadly to marine creature and coral reefs. Because of this British shellfish soon will become extinct along with other species.
Ocean “acidification” is another conjecture. More CO2 will not measurably “acidify” the oceans. The oceans’ buffering capacity is immense, and there’s not enough CO2 to make a difference. Further, CO2 has been up to twenty times (20X) higher in the past, without causing the problems predicted above. And this prediction: “Because of this British shellfish soon will become extinct” is nonsense. That article was written in 2007. I haven’t heard that British shellfish are becoming extinct. Have you? So there’s another wrong prediction. Also, evidence is lacking for ocean “acidification”, no matter what misinformation you’ve been spoon fed by those scientifically ignorant blogs. Use the WUWT search box and put in: ‘acidification’. You will learn a lot, and since WUWT encourages all scientific points of view, you can decide which view is closest to reality.
Those predictions were wrong, Lewis. Therefore, the catastrophic AGW conjecture is falsified — no matter what the digitaljournal writer asserts.
Finally, you say:
Science does not attribute the adjective “catastrophic” nor does it attribute the adjective “dangerous” to AGW. Science is value neutral.
On that we agree. The problem is rent-seeking scientists like Michael Mann, Tim Flannery, and many others, who constantly sound the ‘dangerous man-made global warming’ alarm. They do it for money, for prestige, and for advancement. They admit it in the Climategate email dump, and they’re still at it. So please, direct your criticism where it belongs: at those corrupt scientists who are using the ‘dangerous AGW’ scare for their own self-serving interests. They are the problem, not scientific skeptics of the MMGW scare.
These warm tropospheres temperatures indicates higher than normal cooling rates.
This is a chart of the annual average of day to day surface station change in min temp.
(Tmin day-1)-(Tmin d-0)=Daily Min Temp Anomaly= MnDiff = Difference
For charts with MxDiff it is equal = (Tmax day-1)-(Tmax d-0)=Daily Max Temp Anomaly= MxDiff
MnDiff is also the same as
(Tmax day-1) – (Tmin day-1) = Rising
(Tmax day-1) – (Tmin day-0) = Falling
Rising-Falling = MnDiff
It’s showing excessive cooling (more night time cooling than the previous day warmed. This goes up to 2014, and you can see how it generally matches Satellite measurements.
Oh, the value at 9999 is the full average of all years, which shows a slight cooling.
El Niño is convenient for the Paris jawfest but the warmth will be followed by La Niña giving a cold shoulder to all that hot air in Europe.
The next 17 years are liable to look like those following the super Niño of ’98, only more so.
The baseline for this temperature report begins in 1978. This is wrong All. twenty first century temperatures should be referred to a baseline that starts in 2002 and no sooner This is because 2002 was the year wen the step warming of 1999 stopped. That step warming was the only real warming in the satellite era that began in late 1978 as your article mentions. Official temperature curves, however, also show a fake warming called “late twentieth century warming” that does not exist. What does exist is a complete stoppage of warming we call a ‘pause’ or a ‘hiatus.’ It turns out that this hiatus covers the eighties and the nineties from 1979 to 1997, an 18 year stretch. During this period carbon dioxide kept increasing but there was no parallel warming that the greenhouse theory of IPCC demands. Just like the hiatus we are living through now. The real warming started in 1999, just after the Super El Nino of 1998 was finished. It raised global temperature In three years by one third of a degree Celsius and then just quit. There has been no warming since then although there were a La Nina (2008) and an El Nino (2010). They canceled one another and global mean did not change. A third of a degree is not small if you consider that total warming for the entire twentieth century was only 0.8 degrees according to Hansen. Its ecological consequences, if any, all belong in the twenty-first century. Before the La Nina appeared ENSO oscillations in the 21st century were small and irregular and were best described as part of of a twenty-first century high. When that La Nina and El Nino finally appeared it looked like regular ENSO oscillations had started again but that was not to be the case. After the El Nino was over ENSO reverted back to the same irregular behavior it had displayed before the La Nina of 2008. What we observe as an El Nino is actually the atmospheric expression of an El Nino wave in the Pacific that crosses the ocean from west to east along the equatorial counter-current. Nino3.4 sits smack in the middle of that equatorial countercurrent in the Pacific Ocean and records the passing of the El Nino wave in mid-ocean by measuring water temperature. The time it takes for the El Nino wave to get from mid-ocean to South America and then spread out along the coast explains the delay between Nino3.4 and atmospheric expression of an El Nino. As the warm water spreads along the coast it warms the air above it, warm air rises, joins the westerlies, and the world will finally notice that an El Nino has arrived. But any wave that runs ashore must also retreat. As the El Nino wave retreats water level behind it drops by as much as half a meter or more. Cold water from below wells up and a La Nina has started. As much as the ElNino warmed the air the La Nina will now cool it and global mean temperature does not change. That is normal. But should something block the equatorial countercurrent when an El Nino wave is on the way it will be stopped in its tracks. Instead ot proceeding on to South America the warm water carried by the El Nino wave spreads out in the middle of the ocean and creates an El Nino on the spot. That is called an El Nino Modoki or CP (Central Pacific) El Nino. The La Nina that normally follows an Elm Nuno will then not follow its regular path and as a result we just don’t know what temperature changes take place after an El Nino Modoki is over. The other irregular behavior of El Nino is the lack of distinct atmospheric El Nino signals before 2009 and after 2010. The complaint is that they apparently do not follow the Nino3.signals of what to expect./ Among these signals is the expectation of a big El Nino this fall and winter. I can only speculate but the coastal winds are my first suspect. Near the equator we have easterly trade winds. Further nmorth we get westerlies. The atmospheric detection of an El Nino requires that warm air from warn water near the coast should rise, join the westerlies, an d get carried around the world by them. That is how European and Japanese weather services recognize that they are observing the same El Ninos. But suppose that the dividing line between the trades and the westerlies should move north along the coast. What would happen then is that less of the raising warm air mass will join the westerlies, reducing the observed atmospheric temperature rise. Could this explain the irregular ENSO oscillations that have been observed? I don’t know for sure. But if you shift the entire westerly air flow north you will get a westerly flow lined up between the Indo-Pacific Warm Pool and the Gulf of Alaska. That gulf is dead ended for any such westerlies and will catch and hold any warm water the winds will bring it. How else could you explain a strange warm blob sitting there for years now? Could all these things be connected? Again, I don’t know, but it is worth thinking about.
Oh boy. The warmistas will be cacckling with glee over this one.
Six inch headlines in the NYT, anyone?
One month, and only in the tropics, and only because of the rapid escape of stored heat from tropical Pacific Waters.
But it will be taken as a final confirmation of all the is bad with mankind and fossil fuels.
*sigh*
What does “highest temperature recorded” mean in a slowly increasing temperature trend and current a temperature plateau?
Let me tell you a story to illustrate.
I was hiking Table Mountain near Mt. Baker this summer with my son. After hiking up some steep cutbacks we saw something that looked like the top of Table Mountain. But then we hiked a little further, and saw a possibly slightly higher elevation. We repeated this process 3-4 times. So we found new “highest elevation” several times as we stood on what is a plateau – and hence the name “Table Mountain”. There was nothing physically significantly different about these different spots, other than the view, they were all within 20-40 feet of similar elevation. However my 10 year old kept asking “where’s the top?”. Well, there is no top, there’s lots of little well, table tops.
So what does “highest temperature recorded” mean? Well, nothing, really at all, other than a point of emotional interest. It has no physical significance.
Peter
PS: I highly recommend this hike. Beautiful.
http://www.wta.org/go-hiking/hikes/table-mountain
That doesn’t make me feel any better about conflicts of interest. In fact it makes me feel worse.
Why do people believe that governments are free from conflicts of interest? I argue they are worse than corporations, or at least as bad (in different ways mind you).
Peter
There is a certain class of people who are desperate to believe that those who work for govt do so out of altruistic desire to serve mankind and that have no agenda other than to help everyone.
It’s not real, but some people need a father figure in their lives, and they have picked govt to be it.
So I think what you are saying is they are frightened little children…
Well, it wasn’t like we didn’t know this was going to be a warm year. And it wasn’t like we didn’t know the press wasn’t going to prostitute it for all it was worth. In fact, they were expecting this LAST year, which is why they’re re-running all the same headlines.
What they HAVEN’T done is connect it in any way to human activity of any kind, OR the impending end of the world.
True, but the seven months from December 1997 to June 1998 all beat the 0.516 in the tropics. And four of those months were even above 1.0.
I’m not sure what the big fuss is all about. We all know about the current El Nino. Couple that with the very warm SSTs off of the coast of the Pacific and it is no wonder that the tropical and subtropical Pacific are at record levels for August. I’d been surprised if they weren’t Look at the 97-98 El Nino and the over-all pattern of the Pacific and Indian Ocean SSTs were much different than today. The Indian Ocean as well as the area off our West Coast were cooler back in 97.
What is surprising is that over-all, this August was the 5th Coolest for the LT since 1979. Of course this will probably change as warm air begins moving poleward from Tropics the next several months. One other difference from the 97-98 El Nino I noticed was that in 1997 the atmosphere began reacting to the El Nino almost immediately. The spike in global temps then was much quicker than the current El Nino.
Maybe I’m not well enough informed on these things but being the 32nd hottest month on record when the record starts in 1978 doesn’t strike me as necessarily being very significant. Maybe it is…maybe it isn’t. Maybe if we had 1000 years of satellite data to compare it to then we might be able to draw some conclusions.
Perhaps you will be more impressed with Hadsst3. Not only did it have the warmest August ever, it had the warmest anomaly for any month since 1850 with an anomaly of 0.664.
One 100F day this year and two last year at my location. 10-14 is “normal”. Late killing frost now three years running. No acorns for two years and a paltry hickory nut crop. My lawn did not receive its annual brownout this year. Low 50s forecast next week. But that’s weather for you. If my peach bloom dies again next April it’s a trending climate. Although still can’t seem to rid myself of the 200% humidity.
I have shown the length of the Pause for various regions based on UAH v6.0 at kenskingdom.wordpress.com.
Global pause is at 18 yrs 5 months, Tropic Oceans at 22 yrs 11 months, and Antarctica has had zero warming for the whole satellite record.
Great summary there Ken:
https://kenskingdom.wordpress.com/
Let me pose this question about Co2 warming, if you add the warming of each day over a year, and subtract the sum of every nights cooling for the same year, and it is 0.0F +/-0.1F was there any warming?
Now assume that during that same year that had no warming as described above, July’s average max temp was warmer than the average max temp of the previous years July?
Would you, if Co2 was warming the planet not expect both examples would show an increase?
Finally, if I tell you that in the first example, since 1940 the average is still 0.0F +/-0.1F?
That is an excellent summary! Please do not take this comment as a criticism since it is not intended that way. There is no problem with using a yardstick of “zero or negative trend (less than +0.01C/ 100 years)“. However when Lord Monckton gives his numbers for RSS, he follows a very simple rule: It must be negative. So he would give the time of the pause for UAH as 18 years and 4 months instead of 5 months. I see you gave 10 slopes and 9 were indeed negative but the one was positive although the value was extremely small as you said.
I am fully aware of the fact that we have no set rules as to how small a positive slope can be to be counted as zero, but there would be less confusion if we all adopted Lord Monckton’s rules. ☺
Regards
I notice that the graph and the map are Copyright (c) 2015 University of Alabama in Huntsville. Does WUWT have permission, or does fair use allow this?