Looking back at a recently published paper on ancient sea level and CO2, and noting that the most recent paper by Dr. James Hansen seems to be getting the cold shoulder, I thought it would be a good idea to have a look at both.
First, Hansen’s paper, which isn’t peer-reviewed yet, but is generating some media attention, and some of it isn’t so good. It is titled:
Ice melt, sea level rise and superstorms: evidence from paleoclimate data, climate modeling, and modern observations that 2 ◦C global warming is highly dangerous
Hansen, J., Sato, M., Hearty, P., Ruedy, R., Kelley, M., Masson-Delmotte, V., Russell, G., Tselioudis, G., Cao, J., Rignot, E., Velicogna, I., Kandiano, E., von Schuckmann, K., Kharecha, P., Legrande, A. N., Bauer, M., and Lo, K.-W.: Ice melt, sea level rise and superstorms: evidence from paleoclimate data, climate modeling, and modern observations that 2 °C global warming is highly dangerous, Atmos. Chem. Phys. Discuss., 15, 20059-20179, doi:10.5194/acpd-15-20059-2015, 2015.
Abstract. There is evidence of ice melt, sea level rise to +5–9 m, and extreme storms in the prior interglacial period that was less than 1 °C warmer than today. Human-made climate forcing is stronger and more rapid than paleo forcings, but much can be learned by combining insights from paleoclimate, climate modeling, and on-going observations. We argue that ice sheets in contact with the ocean are vulnerable to non-linear disintegration in response to ocean warming, and we posit that ice sheet mass loss can be approximated by a doubling time up to sea level rise of at least several meters. Doubling times of 10, 20 or 40 years yield sea level rise of several meters in 50, 100 or 200 years. Paleoclimate data reveal that subsurface ocean warming causes ice shelf melt and ice sheet discharge. Our climate model exposes amplifying feedbacks in the Southern Ocean that slow Antarctic bottom water formation and increase ocean temperature near ice shelf grounding lines, while cooling the surface ocean and increasing sea ice cover and water column stability. Ocean surface cooling, in the North Atlantic as well as the Southern Ocean, increases tropospheric horizontal temperature gradients, eddy kinetic energy and baroclinicity, which drive more powerful storms. We focus attention on the Southern Ocean’s role in affecting atmospheric CO2 amount, which in turn is a tight control knob on global climate. The millennial (500–2000 year) time scale of deep ocean ventilation affects the time scale for natural CO2 change, thus the time scale for paleo global climate, ice sheet and sea level changes. This millennial carbon cycle time scale should not be misinterpreted as the ice sheet time scale for response to a rapid human-made climate forcing. Recent ice sheet melt rates have a doubling time near the lower end of the 10–40 year range. We conclude that 2 °C global warming above the preindustrial level, which would spur more ice shelf melt, is highly dangerous. Earth’s energy imbalance, which must be eliminated to stabilize climate, provides a crucial metric.
Hansen’s paper is now open for public comment.
Meanwhile, Climate Depot reports: Former NASA lead global warming scientist James Hansen’s new sea level rise scare study gets ‘cold shoulder’ from climate establishment.
- Warmist AP climate reporter Seth Borenstein said he ‘would not cover’ Hansen’s paper.
- UN IPCC Lead Author Kevin Trenberth calls Hansen’s study ‘rife with speculation and ‘what if’ scenarios’ and based on ‘flimsy evidence.’
- NYT’s Andrew Revkin: “Associated Press, The New York Times, the BBC and The Guardian..among those who steered clear of [Hansen] study”
- Even Michael Mann admits Hansen’s sea level rise estimates are ‘prone to a very large ‘extrapolation error’
Marc Morano comments:
“James Hansen’s new paper ratcheting up future sea level rise numbers is consistent with the new strategy of the global warming activists. Given that current sea level rise rates are not alarming, the only way climate activists can claim anything is ‘worse than we thought’ is to make more dire predictions of the future.
Simply making scarier predictions of the future in order to alarm policymakers is not ‘good science.’ Claiming that climate change impacts are ‘worse than we thought’ because predictions are now more frightening is a well worn playbook of the climate movement.
Simply put, when current reality fails to alarm, make scarier and scarier predictions of the distant future.
It seems even some of the worst offenders in alarmism, including Michael Mann, consider Hansen’s claims “over the top”. This may in fact be the first paper in recent times that Hansen has submitted that has a strong possibility of being rejected for publication. It appears he’s lost his mojo with his peers when they say thing like in the bullet point list above.
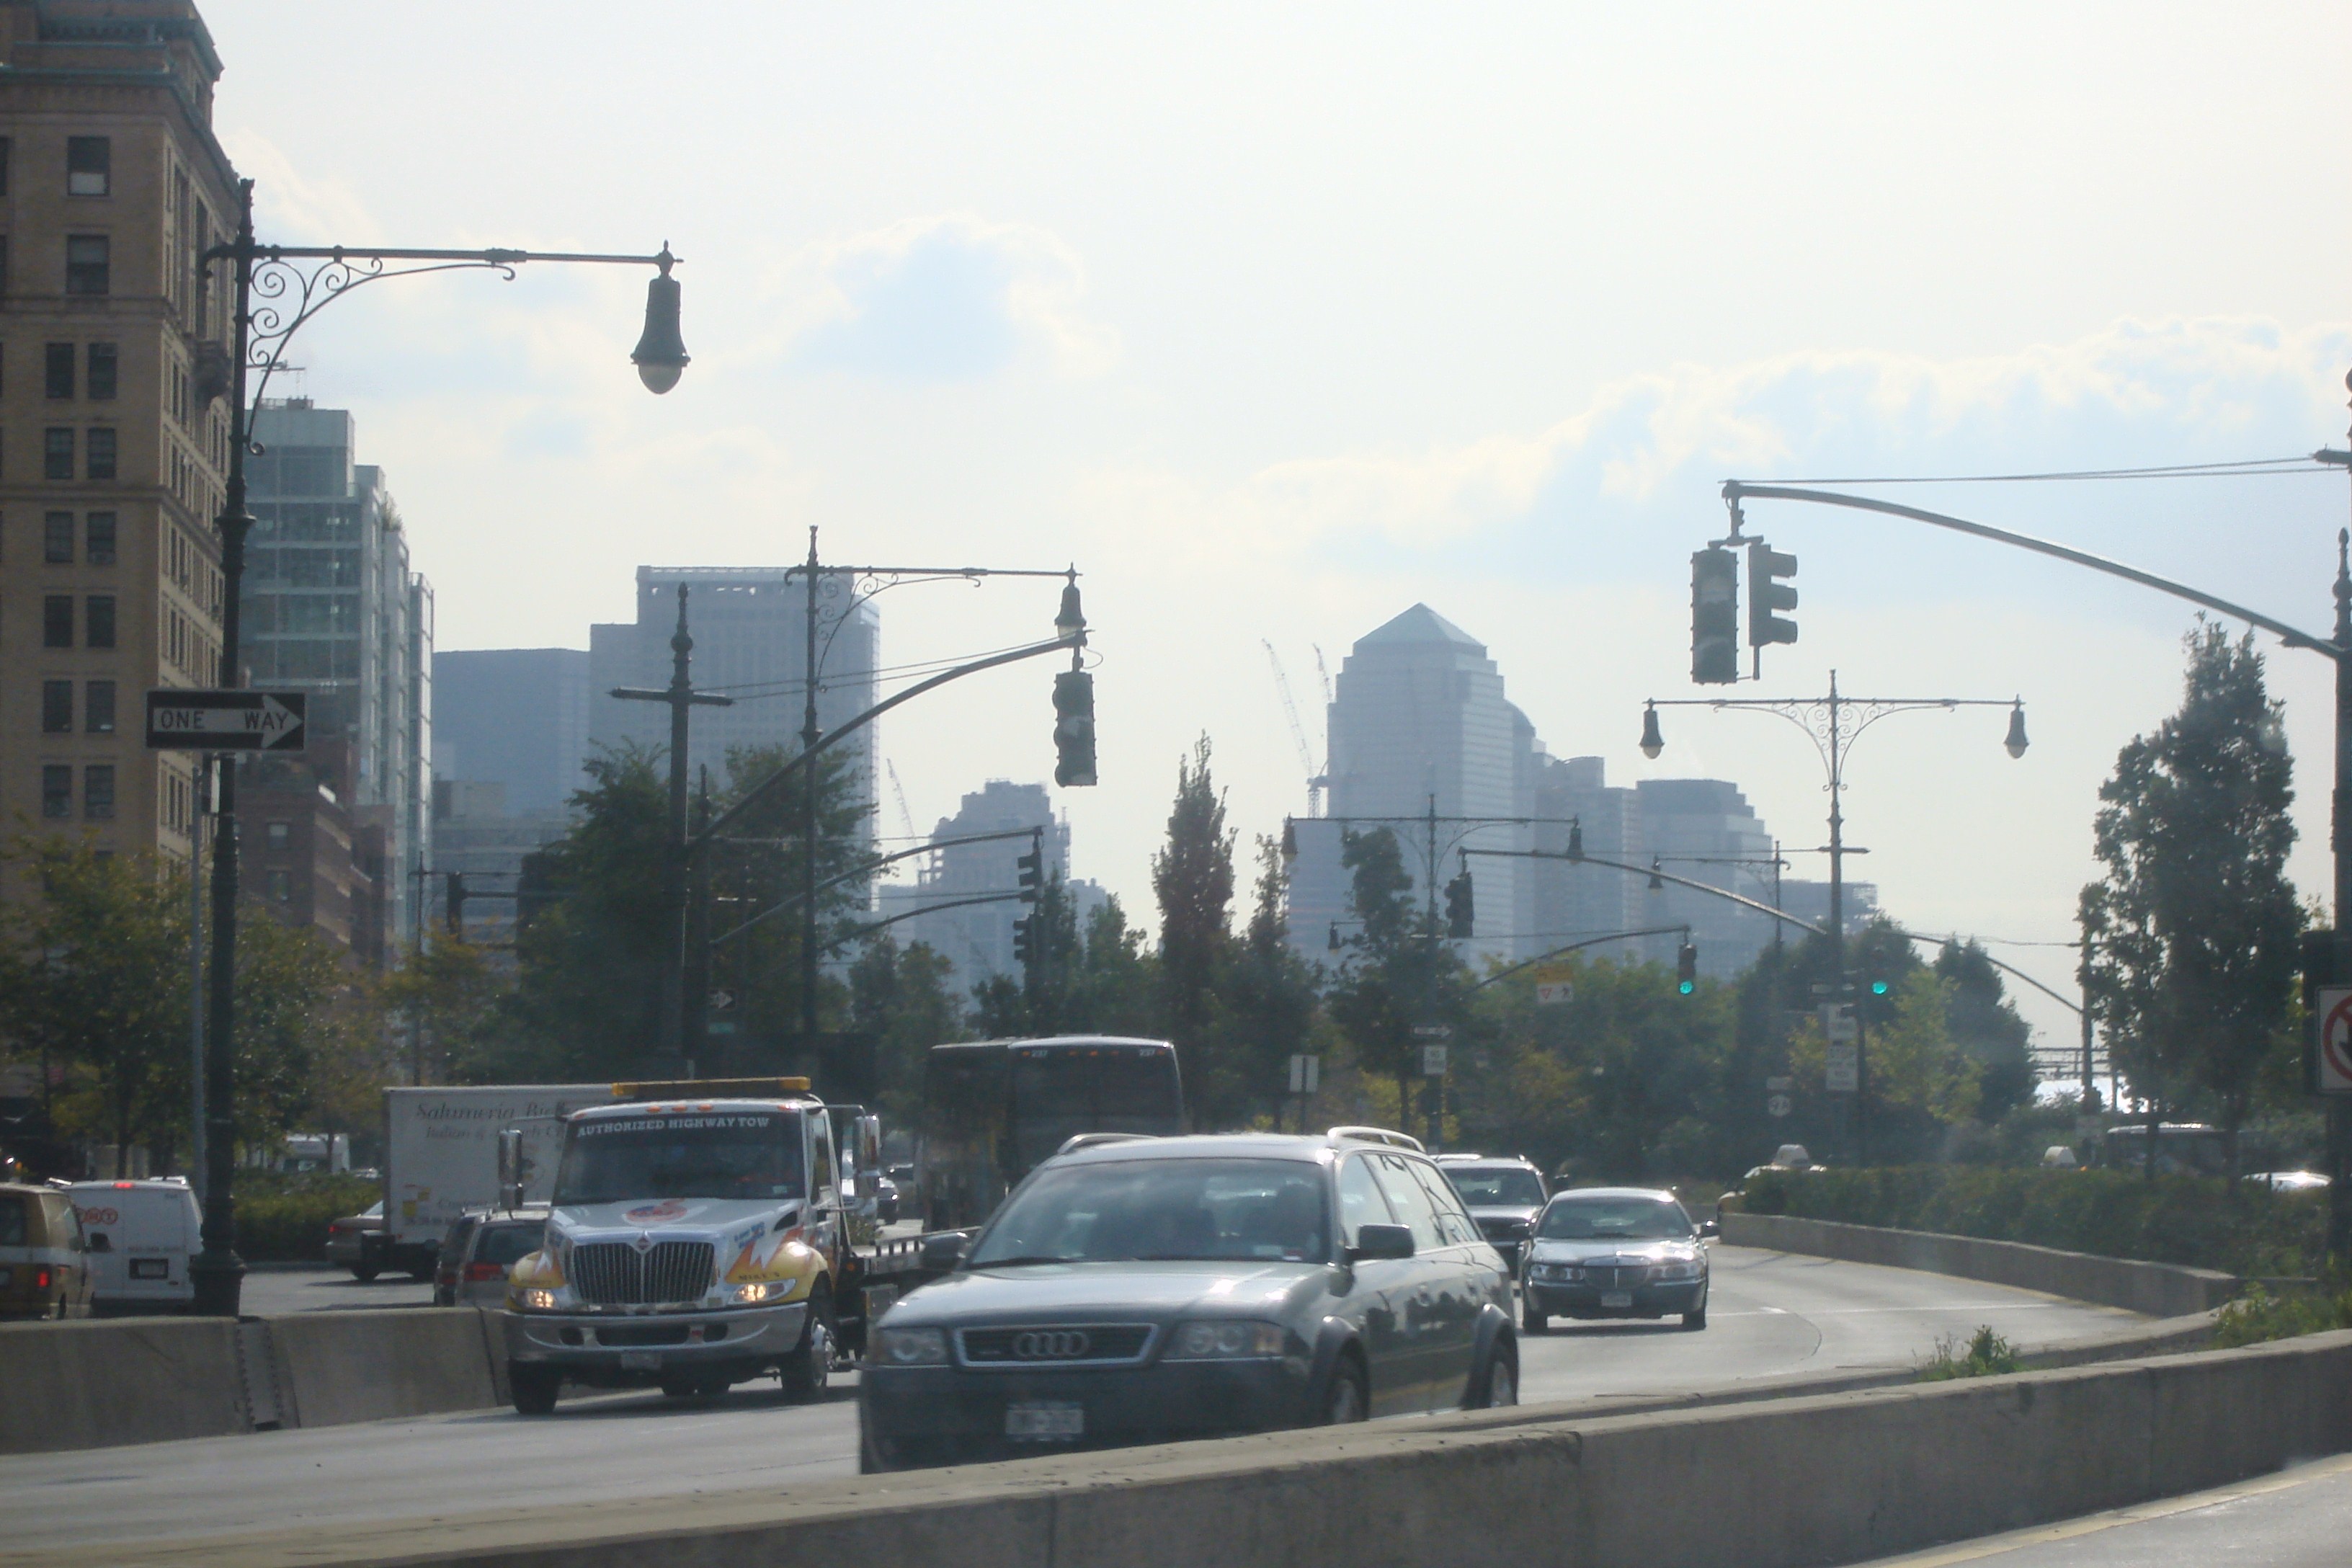
I’ll remind readers that one of Hansen’s most alarming predictions about sea level rise in New York City has yet to come to pass, looked to be falsfied in 2011, and so the goalposts got moved into the future, just as Morano says. Readers may recall our story about the claim Hansen made about the West Side Highway in New York city being underwater by now, due to sea level rise, visible from Hansen’s office at GISS.
I wrote then:
In a 2001 interview with author Rob Reiss about his upcoming book “Stormy Weather” Salon.com contributor Suzy Hansen (no apparent relation to Jim Hansen) asks some questions about his long path of research for the book. One of the questions centered around an interview of Dr. James Hansen by Reiss around 1988-1989. Red emphasis mine.
Extreme weather means more terrifying hurricanes and tornadoes and fires than we usually see. But what can we expect such conditions to do to our daily life?
While doing research 12 or 13 years ago, I met Jim Hansen, the scientist who in 1988 predicted the greenhouse effect before Congress. I went over to the window with him and looked out on Broadway in New York City and said, “If what you’re saying about the greenhouse effect is true, is anything going to look different down there in 20 years?” He looked for a while and was quiet and didn’t say anything for a couple seconds. Then he said, “Well, there will be more traffic.” I, of course, didn’t think he heard the question right. Then he explained, “The West Side Highway [which runs along the Hudson River] will be under water. And there will be tape across the windows across the street because of high winds. And the same birds won’t be there. The trees in the median strip will change.” Then he said, “There will be more police cars.” Why? “Well, you know what happens to crime when the heat goes up.”
And so far, over the last 10 years, we’ve had 10 of the hottest years on record.
Didn’t he also say that restaurants would have signs in their windows that read, “Water by request only.”
Under the greenhouse effect, extreme weather increases. Depending on where you are in terms of the hydrological cycle, you get more of whatever you’re prone to get. New York can get droughts, the droughts can get more severe and you’ll have signs in restaurants saying “Water by request only.”
When did he say this will happen?
Within 20 or 30 years. And remember we had this conversation in 1988 or 1989.
Does he still believe these things?
Yes, he still believes everything. I talked to him a few months ago and he said he wouldn’t change anything that he said then.
I’ve saved the Salon.com web page as a PDF also, here, just in case it should be deleted. So not only did Dr. Hansen make the claims in the late 1980’s, he reaffirmed his predictions again in 2001.
When we reported the story in 2011, saying Hansen’s prediction was falsified, it made some waves, and lo and behold, the reporter comes to the rescue of Hansen, by moving the goalposts out another 20 years.
See the relevant excerpt below:
Michaels also has the facts wrong about a 1988 interview of me by Bob Reiss, in which Reiss asked me to speculate on changes that might happen in New York City in 40 years assuming CO2 doubled in amount. Michaels has it as 20 years, not 40 years, with no mention of doubled CO2. Reiss verified this fact to me, but he later sent the message:
“I went back to my book and re-read the interview I had with you. I am embarrassed to say that although the book text is correct, in remembering our original conversation, during a casual phone interview with a Salon magazine reporter in 2001 I was off in years. What I asked you originally at your office window was for a prediction of what Broadway would look like in 40 years, not 20. But when I spoke to the Salon reporter 10 years later probably because I’d been watching the predictions come true, I remembered it as a 20 year question.“
Source: this update on Dr. Hansen’s personal web page at Columbia University. In my original story, I quoted from Reiss here in the Salon interview.
But here’s the thing, whether its 20 or 40 years, it makes no difference. Hansen’s claim of the “The West Side Highwaywill be under water.” is still falsified by actual data.
Let’s look at the tide gauge in New York and see what it says.

Here’s the PSMSL page that is the source of the above graphic and data http://www.psmsl.org/data/obtaining/stations/12.php
You can see the terrifying surge of acceleration in the sea level due to increasing GHGs in the 20th century. Willis downloaded and plotted the data to see what the slope looked like, and then plotted a linear average line.
Here it is overlaid with the Colorado satellite data. Note the rate of rise is unchanged:

At 11 inches per century, there’s a real problem with Hansen’s claim of sea level rise covering the Westside Highway. He’s betting on acceleration of sea level rise due to increased CO2, but the trend is clearly linear, not exponential.
Additionally and inconveniently, this peer reviewed paper from the Journal of Coastal Research says: “worldwide-temperature increase has not produced acceleration of global sea level over the past 100 years”
The results are stunning for their contradiction of AGW theories which suggest global warming would accelerate sea level rise during the last century.

“Our first analysis determined the acceleration, a2, for each of the 57 records with results tabulated in Table 1 and shown in Figure 4. There is almost a balance with 30 gauge records showing deceleration and 27 showing acceleration, clustering around 0.0 mm/y2.”
…
The near balance of accelerations and decelerations is mirrored in worldwidegauge records as shown in Miller and Douglas (2006)
As of this update in July 2015, we’re 27 years into his prediction of the West Side Highway being underwater. From what I can measure in Google Earth, Dr. Hansen would need at least a ten foot rise in forty years to make his prediction work. See this image below from Google Earth where I placed the point over the WestSide Highway, near the famous landmark and museum, the USS Intrepid:

The lat/lon should you wish to check yourself is: 40.764572° -73.998498°
Here’s a ground level view (via a tourist photo) so you can see the vertical distance from the roadway to the sea level on that day and tide condition. Sure looks like at least 10 feet to me.

According to the actual data, after 27 years, we’ve seen about a 2.6 inch rise. There’ s still a very long way to go to ten feet to cover the West Side Highway there.
To reach the goal he predicted in 1988, Dr. Hansen needs to motivate the sea to do his bidding, he’s going have to kick it in high gear and use a higher octane climate driver than CO2 if he’s going to get there.
Problem is, here it is some 27 years later, and people still drive that highway today without the use of Jet-Skis.
Of course when you live in a modeled world of the future, rather than the real world of the present, anything is possible.
Now for part two.
I recently highlighted the press release and paper from Dutton et al. titled “Sea-level rise due to polar ice-sheet mass loss during past warm periods” in this WUWT story:
Claim: 20-foot sea-level rise in our future (except nature isn’t cooperating so far)
They had this graphic to ramp up the correlation fear of rising CO2 and rising sea level:

In that story there is this interesting statement that appears on the AAAS/Science website about the paper, emphasis mine:
ADVANCES
Interdisciplinary studies of geologic archives have ushered in a new era of deciphering magnitudes, rates, and sources of sea-level rise. Advances in our understanding of polar ice-sheet response to warmer climates have been made through an increase in the number and geographic distribution of sea-level reconstructions, better ice-sheet constraints, and the recognition that several geophysical processes cause spatially complex patterns in sea level. In particular, accounting for glacial isostatic processes helps to decipher spatial variability in coastal sea-level records and has reconciled a number of site-specific sea-level reconstructions for warm periods that have occurred within the past several hundred thousand years. This enables us to infer that during recent interglacial periods, small increases in global mean temperature and just a few degrees of polar warming relative to the preindustrial period resulted in ≥6 m of GMSL rise. Mantle-driven dynamic topography introduces large uncertainties on longer time scales, affecting reconstructions for time periods such as the Pliocene (~3 million years ago), when atmospheric CO2 was ~400 parts per million (ppm), similar to that of the present. Both modeling and field evidence suggest that polar ice sheets were smaller during this time period, but because dynamic topography can cause tens of meters of vertical displacement at Earth’s surface on million-year time scales and uncertainty in model predictions of this signal are large, it is currently not possible to make a precise estimate of peak GMSL during the Pliocene.
Even with the uncertainty factors, a conclusion we can draw from that is that CO2 at present day levels seemed to have no significant effect on sea level rise in that era.
It is clear from that statement that despite no help from greenhouse gas levels, past interglacial periods had higher temperatures than the present and sea levels were significantly higher. The new study in Science magazine shows that in previous interglacial periods, some shorter than our present interglacial, sea levels were as much as 20 to 42 feet higher than during the present interglacial period, and temperatures were also consistently warmer, yet carbon dioxide levels were the same as or lower than they are now, suggesting atmospheric greenhouse gases have not been drivers of significant sea level rise during that period.
 Like with this scary claim from National Geographic even if we do see sea level rise continuously, we may very well be into the next ice age before it happens:
I wrote then:
How long will it take to reach the NatGeo waterline in the cover photo?
The mean sea level trend is 2.77 millimeters per year. At that rate we have:
65.2 meters = 65200 millimeters / 2.77 mm/yr = 23537.9 years
That’s right, 23 thousand 500 years!
A new ice age will likely be well underway then, dropping sea levels. The water would never get there. That’s assuming the statue still exists there at all. Ironically, Liberty Island is a remnant of the last ice age:
Liberty Island is a small 12.7-acre island in New York Harbor. As a remnant of last glacial age, it is composed of sand and small stones deposited as the glaciers retreated.
Even if we believe that sea level will accelerate to 2 or 3 times that rate (as some proponents would have us believe), we are still looking at thousands of years into the future. At a 3x rate, we are looking at 7846 years into the future.
And then there’s this story I wrote back in 2010, Freaking out about NYC sea level rise is easy to do when you don’t pay attention to history
It was about this image:

Turns out it will take about 26,000 years to reach that level.
As I said in the title, the fears of catastrophic CO2 driven sea level rise seem to be little more than a spurious correlation in the minds of alarmists.
wait … If NYC is flooded, where will all those hipsters and intellectuals go?
Gaia … no!
oh the humanity!
climate change must be stopped at all cost!
“if you are going to San.. Fran.. Cisco..”
Brooklyn Heights?
In this paper
http://www.columbia.edu/~jeh1/mailings/2011/20110118_MilankovicPaper.pdf
by Dr. Hansen from a few years back, he claims that five meters of sea level rise is possible by the end of the century. See figure 7. If you follow his reasoning then, it comes to a millimeter per day by 2100.
The man has no shame when it comes to making stuff up. He never learned the lesson from Dr. Seuss and his “And to Think That I Saw It on Mulberry Street” tale.
http://covers.booktopia.com.au/big/9780007169924/and-to-think-that-i-saw-it-on-mulberry-street.jpg
https://mrshenson.files.wordpress.com/2010/11/mullberry-street.pdf
This is the last sentence of his abstract. And this is precisely where he departs from any pretense of scientific objectivity. This isn’t about the science. This is about saving mankind! He doesn’t even address the question of whether, or how much, CO_2 causes warming. In his own mind that isn’t even a suitable matter for discussion. It is given. It is a simple fact. He then goes off on a tangent about “reaching the Holocene optimum” temperature (unproven, and frankly unprovable) and how we will any day now trigger runaway positive feedback warming, the long awaited “collapse of the ice sheets” with strong positive feedback.
Hansen has been unable to separate his own opinion from science pretty much from the beginning. He decided — personally — that we were en route to a catastrophe thirty odd years ago. He has subsequently and without hesitation advanced any claim, no matter how extreme, to force the rest of the world to act on his own personal judgment. If Feynman’s cargo cult talk laid out the case and nature of scientific honesty — the need to clearly state all the reasons to doubt your own conclusions, the places where your argument is uncertain, the places where there is no real evidence to support them — Hansen has been the world’s poster child for scientific dishonesty. He repeatedly states things as simple fact that are, in fact, the result of a tangled web of unproven (and often overtly contradicted) hypotheses, and uses them to conclude that we are doomed unless we decarbonize, literally at all costs. He would — as far as I can tell — cheerfully condemn the poorest people in the word to fifty more years of 18th century poverty if that’s what it takes to decarbonize “rapidly”. If ten, fifty, or a hundred million of them die needlessly as direct or indirect consequences of this poverty, what does it matter? It’s all about preserving the planet, and humans if anything are part of the plague upon it.
And this is who ran NASA GISS for what, almost thirty years! With this utter lack of objectivity, with the gall to insert a purely political statement into a scientific abstract, with his utter willingness to hide any uncertainty whatsoever from his presentation and present it as revealed truth not subject to any sort of scrutiny or question or possible error, is there any reason to doubt that his beliefs and opinions influenced absolutely everything from his hiring practices to his expectations concerning the “results” obtained by his subordinates for his entire tenure at NASA?
We might as well install a born-again young-earth biblical literalist as the head of the NSF, and a Jehovah’s Witness as the head of NIH. What could go wrong?
rgb
and, from your quote choice, has not contemporary civilization been developed through fossil fuels?
The Earth is not Venus. Ridiculous zealotry by Dr. Hansen. But instead of kicking him out of the NAS, they’re making another zealot their president. Sad. Lysenko plus Goebbels with social media to spread, encourage and enforce. Truth (and science) be damned. But it plays so well into the politicians’ needs. As Mencken said, “The whole aim of practical politics is to keep the populace alarmed (and hence clamorous to be led to safety) by menacing it with an endless series of hobgoblins, all of them imaginary.”
“born-again young-earth biblical literalist as the head of NSF”
Hmmm, Forest Mims would probably make a dandy head of the NSF – though I don’t think he is a young-earther.
As McIntyre says, a “Jor-El” complex.
How stupid is to visualise 20 feet sea level rise and have water in streets? So for 100 years, everybody will just watch, and do nothing? Nobody will increase land level in lowest parts of the city?
“Do you get the impression, as I do, that the staff gathers in a room and decides what the results should be, and then tortures the model (or just uses fudge factors) until they get to the results that they were determined to achieve? Why bother with extensive, complicated models if you are just going to manipulate the results,” Stanley wrote. “Because the model provides at least the illusion of rigor and objectivity.”
This relates to the Fed and its Models. You can just substitute Global Warming wherever appropriate
http://www.marketwatch.com/story/here-are-the-staff-forecasts-that-the-fed-accidentally-leaked-2015-07-24?dist=afterbell
Serious question for James Hanson: How do you know that slightly warmer waters around land based ice sheets won’t actually lead to lower sea levels due to higher deposition over land? What if a moderate warming helps sea levels to fall? It’s SO DAMN cold over Antarctica, the world’s largest desert, that at the edges, a little extra heat might mean a bit more transport of water vapor into the inner continent, to places where it will fall as snow and be practically sequestered for a very long time. Is it a ridiculous question?
In any case, I think the main body of the world’s ice, the East Antarctica ice sheet, will not melt until plate tectonics moves the Antarctic continent away from the Southern pole.
Hansen isn’t stupid, and yet persists with this somewhat more tolerable nonsense. The CO2 gas may do something, but must be so minute that in practice makes no difference, since no one has yet conclusively proved its responsibility for the temperature rise, but hey, the geomagnetic field can and does move small chunk of magnetised steel.
I look at data for fun of it, often nothing better to do, find a correlation (real or spurious) plot a graph and tell ‘the world’ about it.
Do I believe in it, not in the slightest, but keeps brain cells working. I suppose people like Hansen, Mann, and co, know they are selling us a ‘dud’ but they have built their carriers on falls assumptions, and now it is too late and would be too costly to their reputations and pockets (possible legal consequences ?) to get out of the mess they created.
Hansen the cherry proxy picker? Why is one better than the other?
“There is evidence of ice melt, sea level rise to +5–9 m, and extreme storms in the prior interglacial period that was less than 1 °C warmer than today”
Remember Earth’s temperatures actually have to rise 1 c for this claim, not manufactured warming only caused by the result of adjustments to data.
Hanson’s main claim is based on proxies that he cherry picks for the sea level rise, but completely ignores them for the no temperature effect and CO2 cause correlation. Where temperature is the cause, rules and CO2 the effect and is just the passenger. The Earths temperature has never relied on the amount of CO2 in it’s atmosphere. The Earth has varied between 180 ppm and 7000 ppm CO2 over hundreds millions of years with temperatures between 12 c and 22 c. Almost any combination of these have occurred during this time.
A +5-9 m rise certainly relies on the Greenland Ice sheet and/or Antarctica melting considerably in such a short period. Evidence for both claims are greatly against with Antarctica far too cold, having increased sea ice and Greenland mass balance significantly gaining in larger areas than significant losses around some coasts.
Maybe Hansen is still hoping for a comet or super volcano to suddenly hit western Antarctica to achieve his view.
I first wanted to note that the last Eemian interglacial was about +2.25C higher than the today according to the ice core record (the only one we have). Hansen’s claim of +1.0C is just fake made-up garbage (which is all he ever does when the paleoclimate is in question).
On the second paper about sea level in the Pliocene, the values are just straight-up cherrypicking.
Here are the CO2 and sea level estimates over the last 8 million years. A person could quote any sea level number between +/- 50 metres in the Pliocene depending on the date. CO2 appears to have nothing to do with it.
http://s23.postimg.org/q98x9m34b/CO2_and_Sea_Level_Last_8_Mys.png
If I was a climate “scientist” I would start to worry. Now that the IPCC models are proving to be garbage and the temperatures look to be headed for an extended cooling period, the knives are sure to come out. Michael Mann who has the most to hide will be eager to throw Hansen under the bus to throw the scent off. I’m pretty sure once the congressional investigations begin the number of climate “scientists” point the finger at other climate”scientists” will increase. If it looks like a Republican is going to win the election it will turn into an outright purge. The Guilty Flee When No One Pursues. Climate “scientists” know what they have to hide, and they know they have done wrong, so their guilt will make them act in very paranoid ways. Michael Mann is classic. Why else would they avoid debates and releasing data? That is so uncharacteristic for a real science.
Gotta love little Jimmy…
Hansen has obviously never read Aesop’s Fables…..
http://i57.tinypic.com/mvj5gi.jpg
Ralph
Should Chicken Little be in there somewhere?
Hansen has always had a far greater need for attention than for science or facts, that from where I sit is pathological.
I suspect that part of “cold shoulder” has to do with the fact that they don’t want to call attention to just how wrong he was back when the CAGW ball started rolling.
What he claimed then got headlines. His hand on the adjustment knob then was useful.
But now?
So, predictions falsified. Now to falsify the Greenhouse Effect hypothesis once and for all!
They’ll get there,…. 🙂
Hansen come out pushing for nuclear as the solution, at least as a stop-gap until renewables took over. That might’ve done him in with some of the other activists in his field.
All of these reports talk about mean sea level as if that was what mattered, but where flooding is concerned it’s the peak tide level that matters. Who cares what the average seal level is? What we want to know, is will it come over the dykes within the next twelve hours?
Now, tidal ranges vary from place to place and with time of year, but in the UK they are typically 3-4 metres. Which, is about a thousand times the annual sea level rise. Then, any sea defences have to be high enough to cope with waves as well as tide, so they will be significantly higher than the highest expected tide. That, I think, puts the microscopic nature of this nonsense into perspective better than anything else.
Professor Humlum’s ‘Oceans’ page has a series of sea level trend charts dating back a century or so, all of which seem to be linear e.g:
http://www.climate4you.com/images/Sydney-NEW.gif
I expect the exponential flume on the IPCC predictions to continue to shift along with each successive report.
As I have mentioned before, the IPCC possess the ACME™ goal post mover.
insert a small section of every viewpoint regarding the climate debate in the volumes of beurocratese of the IPCC reports.Then you can then refer back to any speficic, tiny, vague morsel and claim you covered it thoroughly. Never actually having done so. Like having an “easy” button to attempt to dismiss.
I encourage those who haven’t, to try to read at least AR4. You can skip the summary for policymakers (SPM).
In other words, lots of people have claimed lots of things would happen unless something is controlled that caused whatever it is you want controlled. Discard whatever was claimed that doesn’t advance the the desire to control. Sometimes that means discarding the “claimers”.
Cherry picking at its finest.
If NASA had to employ and use such kind of Hansenian maths, physics and science in the Mars Rover missions, would be hard to believe that NASA will even have managed to have a Robot built in the first place, let alone the ability to deliver it from Earth to Mars and expect it to function properly.
Under such Hansenian.rubbish, the best expected in delivery systems would have been the delivery of a robot from the White House’s lawn to the W.H. gate………. with a lot of luck and hand-pushing and shoveling around.
cheers
Perhaps Hansen’s math’s will facilitate the prime directive for NASA from Obama, by making Muslim’s feel good about themselves. After all, the Middle east’s best math, borrowed from India, must look great in comparison.
Ah yes, but according to the models future robots are projected to be the hottest funkiest evah. Any screws that appear to be loose now are clearly outliers, and thus merely sensory illusions. Thus we should make as many of them now as possible, since there is overwhelming evidence that in the future children will not know what loose screws are.
Robots and climate models designed based Hansonian logic.
Reminded me of this old movie of robots designed to ‘help us’. (No, Yul’s character was not named “Sonny”.
When you have lost that moron Seth Borenstein on climate propaganda, you have really lost it. However I expect a quick call from the White House science adviser will soon change Seth’s mind.
Quite credible I would say! https://twitter.com/SimonFili/status/625406440006680577
But the West Side Highway probably is underwater. Or chunks of it, anyway. They tore it all out ages ago. Dr. Hansen is probably right. (Not about sea level, of course.)
I thought that they simply moved the West Side Highway inland a hundred meters or so between 52nd Street and 43rd Street to make room for the cruise ship terminals and docks. I have no idea what they did with the dirt. Probably used it for fill someplace else in the city.
The West Side Highway was supposed to be underwater by now, not due to sea level rise, but because it was planned to be put in an underwater tunnel. The original highway was a viaduct that ran overhead the current surface boulevard, and was torn down in 1989.
Reblogged this on kingbum78's Blog and commented:
Wow…Hansen just makes me sick there isn’t any other way I can put it..the feeding us lies for years upon years…ugh
Greetings from Seaotu.
Love,
Jimmy H.
[snip another unwelcome sockpuppet rant from Doug Cotton, who is banned. what will it take to convince the thickheaded Mr. Cotton that he’s unwelcome here? -mod]
I do not get any of the abstract…
========================================================
“Our climate model exposes amplifying feedbacks in the Southern Ocean that slow Antarctic bottom water formation and increase ocean temperature near ice shelf grounding lines, while cooling the surface ocean and increasing sea ice cover and water column stability. ”
========================================================
Antarctic bottom water is formed by the sea ice, thus more sea ice should equal more bottom water.
From wik “Surface water is enriched in salt from sea ice formation. Due to its increased density, it flows down the Antarctic continental margin and continues north along the bottom” Apparently the surface water, now more saline, is further cooled by high winds from the continent, then sinks.
Therefore an increase in sea ice should INCREASE the amount of bottom water via a greater increase in saline water, UNLESS there is a major reduction in Antarctic continental winds; apparently all caused by CO2. Is this MODELD reduction the mechanism by which the “model exposes amplifying feedbacks in the Southern Ocean that slow Antarctic bottom water formation.”?
The abstract continues;;;
—————————————————————————-
“Our climate model exposes amplifying feedbacks in the Southern Ocean that slow Antarctic bottom water formation and increase ocean temperature near ice shelf grounding lines, while cooling the surface ocean and increasing sea ice cover and water column stability.”
——————————————————————————–
Hum? Would have been nice to know what feedbacks increase ice (observations) INCREASE ocean T near ice shelf grounding lines, while DECREASING the rest of the ocean surface.
The abstract continues…
=========================================
“Ocean surface cooling, in the North Atlantic as well as the Southern Ocean, increases tropospheric horizontal temperature gradients, eddy kinetic energy and baroclinicity, which drive more powerful storms”
============================================
I am curious how cooler polar oceans increase horizontal troposphere temperature gradients. There is substantial evidence that colder global Temperatures drive more powerful storms.
Apparently the magic molecule is cooling the North Atlantic and Southern oceans, and warming the water next to the ice shelves, while decreasing the Antarctic winds that blow over an increase in forming sea ice causing bottom water, reducing bottom water while increasing the ferocity of global storms.
What did I miss?