Looking back at a recently published paper on ancient sea level and CO2, and noting that the most recent paper by Dr. James Hansen seems to be getting the cold shoulder, I thought it would be a good idea to have a look at both.
First, Hansen’s paper, which isn’t peer-reviewed yet, but is generating some media attention, and some of it isn’t so good. It is titled:
Ice melt, sea level rise and superstorms: evidence from paleoclimate data, climate modeling, and modern observations that 2 ◦C global warming is highly dangerous
Hansen, J., Sato, M., Hearty, P., Ruedy, R., Kelley, M., Masson-Delmotte, V., Russell, G., Tselioudis, G., Cao, J., Rignot, E., Velicogna, I., Kandiano, E., von Schuckmann, K., Kharecha, P., Legrande, A. N., Bauer, M., and Lo, K.-W.: Ice melt, sea level rise and superstorms: evidence from paleoclimate data, climate modeling, and modern observations that 2 °C global warming is highly dangerous, Atmos. Chem. Phys. Discuss., 15, 20059-20179, doi:10.5194/acpd-15-20059-2015, 2015.
Abstract. There is evidence of ice melt, sea level rise to +5–9 m, and extreme storms in the prior interglacial period that was less than 1 °C warmer than today. Human-made climate forcing is stronger and more rapid than paleo forcings, but much can be learned by combining insights from paleoclimate, climate modeling, and on-going observations. We argue that ice sheets in contact with the ocean are vulnerable to non-linear disintegration in response to ocean warming, and we posit that ice sheet mass loss can be approximated by a doubling time up to sea level rise of at least several meters. Doubling times of 10, 20 or 40 years yield sea level rise of several meters in 50, 100 or 200 years. Paleoclimate data reveal that subsurface ocean warming causes ice shelf melt and ice sheet discharge. Our climate model exposes amplifying feedbacks in the Southern Ocean that slow Antarctic bottom water formation and increase ocean temperature near ice shelf grounding lines, while cooling the surface ocean and increasing sea ice cover and water column stability. Ocean surface cooling, in the North Atlantic as well as the Southern Ocean, increases tropospheric horizontal temperature gradients, eddy kinetic energy and baroclinicity, which drive more powerful storms. We focus attention on the Southern Ocean’s role in affecting atmospheric CO2 amount, which in turn is a tight control knob on global climate. The millennial (500–2000 year) time scale of deep ocean ventilation affects the time scale for natural CO2 change, thus the time scale for paleo global climate, ice sheet and sea level changes. This millennial carbon cycle time scale should not be misinterpreted as the ice sheet time scale for response to a rapid human-made climate forcing. Recent ice sheet melt rates have a doubling time near the lower end of the 10–40 year range. We conclude that 2 °C global warming above the preindustrial level, which would spur more ice shelf melt, is highly dangerous. Earth’s energy imbalance, which must be eliminated to stabilize climate, provides a crucial metric.
Hansen’s paper is now open for public comment.
Meanwhile, Climate Depot reports: Former NASA lead global warming scientist James Hansen’s new sea level rise scare study gets ‘cold shoulder’ from climate establishment.
- Warmist AP climate reporter Seth Borenstein said he ‘would not cover’ Hansen’s paper.
- UN IPCC Lead Author Kevin Trenberth calls Hansen’s study ‘rife with speculation and ‘what if’ scenarios’ and based on ‘flimsy evidence.’
- NYT’s Andrew Revkin: “Associated Press, The New York Times, the BBC and The Guardian..among those who steered clear of [Hansen] study”
- Even Michael Mann admits Hansen’s sea level rise estimates are ‘prone to a very large ‘extrapolation error’
Marc Morano comments:
“James Hansen’s new paper ratcheting up future sea level rise numbers is consistent with the new strategy of the global warming activists. Given that current sea level rise rates are not alarming, the only way climate activists can claim anything is ‘worse than we thought’ is to make more dire predictions of the future.
Simply making scarier predictions of the future in order to alarm policymakers is not ‘good science.’ Claiming that climate change impacts are ‘worse than we thought’ because predictions are now more frightening is a well worn playbook of the climate movement.
Simply put, when current reality fails to alarm, make scarier and scarier predictions of the distant future.
It seems even some of the worst offenders in alarmism, including Michael Mann, consider Hansen’s claims “over the top”. This may in fact be the first paper in recent times that Hansen has submitted that has a strong possibility of being rejected for publication. It appears he’s lost his mojo with his peers when they say thing like in the bullet point list above.
I’ll remind readers that one of Hansen’s most alarming predictions about sea level rise in New York City has yet to come to pass, looked to be falsfied in 2011, and so the goalposts got moved into the future, just as Morano says. Readers may recall our story about the claim Hansen made about the West Side Highway in New York city being underwater by now, due to sea level rise, visible from Hansen’s office at GISS.
I wrote then:
In a 2001 interview with author Rob Reiss about his upcoming book “Stormy Weather” Salon.com contributor Suzy Hansen (no apparent relation to Jim Hansen) asks some questions about his long path of research for the book. One of the questions centered around an interview of Dr. James Hansen by Reiss around 1988-1989. Red emphasis mine.
Extreme weather means more terrifying hurricanes and tornadoes and fires than we usually see. But what can we expect such conditions to do to our daily life?
While doing research 12 or 13 years ago, I met Jim Hansen, the scientist who in 1988 predicted the greenhouse effect before Congress. I went over to the window with him and looked out on Broadway in New York City and said, “If what you’re saying about the greenhouse effect is true, is anything going to look different down there in 20 years?” He looked for a while and was quiet and didn’t say anything for a couple seconds. Then he said, “Well, there will be more traffic.” I, of course, didn’t think he heard the question right. Then he explained, “The West Side Highway [which runs along the Hudson River] will be under water. And there will be tape across the windows across the street because of high winds. And the same birds won’t be there. The trees in the median strip will change.” Then he said, “There will be more police cars.” Why? “Well, you know what happens to crime when the heat goes up.”
And so far, over the last 10 years, we’ve had 10 of the hottest years on record.
Didn’t he also say that restaurants would have signs in their windows that read, “Water by request only.”
Under the greenhouse effect, extreme weather increases. Depending on where you are in terms of the hydrological cycle, you get more of whatever you’re prone to get. New York can get droughts, the droughts can get more severe and you’ll have signs in restaurants saying “Water by request only.”
When did he say this will happen?
Within 20 or 30 years. And remember we had this conversation in 1988 or 1989.
Does he still believe these things?
Yes, he still believes everything. I talked to him a few months ago and he said he wouldn’t change anything that he said then.
I’ve saved the Salon.com web page as a PDF also, here, just in case it should be deleted. So not only did Dr. Hansen make the claims in the late 1980’s, he reaffirmed his predictions again in 2001.
When we reported the story in 2011, saying Hansen’s prediction was falsified, it made some waves, and lo and behold, the reporter comes to the rescue of Hansen, by moving the goalposts out another 20 years.
See the relevant excerpt below:
Michaels also has the facts wrong about a 1988 interview of me by Bob Reiss, in which Reiss asked me to speculate on changes that might happen in New York City in 40 years assuming CO2 doubled in amount. Michaels has it as 20 years, not 40 years, with no mention of doubled CO2. Reiss verified this fact to me, but he later sent the message:
“I went back to my book and re-read the interview I had with you. I am embarrassed to say that although the book text is correct, in remembering our original conversation, during a casual phone interview with a Salon magazine reporter in 2001 I was off in years. What I asked you originally at your office window was for a prediction of what Broadway would look like in 40 years, not 20. But when I spoke to the Salon reporter 10 years later probably because I’d been watching the predictions come true, I remembered it as a 20 year question.“
Source: this update on Dr. Hansen’s personal web page at Columbia University. In my original story, I quoted from Reiss here in the Salon interview.
But here’s the thing, whether its 20 or 40 years, it makes no difference. Hansen’s claim of the “The West Side Highwaywill be under water.” is still falsified by actual data.
Let’s look at the tide gauge in New York and see what it says.

Here’s the PSMSL page that is the source of the above graphic and data http://www.psmsl.org/data/obtaining/stations/12.php
You can see the terrifying surge of acceleration in the sea level due to increasing GHGs in the 20th century. Willis downloaded and plotted the data to see what the slope looked like, and then plotted a linear average line.
Here it is overlaid with the Colorado satellite data. Note the rate of rise is unchanged:

At 11 inches per century, there’s a real problem with Hansen’s claim of sea level rise covering the Westside Highway. He’s betting on acceleration of sea level rise due to increased CO2, but the trend is clearly linear, not exponential.
Additionally and inconveniently, this peer reviewed paper from the Journal of Coastal Research says: “worldwide-temperature increase has not produced acceleration of global sea level over the past 100 years”
The results are stunning for their contradiction of AGW theories which suggest global warming would accelerate sea level rise during the last century.

“Our first analysis determined the acceleration, a2, for each of the 57 records with results tabulated in Table 1 and shown in Figure 4. There is almost a balance with 30 gauge records showing deceleration and 27 showing acceleration, clustering around 0.0 mm/y2.”
…
The near balance of accelerations and decelerations is mirrored in worldwidegauge records as shown in Miller and Douglas (2006)
As of this update in July 2015, we’re 27 years into his prediction of the West Side Highway being underwater. From what I can measure in Google Earth, Dr. Hansen would need at least a ten foot rise in forty years to make his prediction work. See this image below from Google Earth where I placed the point over the WestSide Highway, near the famous landmark and museum, the USS Intrepid:

The lat/lon should you wish to check yourself is: 40.764572° -73.998498°
Here’s a ground level view (via a tourist photo) so you can see the vertical distance from the roadway to the sea level on that day and tide condition. Sure looks like at least 10 feet to me.

According to the actual data, after 27 years, we’ve seen about a 2.6 inch rise. There’ s still a very long way to go to ten feet to cover the West Side Highway there.
To reach the goal he predicted in 1988, Dr. Hansen needs to motivate the sea to do his bidding, he’s going have to kick it in high gear and use a higher octane climate driver than CO2 if he’s going to get there.
Problem is, here it is some 27 years later, and people still drive that highway today without the use of Jet-Skis.
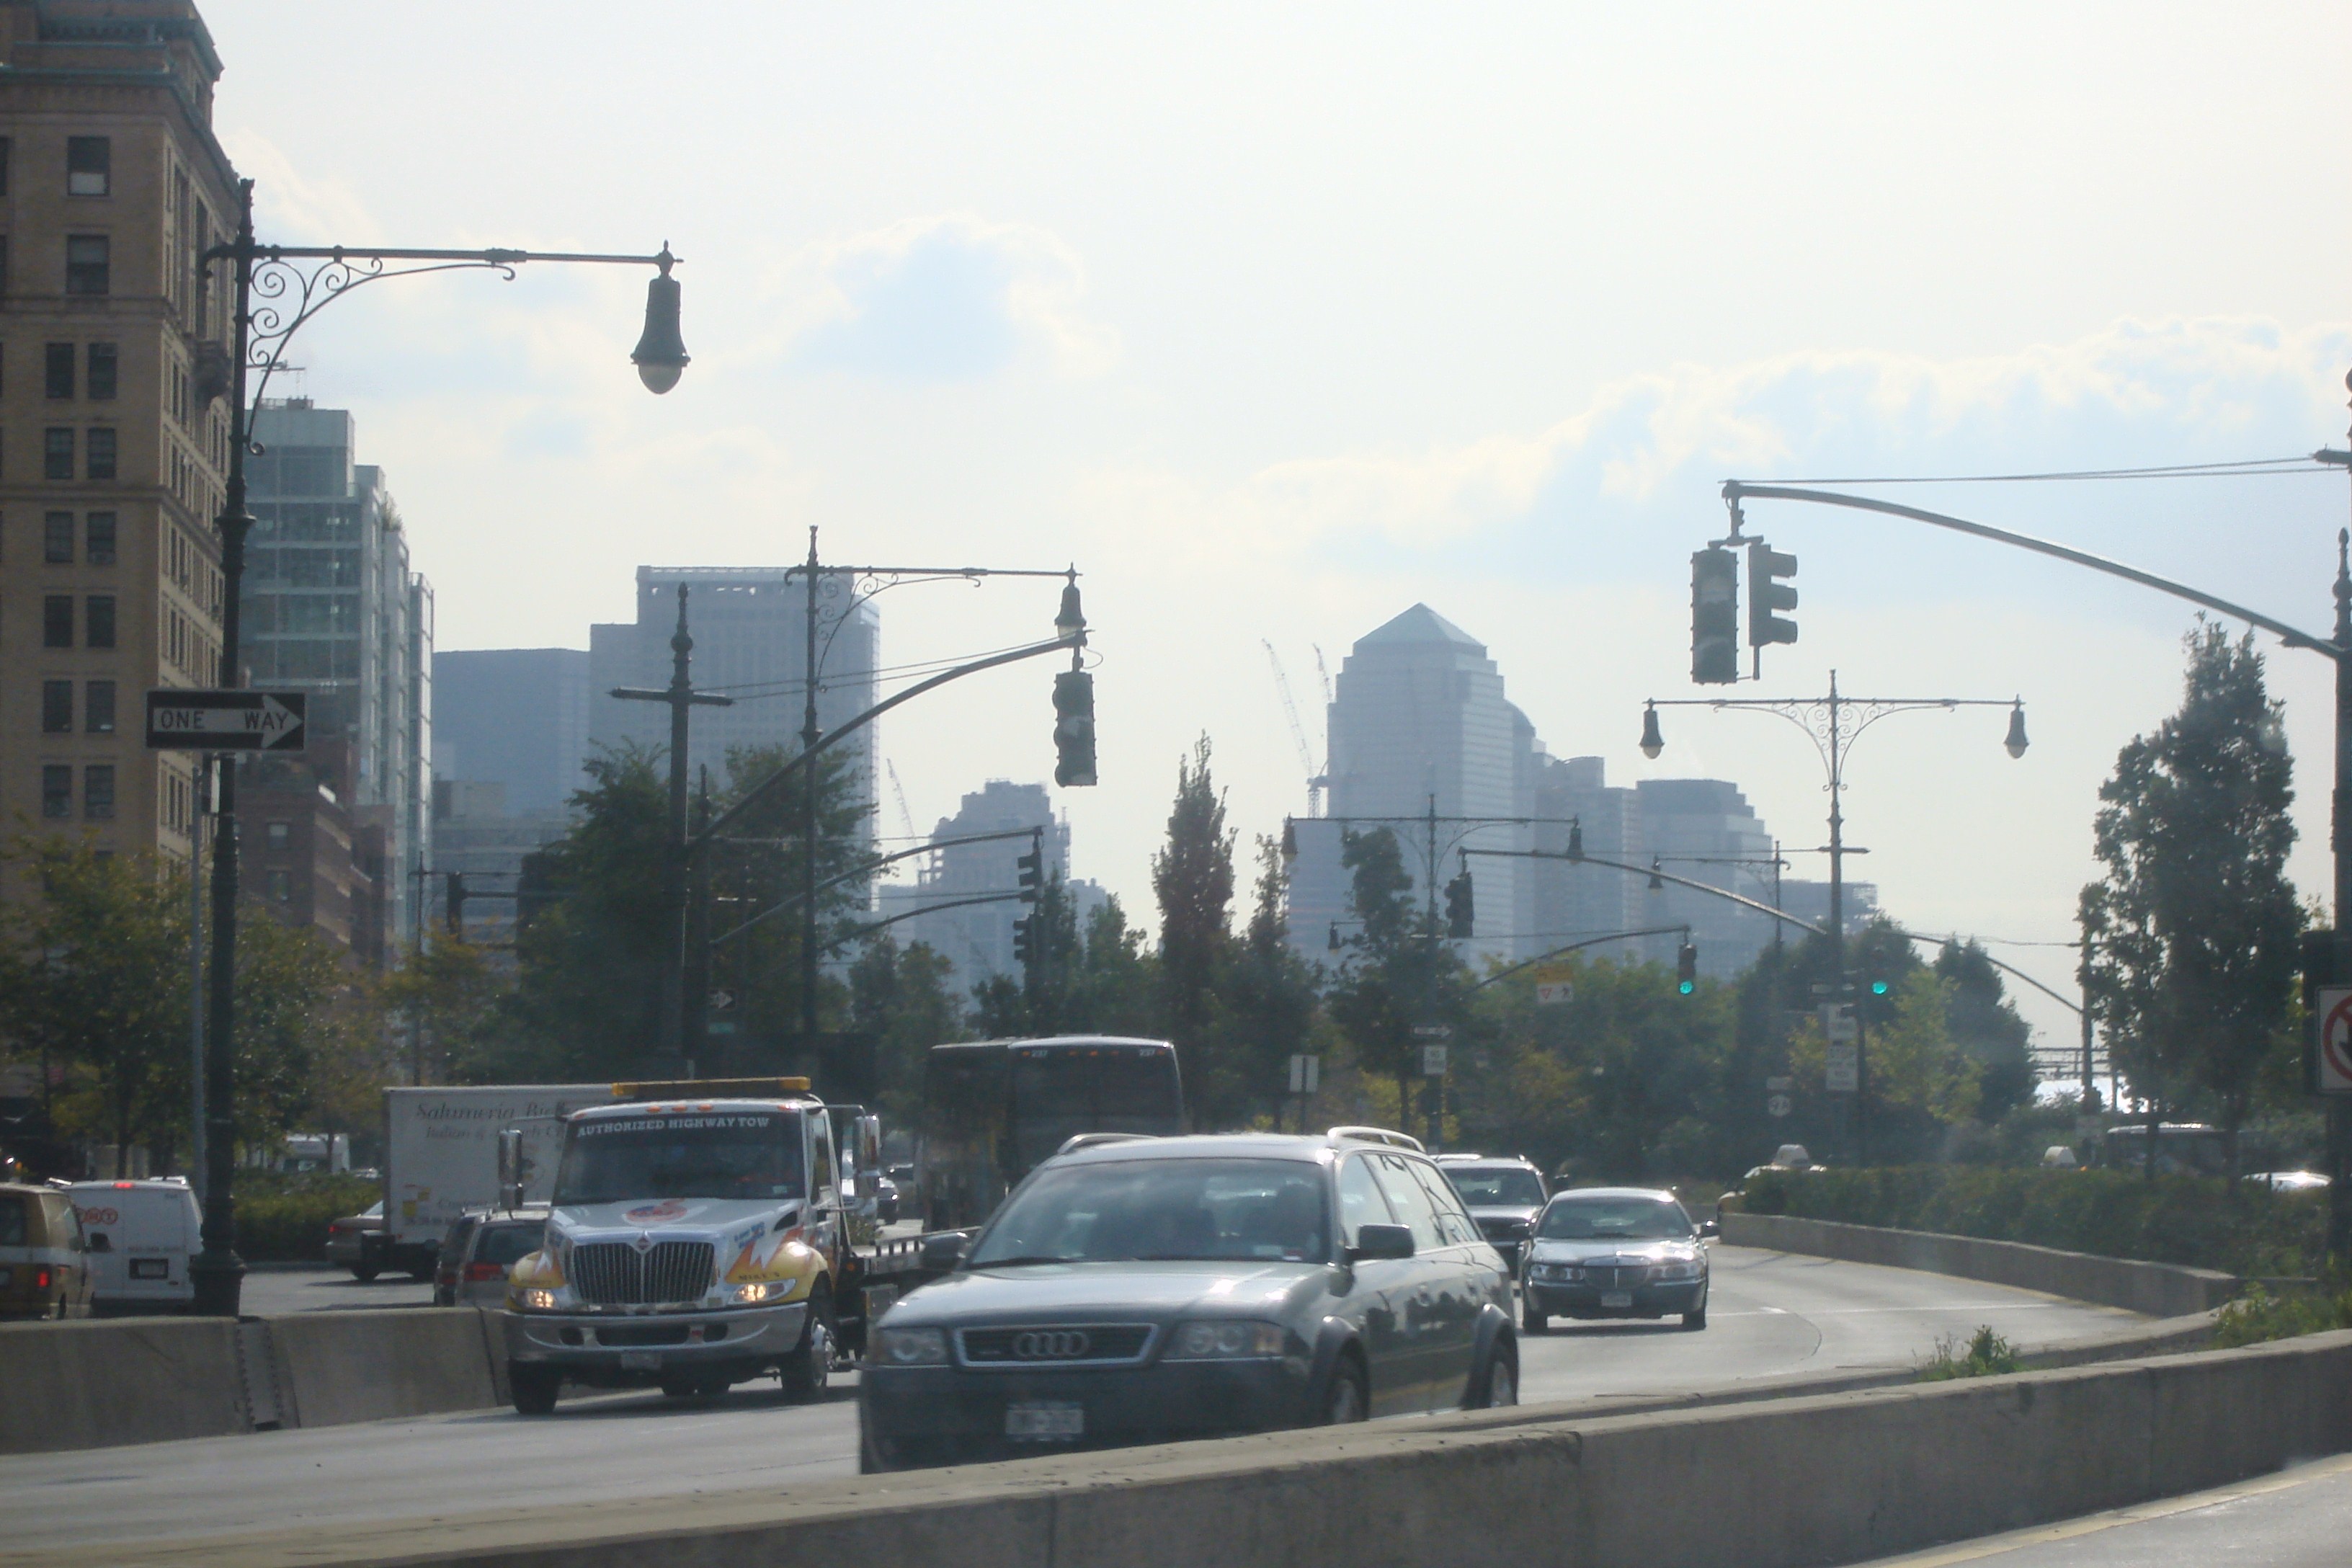
Of course when you live in a modeled world of the future, rather than the real world of the present, anything is possible.
Now for part two.
I recently highlighted the press release and paper from Dutton et al. titled “Sea-level rise due to polar ice-sheet mass loss during past warm periods” in this WUWT story:
Claim: 20-foot sea-level rise in our future (except nature isn’t cooperating so far)
They had this graphic to ramp up the correlation fear of rising CO2 and rising sea level:

In that story there is this interesting statement that appears on the AAAS/Science website about the paper, emphasis mine:
ADVANCES
Interdisciplinary studies of geologic archives have ushered in a new era of deciphering magnitudes, rates, and sources of sea-level rise. Advances in our understanding of polar ice-sheet response to warmer climates have been made through an increase in the number and geographic distribution of sea-level reconstructions, better ice-sheet constraints, and the recognition that several geophysical processes cause spatially complex patterns in sea level. In particular, accounting for glacial isostatic processes helps to decipher spatial variability in coastal sea-level records and has reconciled a number of site-specific sea-level reconstructions for warm periods that have occurred within the past several hundred thousand years. This enables us to infer that during recent interglacial periods, small increases in global mean temperature and just a few degrees of polar warming relative to the preindustrial period resulted in ≥6 m of GMSL rise. Mantle-driven dynamic topography introduces large uncertainties on longer time scales, affecting reconstructions for time periods such as the Pliocene (~3 million years ago), when atmospheric CO2 was ~400 parts per million (ppm), similar to that of the present. Both modeling and field evidence suggest that polar ice sheets were smaller during this time period, but because dynamic topography can cause tens of meters of vertical displacement at Earth’s surface on million-year time scales and uncertainty in model predictions of this signal are large, it is currently not possible to make a precise estimate of peak GMSL during the Pliocene.
Even with the uncertainty factors, a conclusion we can draw from that is that CO2 at present day levels seemed to have no significant effect on sea level rise in that era.
It is clear from that statement that despite no help from greenhouse gas levels, past interglacial periods had higher temperatures than the present and sea levels were significantly higher. The new study in Science magazine shows that in previous interglacial periods, some shorter than our present interglacial, sea levels were as much as 20 to 42 feet higher than during the present interglacial period, and temperatures were also consistently warmer, yet carbon dioxide levels were the same as or lower than they are now, suggesting atmospheric greenhouse gases have not been drivers of significant sea level rise during that period.
 Like with this scary claim from National Geographic even if we do see sea level rise continuously, we may very well be into the next ice age before it happens:
I wrote then:
How long will it take to reach the NatGeo waterline in the cover photo?
The mean sea level trend is 2.77 millimeters per year. At that rate we have:
65.2 meters = 65200 millimeters / 2.77 mm/yr = 23537.9 years
That’s right, 23 thousand 500 years!
A new ice age will likely be well underway then, dropping sea levels. The water would never get there. That’s assuming the statue still exists there at all. Ironically, Liberty Island is a remnant of the last ice age:
Liberty Island is a small 12.7-acre island in New York Harbor. As a remnant of last glacial age, it is composed of sand and small stones deposited as the glaciers retreated.
Even if we believe that sea level will accelerate to 2 or 3 times that rate (as some proponents would have us believe), we are still looking at thousands of years into the future. At a 3x rate, we are looking at 7846 years into the future.
And then there’s this story I wrote back in 2010, Freaking out about NYC sea level rise is easy to do when you don’t pay attention to history
It was about this image:

Turns out it will take about 26,000 years to reach that level.
As I said in the title, the fears of catastrophic CO2 driven sea level rise seem to be little more than a spurious correlation in the minds of alarmists.
Hansen and 16 co-authors. What is it that Willis says about the number of authors a paper has?
I bet he is chewing nails! Here is a reminder of who they are.
“Hansen, J., Sato, M., Hearty, P., Ruedy, R., Kelley, M., Masson-Delmotte, V., Russell, G., Tselioudis, G., Cao, J., Rignot, E., Velicogna, I., Kandiano, E., von Schuckmann, K., Kharecha, P., Legrande, A. N., Bauer, M., and Lo, K.-W.”
Maybe they ARE the 97%….
Given some information about the buildings in the picture of New York, and the average rates of ocean change that are shown in this article, I’m predicting that the Atlantic Ocean will reach those levels in the year 22,451 AD.
…in the year 22,451 AD, about the time Charlton Heston walks along the beach there with some babe while being chased by some monkeys.
[my emphasis]
Really! I just assumed that the charge that Alarmists claimed CO2 was the “control knob” for the Earth’s climate was a quick shorthand to characterize a ridiculous position. But here’s the infamous Hansen, putting it in black and white. It’s not a scurrilous slander at all—he actually believes it!
Professor Brown, rgbatduke is being too kind.
/Mr Lynn
I feel sorry for him as he needs to see a shrink very urgently before the men in white coats lock him up
Learning is a wonderful thing. I had no idea the statue of liberty was perched on a terminal moraine.
Dear old James Hansen,
Perhaps a charlatan of note?
His ranting on climate
He appears to learn them by rote,
By his own beliefs indoctrinated,
Completely radicalised,
So by his new proclamations
Why are we surprised?
http://rhymeafterrhyme.net/computer-models/
Nonsense remains nonsense, even if it is printed on Hansen’s best hand-made paper.
Hansen and his “et al’s” aren’t even worth their ‘grant’-ed money as fictionaires. They might be OK as distortionists in some goon show, but…the goons wouldn’t want him.
Hansen`s et als are only useful idiots
We are lucky to have oceans; if the comets that collided with us had been a bit smaller we would be really struggling.
“According to the actual data, after 27 years, we’ve seen about a 2.6 inch rise. There’ s still a very long way to go to ten feet to cover the West Side Highway there.”
I think people are being too hard on Hanson, his prediction for the West Side Highway based on current data puts him off by only about 1,250 years. Like we use to say in the consulting biz, that level of accuracy is “good enough for government work”.
The argument put forth by some that past linear sea rise does not mean future sea rise could become non-linear is unfortunately bankrupt of any evidence.
If I recall the IPCC scriptures correctly, a large component of sea level rise is thought to be thermal expansion of the oceans as warmer air warms the sea surface and the higher temperatures work their way ever deeper. I believe that it is also written there that that is a slow process requiring centuries, not decades. The 85 years remaining in the century hardly seem adequate for much thermal expansion. Could it be possible that Dr Hansen is not familiar with the basic tenants of his faith?
The failure of Hansen’s forecast is worse than you realize. At the time he made his original prediction, the West Side Highway was still an elevated viaduct along its entire length, requiring another 15′-20′ of sea level rise to submerge it.
‘Course, most of the viaduct was torn down in 1989 because it was collapsing on its own.
Also, plans to put the WSH in a tunnel under the Hudson were scuttled in the 80’s.
As I know from having driven it, it was NOT elevated above midtown. At 112th stree it was probably only five feet above the Hudson. (The Hudson rarely rises more than a foot or two.) It would advance the discussion if someone at Columbia would go and measure its elevation, even by eyeball, or just take a photo.
The science has failed. All that is left is intimidation. The Dutch capitulate:
http://www.climatecentral.org/news/should-countries-protect-citizens-climate-change-19270
Here’s my reply to the Hansens of the world and their apocalyptic bleatings: You First!
If the future is that tenuous, if CO2 is that dangerous, let us see you and your cohorts lead the way.
Let us see AlGore divest himself of his multiple “carbon footprint heavy” residences. Same with the Tom Steyers of the world.
Let us see all those “green” champions give up their private jets and fleets of gas guzzling automobiles.
Let us see the participants of all of these moronic conferences held all over the world, where combatting the horrors of climate future to come is cussed and discussed, use video conferencing technology and shelve their jets for all time.
In other words….when YOU act like it’s an imminent catastrophe, maybe, just maybe, we’ll listen, and maybe, just maybe, you’d have a little more legitimacy. (Nah…probably not)
So, the ball is in your court apocalyptos. Care to put your money where your mouth is?
Another approach would be to require them to bet 10% of their income every year on the RSS temperature, say, 10 years from the bet. If they are low or hit the number, pay them a 100% return. If they are high, they lose the money and it gets donated to, say, Heartland. Oh, and they have to publish their prediction when they place the bet.
Exponential projections of linear trends will seem a lot dicier when their, not our, money is on the line.
Pachuri Update:
http://wap.business-standard.com/article/current-affairs/pachauri-accused-of-sexual-harassment-sacked-as-teri-chief-115072301020_1.html
Pachauri ceases to be Teri chief
Nitin Sethi | New Delhi Jul 24, 2015 12:40 AM IST
Accused of sexual harassment of a colleague, R K Pachauri ceased to be chief of The Energy and Resources Institute (Teri), within days of resuming work after a court order had allowed him to physically attend the organisation’s offices. The environmental group’s governing council, meeting in Bengaluru on Thursday, announced that Pachauri would be replaced by Ajay Mathur, who is at present the director-general of the Bureau of Energy Efficiency under the power ministry.
Pachauri, who had proceeded on leave when the news of complaint broke out, in a sudden turn of events, took back charge again at the helm of Teri on July 17. But on Thursday, the governing council of Teri, which includes prominent names such as Naina Lal Kidwai, Kiran-Mazumdar Shaw and Deepak Parekh, met at Bengaluru to conclude that Mathur would replace Pachauri.
Business Standard also reviewed letters written by senior lawyer Vrinda Grover to the Delhi Police commissioner, pointing out that two former employees of Teri, too, wanted to give written complaints of sexual harassment against Pachauri but the police had for months not recorded their statements. She noted that she had repeatedly requested the Delhi Police over months to record their statements in confidentiality but the police had not acted upon the pleas of the two complainants. The letters date to March and April of this year…
26,000 years is fairly close to the amount of time it will take for the celestial pole to make a full circuit of the circumpolar stars. In simpler terms, in that time the spring equinox will migrate through an entire year.
James Hansen (and subsequently the whole AGW crowd) originally applied an algorithm which added back radiation to solar radiation (treating each the same) and used it in Stefan-Boltzmann calculations, showing that 390W/m^2 yields a black body temperature of 288K which is about 15°C, thought to be the mean surface temperature for the whole globe.
But nature always treats every single pencil of radiation such that it obeys the Second Law of Thermodynamics and some of the electro-magnetic energy is only converted to thermal (kinetic) energy in a target that has a lower Planck curve than the effective Planck curve of the source after any attenuation due to distance, reflection or absorption. The Sun’s mean effective radiation is like that of an extremely close black body that is at a very cold -41°C and Hansen realized its direct radiation to the surface could never explain the surface temperature. Such is even more obvious on Venus. Even at Earth’s Equator the mean solar radiation over 24 hours is only around 214W/m^2 for which the black body temperature is about -25°C.
Now, if you calculate a mean temperature using Hansen’s algorithm of adding back radiation into the calculations, then it is implicit that you are applying that algorithm to every location on the globe and determining a mean of all the temperatures thus calculated. You can see that the algorithm is incorrect, because there are regions on the planet which, on a clear day at noon in the tropics, receive over 800W/m^2 – maybe even 1,000W/m^2 of direct solar radiation. If you then add back radiation (probably far greater than the mean of 324W/m^2 in these locations) you get totally unrealistic temperatures often over 90°C. So it’s obviously wrong to do so, and physics confirms this.
Hence, because you can’t add back radiation you can’t deduce that the back radiation from increasing levels of carbon dioxide will cause warming. Furthermore, you have to go looking for a completely different algorithm – a wholly different paradigm, and you find that when you come to understand the process of entropy maximization, which is what the Second Law of Thermodynamics is all about.
Whilst we have to admit that the Sun’s direct radiation into the surfaces of planets like Earth and Venus is obviously insufficient to explain the observed temperatures, we do know that these planetary surfaces rise in temperature on the sunlit side and inevitably cool a little on the dark side. So we can deduce that the warming has something to do with the Sun.
However, for a temperature to rise there must be a net gain of mean molecular kinetic energy, which we will refer to as thermal energy. This can, and does come mostly via molecular collisions between the atmospheric molecules and the solid surface molecules.
But where does the new energy come from in the first place?
When we apply Stefan-Boltzmann calculations we see that the Sun’s direct radiation can usually only raise the temperature of IR-absorbing molecules in the upper atmosphere where the temperatures are low enough for this to happen.
In school-boy physics you probably learnt that heat only transfers from warmer sources to cooler targets. So you will be surprised to learn that there are exceptions to this rule when there is an external force field like gravity. That is because the Second Law of Thermodynamics is really about entropy maximization, and entropy changes when molecular gravitational potential energy changes.
This process has been described in recent publications like “Why It’s Not Carbon Dioxide After All” and there’s not space to elaborate here, save to say that this is indeed the new paradigm that James Hansen was not experienced enough to even contemplate
“So you will be surprised to learn that there are exceptions to this rule when there is an external force field like gravity.”
>>>>>>>>>>>>>>>>>>>>>>>>>
Wow, this guy invented his own physics all by himself!
After reading the observations of Kevin Trenberth, I doubt any sensible Journal publish such a hypothetical exercise as a scientific paper. Before going in to hypothetical exercise they should have looked in to two aspects — the natural impact on sea level rise and sea level rise associated with the global warming; and why there are differences in observed sea level changes [raise over some parts and fall in some parts] and look at some observational sites like San Francisco Airport and Roman Piscinos along the coast to understand the realistic change if any in sea levels. Without any such study simply dumping hypothetical study has no significance. Also, natural variability component play an important role in such studies. Finally, they should present their equation along with the constants that relates the global temperature rise in association with anthropogenic greenhouse gases under greenhouse effect — and its share in global temperature rise that include local and regional components. Without this, there is no use of talking temperature 2 oC or more and thus rise in sea levels in logical paleoclimate terms. The feedback sum – sensitivity factor is monotonically declining from SAR to AR5 [IPCC’s]. This may further decline in AR6, AR7, etc and thus change in temperature with increasing CO2 may reach a plateau like in ‘b’ that was given in below reference — figure 1, ‘a’ relates to naturally existing CO2 in the atmosphere component of relative temperature change:
Relative Stress: S. J.Reddy]- Agric. For. Meteorol., 1995, 77:113-120
In some areas sea levels present a rise, in some fall and in majority of the areas no change. These are associated with natural man induced variations as well as natural variations in climate. Man encountered several forms of natural disasters like earthquakes, volcanoes, floods, droughts, etc. We can see the destruction of civilizations with floods and droughts on the one hand and cyclonic activity/tsunamis on the other hand in the past as part of natural variation in climate, for example the Nile River in the Egypt. Modern man to meet their greed introduced new types of disasters with the destruction of ecology through urbanization, deforestation, mining for oil, gas, water and minerals on the land, in the ocean, along the coast lines. All these have introduced drastic changes on nature. Mangroves along the coast lines were/are considered as protective walls. These reduce the fury of cyclones/tides. When these were/are removed through the spreading of activities such as aqua farms, industrial belts, hotels/buildings, etc they help the destruction of mangroves and thus coast lines. Along the coast lines with extraction of oil, gas, water, helped the sinking of the coastal zones. At the mouth [place where the rivers join the Sea or the Ocean] of the rivers like Ganga, Brahmaputra, Godavari, etc the silt deposition over years helping the spread of mouth area. These are attributed to sea level rise. Tides/cyclones eroded islands.
Dr. S. Jeevananda Reddy
According to Hansen the problem with climate now is that
“… There is evidence of ice melt, sea level rise to +5–9 m, and extreme storms in the prior interglacial period that was less than 1 °C warmer than today. Human-made climate forcing is stronger and more rapid than paleo forcings,”
He is reasoning by analogy which does not lead to scientific proof but let us humor him and see where this will take us. His “prior interglacial period” would be the Eemian of which he has spoken before. According to Hansen’s argument, less than a degree of temperature rise should be enough to bring our temperature and with it sea level up to the present Eemian level. That means sea levels 5 to 9 meters higher than today. Before taking it seriously we should ask if there is a precedent for this. According to Hansen himself, global temperature increase for the entire twentieth century was 0.8 degrees Celsius. This should do as a stand-in for what this amount of warming can do to sea level. So what did happen to sea level rise during the twentieth century? Was the sea rise even close to 5 meters or to 9 meters? Or maybe it was less, like a meter or even less, a half meter? None of the above is true. Twentieth century’s sea level rise was ten inches which is one quarter of a meter. With this meager precedent, is it possible for sea level rise to speed up by a factor of twenty or more to achieve Hansen’s predicted Eemian targets? You don’t even need to be a rocket scientist (which he is not) to see that it is simply a complete fantasy. Obviously that part of his package that is supposed to deliver this miraculous flood is simply non-sensical. He spells it out when he states that “…human made forcing is stronger and more rapid than paleo forcing…” Delusions of grandeur describes this. He imagines that he can compare human made forcing with paleo forcing when they happened at different times in history when he could not even observe them. Paleo forcing certainly left its traces on the landscape. But human forcing according to Hansen requires the presence of the intermediary of carbon dioxide. And so far this gas has left no traces of itself, Hansen and others like him blame atmospheric carbon dioxide for global warming because in their theory CO2 absorbs outgoing long-wave radiation and thereby heats up the world. It works fine in the laboratory but it fails to work in the atmosphere. This is proven by the existence if the hiatus which their greenhouse theory has utterly failed to explain. The theory was conceived by Arrhenius in 1896 and is the theoretical justification for the greenhouise theory that Hansen and others use to explain global warming. Except that it does not do this any more. The story with the hiatus is that dozens of papers have attempted to prove it wrong. The latest one is by Karl et al. It is based upon a wholesale rewrite of global warming records that stinks to high heaven of scientific fraud. They have only two data points showing warming and yet they aim to challenge several decades worth of scientific researche. Not only is the hiatus real but there are two of them. The earlier one was in the eighties and nineties and and has been over-written with fake wqarming by supposed guardians of global temperature. There are three outfits involoved in this forgery – HadCRUT3 (Hadley), GISS (then under Hansen) and NCDC (IPCC). I discivered this in 2008 while doing research for my book “What Warming?” With the demise of the Arrhenius greenhouse theory the only way to understand the hiatus phenomenon now is by using MGT, the Miskolczi greenhouse theory. That is because there are other greenhouse gases present in air, most notably water vapor, that Arrhenius cannot handle. According to MGT, carbon dioxide and water vapor establish a joint optimal absorption window in the infrared whose whose optical thickness is 1.87. The latter value comes from analysis of radiosonde measurements. In a related paper Miskolczi proved the stability of the optical thickness of the Earth’s atmosphere. If you now add carbon dioxide to the atmosphere it will start to absorb in the IR just as Arrhenius predicted. But this will increase the optical thickness, And as soon as this happens water vapor starts to diminish and rain out, the original optical thickness is restored, and no Arrhenius warming takes place. We thus have an increased atmospheric carbon dioxide, still absorbing IR, but no warming because reduction of water vapor in the air balances out the absorption that Arrhenius predicts. And that explains exactly why there is no warming during a hiatus when carbon dioxide is constantly increasing, The numerous authors of articles looking for the lost heat of the hiatus can now be reassured that it did not dive down into the ocean bottom but left the atmosphere for outer space.
.
This paper of Hansen’s is actually pretty typical of climate change apocalypse papers. It is certainly not noticeably different from Dr. Hansen’s earlier papers for which he was lauded. .
Hansen never recognises or understands Freeman Dyson’s summation of climate change : “… The climate of the Earth is an immensely complicated system and nobody is close to understanding it.”
Even James Lovelock in The Guardian of 29 March, 2010 recanted his earlier alarmism; ” The great science centres around the world are more than well aware how weak their science is. If you talk to them privately they’re scared stiff of the fact that they don’t really know what the clouds and the aerosols are doing. They could be absolutely running the show. We haven’t got the physics worked out yet.”
My response above was based on the current article that includes Hansen’s abstract. I stand by what I said but was absolutely astounded at the original when I got to downloadeing it. It is a book-length Magnum Opus of 121 pages. It includes 26 pages of references, among them 14 written by Hansen himself.The article itself comprises more than 50 thousand words. For comparison, Science limits you to 4500 words per article and Energy and Environment gives you a generous 6000 words. Looking through his work I noticed sections that could have been individual articles themselves. He devotes much effort to justifying extreme events which I still find unconvincing. Will I read it? Not cover to cover but it will be useful for comparing this to other things he has said. I hope these monster articles do not become a trend.
RE: Turns out it will take about 26,000 years to reach that level.
Not sure there is enough supply of water to raise SL that much. Another notion to consider is the longer historical data set. Most of the rise that could have happened since the most recent glacial has already happened. The current rate of rise, on a grand scale, is asymptotic to zero. We are really in the tail end of a multi-thousand year rise. What goes up, must come down.
Well, this alarmist claptrap is getting an awful lot of attention in the MSM. Isn’t that all that really matters?
citation page 20115, line 18. “Figure 29 reveals an accelerating sea level rise, but it includes the effect of all processes affecting sea level and thus may understate the growth rate for ice sheet”
WRONG!
Hansen is carefully selecting the observation data that he likes to consider: in Figure 29 the graph curiously begins only in 1900.
Actually a compilation by Jevrejeva exists covering global mean sea level since 1750. When calculating the rate of rise (based on running average over 13 months) from this dataset and from the ones Hansen is also using, following picture is obtained:
http://bit.ly/1SQTpR1
For the Jevrejeva set the correlation coefficient R square is 0.0555, So, it is probable to the limit of certainty that no statistically significant acceleration has taken place over the pas two and half century. Te seas are slowly raising, but without acceleration, and this began well before the industrial era..
Error, omission, of outright lie?
We can dismiss the whole paper just on this basis; but there are more reasons.
To melt the amount of ice that is required to raise the global mean sea level by 5 to 9 m until the end of the century a lot of heat must be transferred from the atmosphere to the ice sheet. In the paper there is no discussion about the mechanism of this spectacular increase of the rate of heat transfer..
Incoherence or wilful omission?
it is possible that more ice will be lost by the Antarctic sheet, as it may have done during the late-Eemian age. But such possibility does not make it probable, and does not make it “near certain” until the end of this century.
Hansen is known for his exaggerations, this is one more.
The not yet peer reviewed paper is open to comments. I made one, with a few more points:
http://www.atmos-chem-phys-discuss.net/15/20059/2015/acpd-15-20059-2015-discussion.html,
look at SC C5401
and have a look at: http://wp.me/p4uV7N-E6