‘Warmest Year On Record’ Claims Falling Apart Under Scrutiny
The Nasa climate scientists who claimed 2014 set a new record for global warmth last night admitted they were only 38 per cent sure this was true. Yesterday it emerged that GISS’s analysis – based on readings from more than 3,000 measuring stations worldwide – is subject to a margin of error. Nasa admits this means it is far from certain that 2014 set a record at all. –David Rose, Mail on Sunday, 18 January 2015

Last week, according to our crackerjack mainstream media, NASA announced that 2014 was the hottest year, like, ever. No, really. The New York Times began its report with: “Last year was the hottest in earth’s recorded history.” Well, not really. As we’re about to see, this is a claim that dissolves on contact with actual science. But that didn’t stop the press from running with it. –Robert Tracinsk, The Federalist, 19 January 2015
Despite fears that global warming is harming the Arctic region faster than the rest of the world, Greenland is defying climate scientists and currently growing at its fastest rate in four years. The Danish Meteorological Institute reports that Greenland’s ice sheet has seen more growth so far this year than in the last four years. Greenland’s growth in 2015 is also higher than the mean growth for 1990 to 2011. –Michael Bastasch, The Daily Caller, 14 January 2015
What remains of the original description of this ‘warmest year on record’ news? Nothing but bluff, spin, and the uncritical press-release journalism that dominates mainstream reporting on the climate. It may or may not be the hottest year ever, but this is definitely in the running for the most dishonest year on record. –Robert Tracinsk, The Federalist, 19 January 2015
Regardless of which side of the man-made climate change debate you are on, one thing is clear: The claim that 2014 was the warmest year on record is shaky at best. —Inquisitr, 19 January 2015
If anybody is still in any doubt that it is UNSCIENTIFIC to make claims about hottest years, without taking into account error bars, I would advise what the World Meteorological Organisation had to say on the issue in their report on global temperatures for 2006: “All temperature values have uncertainties, which arise mainly from gaps in data coverage. The size of the uncertainties is such that the global average temperature for 2006 is statistically indistinguishable from, and could be anywhere between, the first and the eighth warmest year on record.” –Paul Homewood, Not A Lot of People Know That, 17 January 2015
Global temperatures will resume their long term growth trend within five to 10 years ending the so called pause in global warming, a leading climate scientist has predicted. The pause – which on some measures has gone on since the mid-1990s – continued into 2014 on the basis of global temperature data released last week by US space agency NASA and the National Oceanic and Atmospheric Administration (NOAA) of the US. However, the warming effect of greenhouse gases such as carbon dioxide will grow sufficiently to overcome the combined impact of various natural climate cooling factors, journalists on a telephone news conference were told last week by Gavin Schmidt, director of NASA’s Goddard Institute of Space Studies. —Reporting Climate Science, 19 January 2015
The temperature scales on the right and left sides of the graphic do not match. Is one of them for error bars, or is it just a misprint? It’s confusing as it is.
Looks like the media is catching on about the initial hyped and bad press release
NBC REPORTS
Not So Hot: 2014 Was Only 34th Warmest Year on Record for U.S.
collapse story
Turns out America’s weather in 2014 wasn’t really that bad. The National Oceanic and Atmospheric Administration announced Thursday that the U.S. average temperature last year was half a degree warmer than normal and weather was less disastrous and drought-struck than previous years. While 2014 was warmer than 2013 in the lower 48 states, it was still only the 34th warmest on record. That contrasts with the experience of the world as a whole. Globally, it will likely go down as the warmest year on record. Japan’s meteorological agency has already calculated 2014 as the warmest year worldwide. NOAA and NASA will announce global 2014 figures next week, but data through November point toward a new record.
The U.S. is only 2 percent of the world’s surface; eastern North America was about the only exception to the hot global rule last year and even that chill was outweighed nationally by record western heat, said NOAA climate scientist Jake Crouch. It was the 18th straight year the U.S. was warmer than the 20th-century average “This fits within the context of a long-term warming trend both here and around the globe,” Crouch said. California, Nevada and Arizona had the hottest year in 120 years of record-keeping, while Washington, Oregon, Idaho, Utah and New Mexico had one of their five warmest years on record. Arkansas, Illinois, Indiana, Louisiana, Wisconsin and Michigan had one of their 10 coldest years on record.
The statement,
“This fits within the context of a long-term warming trend both here and around the globe,” Crouch said is still misleading or plain wrong as the trend of US and Canadian annual temperatures has been declining for nearly two decades(17 years) or since 1998, North America which is cooling, not warming represents 16 % of global land areas
As other commenters have mentioned, the error bars in your graph seem… odd at best.
Perhaps this might be more useful, as it has error bars for each year correctly plotted:
http://i81.photobucket.com/albums/j237/hausfath/ScreenShot2015-01-20at73936AM_zps5dc52258.png
Why does the Berkeley graph show 2014 to be roughly 1/2 degree warmer that 1934?
Because globally 2014 is roughly 1/2 degree warmer than 1934? 1934 was a particularly warm year in the U.S., but not for the globe: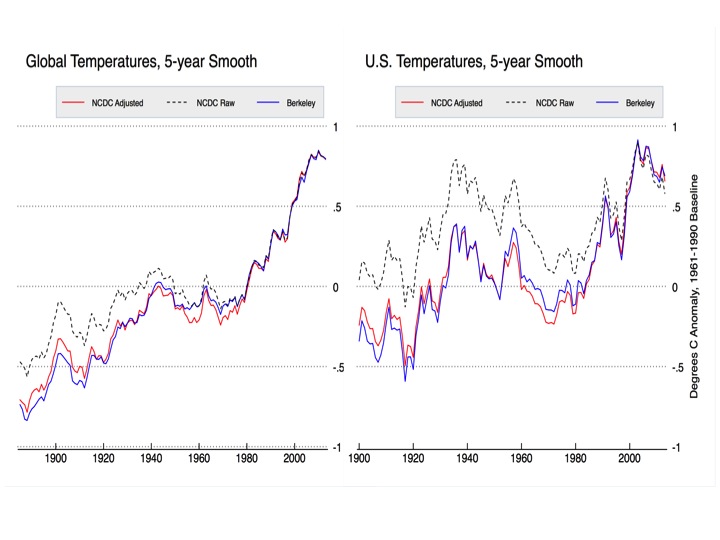
Zeke, the topic is obviously a hot one!
Would it be easy to ‘blow up’ the last few results so we can all play with the rankings of the last 20 or so years, with error bars.
Here you go:
http://i81.photobucket.com/albums/j237/hausfath/ScreenShot2015-01-20at75839AM_zps152e8ef0.png
Note that using a method similar to the one outlined in this paper will serve you much better than “eyeballing”: http://onlinelibrary.wiley.com/doi/10.1002/2013GL057999/abstract
Come on, Zeke. Have you looked at Anth*ny’s surface station classification? Certainly sea-surface measurements are similar or worse.
The “error bars” you show aren’t nearly large enough — they’re fiction.
Please note the anomaly base period!
Zeke,
Thanx for that chart. I noticed that the last 10 – 15 years is flat.
How do you explain that global warming has stopped? Does that not make you question your ‘man-made global warming’ premise?
Or will you invent some ‘reason’ why that particular data should be disregarded?
Also, BEST is not above cherry-picking:
http://wattsupwiththat.files.wordpress.com/2011/10/article-2055191-0e974b4300000578-216_468x4731.jpg
Good point dbstealey. For land temperatures 2014 is not the warmest year. Must because og all all those manipulated station data.
Short term trends in long term noisy data are not immensely meaningful. I’d argue that recent years are pretty consistent with the prior trend:
http://www.yaleclimateconnections.org/pics/0115_ZH_Fig4.png
As far as Berkeley data goes, the top chart shows annual averages and the bottom one shows monthly anomalies (albeit quite dated now). What exactly is being cherry-picked?
Zeke axs:
What exactly is being cherry-picked?
It is not blindingly obvious to you?? The bottom chart is a continuation of the upper chart. They deliberately deleted the last decade of data because it shows that global warming has stopped.
dbstealy,
Its “blindingly obvious” that the top chart shows annual values and the bottom monthly; both cover the same time scale (save for the few months into 2010 shown in the bottom, which can’t be turned into an annual value yet).
@Zeke “Because globally 2014 is roughly 1/2 degree warmer than 1934?” I highly doubt the accuracy of Global temperature estimates of the 30’s . The temperature measurement technology of that era would at BEST give you error bars of 2 degrees F. I imagine the infilling algorithm to cover global areas and sea surface temperatures for the 30’s is a miracle to behold.
Oddly enough, temperatures in the 1930s were measured quite similar to the way they are still measured in many places today: http://en.wikipedia.org/wiki/Six%27s_thermometer
The oceans are a bit more problematic, since you have the while buckets to intake transition, but I’m less familiar with that area so I’d suggest reading some of Kennedy’s work to see how estimated errors are calculated.
@Zeke “Oddly enough, temperatures in the 1930s were measured quite similar to the way they are still measured in many places today”
Globally I don’t thinks so !!
Oooh, that’s a pretty graph. Is it a work of fiction?
How many thermometers were used for each year, and where were they?
And if it’s a different number of thermometers, and if the thermometers are in different places, why would you imagine the annual averages are comparable?
Check this graph:
All curves are parallel up to 2000
Satellite and sea temperature are nearly parallel after 2001
Why is GISSTEMP going up, whereas sea and satellite data are going down? Why has 1998 with the big El Nino shrunken to a dwarf?
http://www.woodfortrees.org/graph/gistemp/from:1979/mean:12/plot/gistemp/from:1979/to:2001/trend/plot/gistemp/from:2001/trend/plot/rss/mean:12/plot/rss/to:2001/trend/plot/rss/from:2001/trend/plot/hadsst2gl/from:1979/mean:12/plot/hadsst2gl/from:2001/trend/plot/none
You just need to put all the data into a computer using the right parameters. That is what they do and even confess on their website.
Otherwise 1998 would have been the hottest year evah.
Here are the changes GISS made just since 2009
http://oi57.tinypic.com/2r38h9v.jpg
Interesting. Lowering the most recent adjustments compared to the previous decade. Result of that is lower trend the latest decade.
GISS is very clearly an outlier. HADCRUT also shows declining temps.
GISS. No contest.
Oh really. Trends close. Thanks for showing that.
Sometime perhaps Bart will discover base periods.
rooter,
Johannes H posted a chart showing the GISS divergence.
You keep arguing ‘divergence’, but they all diverge from each other; GISS most of all.
You need to find a different argument. “Divergence” doesn’t work.
dbstealey:
Try the other surface indexes. Then compare. Of course the lower troposphere will have greater differences during ninjas and ninjos than surface indexes.
And why is it necessary to have updated gistemp and not updated sea surface?
I know. Hide the incline.
And why ignore UAH?
http://www.woodfortrees.org/graph/gistemp/from:1979/mean:12/plot/gistemp/from:1979/to:2001/trend/plot/gistemp/from:2001/trend/plot/rss/mean:12/plot/rss/to:2001/trend/plot/rss/from:2001/trend/plot/hadsst3gl/from:1979/mean:12/plot/hadsst3gl/from:2001/trend/plot/uah/mean:12/plot/uah/from:2001/trend
I know. Hide the outlier. Can dbstealey pick the outlier?
rooter says:
Try the other surface indexes.
No, thanks, rooter. All you are doing is cherry-picking.
GISS does not agree with the other databases. But you are trying to argue that it doesn’t matter — that the only thing that does matter is what you cherry-pick.
That doesn’t work here. Maybe Hotwhopper would be interested.
dbstealey think it is a cherry pick to include SST up to present. And to include UAH. That was what I did.
http://www.woodfortrees.org/graph/gistemp/from:1979/mean:12/plot/gistemp/from:1979/to:2001/trend/plot/gistemp/from:2001/trend/plot/rss/mean:12/plot/rss/to:2001/trend/plot/rss/from:2001/trend/plot/hadsst3gl/from:1979/mean:12/plot/hadsst3gl/from:2001/trend/plot/uah/mean:12/plot/uah/from:2001/trend
Unlike what Johannes H and dbstealey did.
http://www.woodfortrees.org/graph/gistemp/from:1979/mean:12/plot/gistemp/from:1979/to:2001/trend/plot/gistemp/from:2001/trend/plot/rss/mean:12/plot/rss/to:2001/trend/plot/rss/from:2001/trend/plot/hadsst2gl/from:1979/mean:12/plot/hadsst2gl/from:2001/trend/plot/none
Some strange definition of cherrypicking for dbstealey there.
Any particular reason for not including ocean temperatures for 2014?
Hide the incline?
Any particular reason to ignore satellite data in determining temperature status for 2014? Hide the decline?
Rooter:
SST is determined by insolation. CO2 has nothing to do with SST. I’ve explained that to you several times already.
Where is the decline mpainter? Which series do you ignore?
http://www.woodfortrees.org/graph/gistemp/from:1999/offset:-0.35/compress:12/plot/rss/from:1999/offset:-0.10/compress:12/plot/uah/from:1999/compress:12/plot/gistemp/from:1999/offset:-0.35/trend/plot/rss/from:1999/offset:-0.10/trend/plot/uah/from:1999/trend
Rooter:
SST is determined by insolation, not by CO2. Water is opaque to IR rooter.
There is no such thing as “the best methodology for infilling”. Infilling is infilling, and it matters not how you do it, it is still fabrication. If you say one method yields better results, how do you confirm such an assertion? By fabricating some standard of reference?
But this kind of viewpoint is like Greek to you, is it not, rooter?
If I did that (infilling) as a mining engineer, I’d be fired.
On second thought, I’d quit a company before they had a chance to fire me for suggesting such an approach.
It’s that bad.
So far I have looked at 3 press releases of warmest year on record for 2014 and the three data set had the record set by .02, .04 and .08 C. Hardly anyone in the MSM bothers with this part of it. Hundredths of degrees dont boost viewership or sell newspapers. Expect these omissions any time records are broken in the future.
Here is what CBC reported about 2014 in CANADA
HOTTEST YEAR ON GLOBAL RECORD WAS CANADA’S COOLEST YEAR IN 18 YEARS.
Last year broke another global heat record, becoming the hottest since 1880. But did it feel that way to you? Probably not, since it was Canada’s coolest in 18 years.
NASA and the U.S. National Oceanic and Atmospheric Administration (NOAA) announced today that last year broke the global temperature record for the third time in a decade.
■ 2014 was the hottest year in modern record
Dave Phillips, senior climatologist with Environment Canada, acknowledges. Some of us might be surprised.
“I think most Canadians are going to say, ‘Huh?’ We weren’t that warm!”
NOAA reported many corners of the Earth experienced record heat last year, including most of Europe, the western U.S., part of interior South America and swaths of the Pacific, Atlantic and Indian oceans.
But in Canada, it was our coolest year since 1996, Phillips said.
“38% sure” means they polled the guys at work and only 3 of the 8 said ‘Yeah” while the other 5 said “No way.”
Sadly, that is probably not a joke.
So if not 2014, what is the warmest year in the record?
Well, looking at the error bars and the results of homogenization there is not an answer to the question. That is further confirmed by the two satellite records. There is a “pause” though and it would appear to have lasted for at least 15 years. It is anyone’s guess what will happen in the future.
Anyone predicting temperatures say 10 years ahead with influence on policy should be required to deposit $100,000 of their own money to be forfeited if the actual results are outside the error bars of the prediction. Members of teams collating official graphs should be banned from having a view on AGW or CAGW to ensure neutrality when collating and publishing information. Individuals such as Hansen and Now Gavin Schmidt should have no influence on temperature records, with them having pronounced clear beliefs on AGW/CAGW.
Gavin Schmidt now says that the pause that never existed will be over within 10 years.
http://www.reportingclimatescience.com/news-stories/article/pause-over-within-10-years-says-nasas-schmidt.html
They forget the hotter it is, the quicker it cools down.
Who knows?
62% chance it could be anything.
That’s the real news story.
That and that both NASA and NOAA over-stated the limits of their knowledge.
1998, according to the more reliable satellite data. And why is it more reliable? There are several reasons:
1. No UHE to distort the data.
2. No data tampering by biased AGW types.
3. No data fabrication, aka infilling, by AGW bias.
One might wonder why the most reliable data sets are the ones that diverges most.
http://www.woodfortrees.org/graph/rss/mean:12/offset:-0.10/plot/uah/mean:12/plot/rss/to:1997/offset:-0.1/trend/plot/uah/to:1997/trend/plot/rss/from:1997/offset:-0.1/trend/plot/uah/from:1997/trend
Some special kind of reliability. No wonder Mears of RSS says:
“A similar, but stronger case can be made using surface temperature datasets, which I consider to be more reliable than satellite datasets (they certainly agree with each other better than the various satellite datasets do!).”
The lower tropospheric temperature sets are the ones that get the most adjustments too.
Mears, of course, goes out of his way to chant the party mantra, using such terms as “denialist” to keep in good stead with the brethren . His RSS is lower than the UAH. Strange that he does not ” adjust” his data to an instrument data set. Wonder what he really thinks.
Christie and Spencer have different ideas about the value of Satellite data.
Why don’t you quote them?
Do mpainter trust UAH more than RSS? Not for long I guess:
http://woodfortrees.org/graph/uah/from:2000/mean:12/plot/rss/from:2000/offset:-0.10/mean:12/plot/uah/from:2000/trend/plot/rss/from:2000/offset:-0.10/trend
Either, rooter, see above. Your cohorts in the global warming business have made a foul stench of data (invented, adjusted, or otherwise tampered with) from surface instruments. Your avocation is to foist that on the gullible.But you have come to tthe wrong place.Take it to the dupes at SKS.
And the real question is why do the warmers at NOAA and NASA ignore satellite data? If that data were taken into account, no AGW hype. The public is entitled to better than what we are getting, but we are fed a bunch of kawrap.
Rooter sees no problems here.
mpainter thinks satellite data is ignored. mpainter might some day learn that the lower atmosphere is not the same as the surface. But take comfort mpainter. There are also satellite data used for surface temperatures as well. One is a favourite of your friend Bob Tisdale; Oiv2 ocean temperature.
Guess which year is warmest in that series mpainter.
And the answer, of course, is that the satellite data can’t be ” fixed” for AGW propaganda hype.
That is why I like satellite data and rooter hates it.
Holocene optimum followed by Minoan warm period then Roman warm period. Thousands of years warmer than today in our little inter-glacial. If you look at the last 5-6k years you’ll see we are cooling, not warming.
http://en.wikipedia.org/wiki/File:Holocene_Temperature_Variations.png
Uptick at the end means cooling?
2014 could be anywhere between 1st and 14th warmest.
That’s as close you are going to get, even assuming there is such a thing as an “global temperature”
“So if not 2014, what is the warmest year in the record?”
=====================================
AD 50
http://link.springer.com/article/10.1007%2Fs11434-014-0317-3
Nick Stokes:
Satellite data–which alone has truly global coverage with uniform measurement methods and is immune to UHI–shows the highest annual anomalies since 1979 occurred in 1998 and 2010 All of the other indices are more products of ad hoc manufacture with various built-in biases than of reliable measurement.
Manufacture? Here is Roy Spencer describing part of what goes into a satellite measure:
Nick Stokes:
Accounting for the response characteristics and precise positioning of instrumentation is part and parcel of all proper in situ measurement programs. In no way is this comparable to the manufacture of data where no measurements have been taken or the substitution of one measured variable (daily mean land air temperature) with another (instantaneous SST observations) whose sampling method varies, is exceedingly uneven geographically, and no credible, alias-free time-series can be obtained. Mere number-crunching ability does not sound science make.
Moderator:
Where did my response to Nick Stokes disappear?
Moderator:
Why did it take 20 minutes for my comment to post?
[Life happens. It takes a while to read every comment. Yours was not at the top of the list. .mod]
At 1/100th of a degree with error bars of over 1 to 2 degrees who cares.
Only the grifters
Nick Stokes asks, “So if not 2014, what is the warmest year in the record?”
==========================================================
Overall atmospheric T of the planet. https://stevengoddard.wordpress.com/2014/09/18/us-government-agencies-just-cant-stop-lying/
Above average global sea ice, near record NH snow coverage, very cool US, ten year high in Arctic Sea Ice
all support the linked RSS charts.
Almost 1/2 of the worlds land data in-filled, often from warm oceans is a gross distortion. Record infilling of data makes the warmest claim useless.
Here is why infilling from the oceans is so bad… ?w=640
NASA states that the average global surface air temperature between 1951 and 1980 is 14°C, “with an uncertainty of several tenths of a degree”,
http://earthobservatory.nasa.gov/Features/WorldOfChange/decadaltemp.php
This is a bit vague. Several might be anywhere between three and nine. Fortunately NASA also clears thing up a bit, when it tells us that, “For the global mean*, the most trusted models produce a value of roughly 14°C, i.e. 57.2°F, but it may easily be anywhere between 56 and 58°F”.
http://data.giss.nasa.gov/gistemp/abs_temp.html
*This is the global mean from 1951 to 1980, as confirmed by email from NASA. We now have a handle on the meaning of “several”.
Correct to 1dp.
58°F = 14.4°C
56°F = 13.3°C
(14.4+13.3)/2 = 13.9, which is “roughly” 14.
(14.4-13.3)/2 = 0.6
That is to say, on the basis of NASA’s own figures, the global mean for 1951 to 1980 is 13.9(+/-0.6)°C. The cash value of this is, that all of NASA’s estimates of annual mean global surface temperatures come with an uncertainty of +/-(not less than 0.6)°C. NASA publishes its estimates of mean global surface temperatures in the form of anomalies, such that if +X°C is the annual global surface temperature anomaly for year Y, then the mean global surface surface temperature for Y is X°C above the 1951 to 1980 mean global surface temperature of (13.9(+/-0.6))°C. On the basis of the January 2014 edition of NASA’s Global Land-Ocean Temperature Index:-
http://global-land-ocean-temperature-index.blogspot.co.uk/2015/01/the-january-2015-edition-of-gloti.html
the year 1909 alone has the lowest annual global surface temperature anomaly of -0.47°C, and the year 2014 alone has the highest annual global surface temperature anomaly of +0.68°C. Hence on a niggardly small amount of uncertainty of +/-0.6°C, the annual mean global surface temperature for 1909 could be as high as 14.03°C, the annual mean global surface temperature for 2014 could as low as 13.98°C, and all the others years between 1880 could have a mean global surface temperature of somewhere in between 14.03°C and 13.98°C. On this basis, the global warming pause could have lasted all the way from 1880 to 2014. But that’s not the end of the story. According to the May 2008 edition of NASA’s Global Land-Ocean Temperature Index:-
http://global-land-ocean-temperature-index.blogspot.co.uk/2014/05/the-may-2008-edition-of-gloti.html
the annual global surface temperature anomaly for 1909 is -0.35°C. You might very well wonder how it is possible for the mean global surface temperature of the earth in the year 1909 to decline 0.12°C between May 2008 and January 2014. What is the cash value of this? That the annual global surface temperature anomaly for any year from 1880 to the present is such an elusive item, that nobody knows what it is in reality.
“That is to say, on the basis of NASA’s own figures, the global mean for 1951 to 1980 is 13.9(+/-0.6)°C.”
They aren’t NASA’s own figures. They say clearly that they are model results.
They also say very clearly in your link why you shouldn’t do this:
They work out the anomaly. If you want to pick a climatology to add, you’re on your own.
Nick Stokes says:
They say clearly that they are model results.
Stop. There’s your problem, right there…
“There’s your problem, right there”
It’s not my problem. These are the numbers Nick R are attributing to NASA and trying to find a discrepancy.
Putting satellites up there was an expensive endeavour especially if you favour infilled ground temps over the lovely new tech.
What does RSS and UAH say?
Items of note about the 2014 record temperature that I have noted from various comments. .
Satellite records show 2014 temperature is not a record but only the 3rd
Temperature analysis is subject to a margin of error which is greater than the warming , Hence we cannot be certain it is a record at all.
According to NASA, 2014 Annual temperature has only 38% probability of being the warmest year
. According to NOAA , the probability is only 48%
Increase is only few hundreds of a degree, very minor. No statistical difference from previous years
Northern hemisphere temperature was far from being record year. Temperatures were actually cooling
Canadian temperatures declining for 17 years including annual, winter and spring
US temperatures are declining for 17 years including annual, winter, spring and fall
Southern hemisphere oceans are not warming
Global winters are cooling since 1998
Northern hemisphere winters are cooling 1995
Northern Atlantic AMO is declining since 2003 indicating a cooling is taking place in North Atlantic
Southern oceans are cooling
2014 Warming maybe due to near NINO conditions in equatorial Pacific and North West Pacific, No proof that manmade greenhouse gas had anything to do with this warming. Could be just an ocean cycle ?
I see little justification for the NOAA/NASA initial hyped press release without a more balanced and complete report .
Where is the the warming occurring? My guess it is in places where there are few thermometers and lots of infilling. Anyone know?
Rooter; why the desperation over.02 degrees higher then last year??
Don’t know. Baffles me. “2014: The Most Dishonest Year on Record.”
Zeke,
If Berkeley is right and 2014 is roughly 1/2 degree warmer than 1934 what happened to the dispute between 1998 and 1934 being the hottest year?
Did warming since 1998 make the dispute vanish? If that’s the case there’s been no pause or hiatus.
For crying out loud, the 1934 v 1998 dispute was about US Temperatures ONLY. I know you like to think that the USA is the centre of the universe but it only actually covers ~2% of the earth’s surface.
Yes, but the debate should still be remembered as it is relevant.
The same organisation who over-stated their knowledge of the global temperature this year “adjusted” the 1930s US temperature too.
It seems reasonable to suspect that the reason behind both curiosities is the same.
The 2% is a meaningless number, because two thirds of the globe is covered by oceans, of which there weren’t temperature records (of any meaning) in 1934. The relevant number would the the amount of area covered by US stations vs. the amount of global temperature data coverage at the time.
Of course the data has all been adjusted, several times in fact, so were not talking about real numbers anyway.
But John, the US is the center of the universe.
(According to some ideas in astrophysics, so is any other point in the universe.)
Don’t know. If single tree in Siberia can reflect global temperatures of the world for hundreds of years, why can’t temperature of whole continent not have same effect?
/sarc
I ought to have added that Zeke’s already explained about 1934/1998 issue.
The real issue is the unreliability of the surface data sets and the spurious temperatures that result from data tampering. The 2014 “record” high is phoney but serves the CAGW propaganda mill very well and of course, that was the purpose of the data tampering. See Nick Stokes and others pretend that there was no data tampering.
Two things: first, the effect of adjustments for station moves, instrument changes, etc. is relatively small in the global temperature record. Second, independent groups like Berkeley who start with raw data and have their own completely different way of detecting breakpoints and inhomogeneities get nearly identical results. See this post at Judith’s blog for details: http://judithcurry.com/2014/07/07/understanding-adjustments-to-temperature-data/
One thing:
The data sets are in the hands of the global warmers, a much discredited bunch of pseudo-scientists. Their data manipulations are well documented. See Steve Goddard and elsewhere, including this blog.
Satellite temperature data is more reliable, thank you.
Zeke,
Just the fact that people are arguing about a couple of tenths or hundreths of a degree shows that the alarmist clique is trying to sell the world a bill of goods.
If global warming was a problem, there wouldn’t be any arguing about it. The arguments would be about what should be done.
Instead, the alarmist cult is counting angels on a pinhead. Nobody believes their narrative any more. You shouldn’t, either. You only argue MMGW because it pays the bills.
Who is Zeke. Before political motivation the NH T looked like this… ?w=640
But with massive lowering of the past, and warming of the present vs raw, everything changed . Thus I do believe in Mann made climate change.
Here is the mean of RSS and UAH vs the climate models…
http://wattsupwiththat.files.wordpress.com/2015/01/clip_image004_thumb.png?w=605&h=277
They need to ramp up, and double down on the dishonesty, in order to prepare for the big UNFCC Liars’ Talk-Fest in Paris this November. You ain’t seen nothin’ yet.
As I have said the only data that is reliable is satellite data . Their data is meaningless.
As I have also said once solar parameters approach my low value averages I expect global temperature averages will turn down 6 months after those low value solar averages are reached due to primary and secondary solar effects.
Thus far solar activity continues much above the values I think are required to accomplish this. Example solar flux has been running around 150 much above the sub 90 level I call for.
That said sub solar activity in general has been occurring for a good 10 years and this time around when solar parameters decline toward my low solar value averages they should be able to exert an influence on the climate through primary/secondary means.
It could begin this year as I expect the maximum of solar cycle 24 to FINALLY end.
Then I will know how correct or wrong I might be because my theory unlike others has SPECIFIC solar parameters which if reached will cause the climate to move in an x direction.
Easily verified or falsified and direct and to the point.
Please clarify a few things:
What solar parameters do you consider the primary and what do you consider secondary influence (I assume on temperature) and why do you expect a 6 month delay in the secondary temperature influence?
What do you consider an “x direction” for climate?
Which specific solar parameters are you following that, if reached, will cause that movement (a lowering a global average temperatures, right)?
The 2014 record global annual temperature is mostly a NORTH PACIFIC record SST event .
2014 was not a record year for global land area annual temperatures . it was 4th only
Thanks, Anthony. Good article.
We live and are part of nature, our global effects on it are very difficult to observe. We should concentrate on mitigating our local effects, when detrimental.
There are no good reasons to make public policy based on predicted anthropogenic warming,
I look at the past, as recorded, to find a warming off some 1°C since 1910.
I’m thankful for it.
Are the unadjusted temperature data available? Surely someone has plotted these data.
For land data:
ftp://ftp.ncdc.noaa.gov/pub/data/globaldatabank/monthly/stage3/recommended/plots/merged_anomaly.gif
Both unadjusted.
See UAH and RSS, both unadjusted.
mpainter: So you think UAH and RSS are unadjusted.
That must be a joke. RSS even uses a climate model to adjust for diurnal drift.
mpainter, why don’t you ask for the “raw unadjusted” data the receive from the satellites? Coul be fun.
Don’t tell mpainter that the satellites are not measuring surface temps. They are measuring the microwave “brightness” of the first 3 km of air.
Either way, they are much more reliable than any ground based system(s).
Don’t tell Socrats that thermometers are not measuring surface temperatures; they measure the height of a column of mercury (or alcohol).
Don’t have any reason to suspect the integrity of those who provide the satellite data.
However, there are plenty of reasons to suspect the honesty of persons like Schmidt, the NOAA crew, the CRU crooks, et all.
So rooter, some deal in trustworthy science, some turn out crap and crank it through a propaganda mill and then shrug their shoulders when it catches up with them. Your heroes, rooter.
Mr Mpainter
At least the thermometers on the ground measure the surface temperature, and not a 3 km thick column of air
..
PS, you’d better have some suspicion over satellite data……the neither of them agree with the other, Especially since both use mostly the same raw data.
David S, and with global brightening satellites should be reading ‘too hot’?
Sockrats:
See above
Both rooter and scooter seem to think that UAH and RSS are the only temperature data bases that do not agree exactly.
But in fact, every database is unique. They are all different from one another.
And GISS is the outliar of the whole bunch.
LMAO GISS is the outlier…..
..
http://www.woodfortrees.org/graph/gistemp/from:1979/offset:-0.35/compress:12/plot/hadcrut4gl/from:1979/offset:-0.26/compress:12/plot/rss/compress:12/offset:-0.10/plot/uah/compress:12/plot/gistemp/from:1998/offset:-0.35/trend/plot/hadcrut4gl/from:1998/offset:-0.26/trend/plot/rss/from:1998/offset:-0.10/trend/plot/uah/from:1998/trend
Isn’t ‘Socksrates’ cute? Always cherry-picking his factoids to deflect the conversation to where he would like it to go.
Face it: Planet Earth says you’re wrong.
Who should we believe? You? Or the planet?
Because one of you is flat wrong.
Planet earth is on my side. Lots of meteorological agencies are on our side too.
…
What have you got?
My, my. Look at all those ^assertions^.
Honest scientists. Makes a big difference, but I suppose that you don’t know that.
Come on dbstealey, don’t you have a chart in your enormous collection that shows GISS is an outlier?
…
Guess you better find one if you don’t have one.
PS….
..
“And GISS is the outliar of the whole bunch.”
..
Qualifies as an “assertion”
Sox sez:
…don’t you have a chart in your enormous collection that shows GISS is an outlier?
How many times do you have to be debunked before you go away?
Sockrates lost the debate a LONG time ago. Now he’s just backing and filling. But his endless tap-dancing is wasted here, because we know better.
Now, before socks goes into his endless “But what about…” routine, I would like to point out that contrary to his beliefs, I posted a chart directly refuting him. Therefore, he lost this particular argument.
Next, socks says:
Planet earth is on my side.
What a dope. The planet doesn’t tkae sides, only people do that. Planet Earth is simply not corroborrating the alarmist Narrative, and as hard as he tries, sockrates fails again. The planet is simply not doing what was incessantly predicted by socks’s alarmist clique.
The alarmist cult was flat wrong, therefore socksrates has lost the argument and the debate. Now all he’s doing is his usual climbdown; tap-dancing around the fact that thew planet itself is busy debunking his True Belief.
And rooter, give it up. You’re fighting a losing battle here.
– These 2 by statements by Gavin Schmidt just defy reality. Wishful thinking on his part.
“Global temperatures will resume their long term growth trend within five to 10 years ending the so called pause in global warming, a leading climate scientist has predicted.
“However, the warming effect of greenhouse gases such as carbon dioxide will grow sufficiently to overcome the combined impact of various natural climate cooling factors”
A question I like to ask everyone who thinks that CO2 controls the climate. How long with rising CO2 and flat or falling temperatures before you admit your theory is wrong? 20 years? 30? Never?
All 5 of the major datasets (RSS, UAH, HadCRUT4, GISS, NCDC) show no warming for between 14 and 18+ years. In that time CO2 has risen 8-10%.
So Dr Schmidt, how long? You say temps will resume in 5-10 years. That would make the RSS data show 23-28 years of cooling. Will you then admit that the idea of CO2 controlling the climate is wrong? Or will you push it out further and further.
Will it take a full blown resumption of advancing glaciers to convince you that you are wrong?
CO2 has risen over 30% if you use the 1700 base, in that period.
Of course, the real dishonesty behind the “hottest year evah” meme lies in the fact that it is a political statement, not a scientific one. It is a red herring, meant to distract, not inform. They need to distract from the ever-lenthening Halt in warming, which basically blows all their precious GCMs out of the water.
I notice that the reported temperatures are mostly near the top of the error bar, making the most probable temperature lower than the reported value.
Why would the reported value influence the probability of the true or actual error? That makes no sense. Since you are splitting hairs, I will split your split so to speak.
Now sorted.
Thanks
Open Dishonesty!! It’s all mental trick. NASA has a 38% belief in it being the hottest year on record also means NASA has a 62% belief in it not being the hottest year on record. It depend on what you are selling.
How should the GISS/NOAA annual temperatures and probabilities be interpreted?
How about this?
Let’s imagine that it has become possible to determine the mean global SURFACE temperature for each year EXACTLY. Now let’s also imagine that some bookie has decided to open a book so that punters can have a bet on which year will turn out to be the warmest. The bookie is glad of all the publicity so isn’t bothered about the profit margin on this particular event so his odds reflect the true likelihood that any particular year will win.
So what prices would the bookie quote? That would depend on which temperature record he trusted most.
If he went for GISS the odds would be (roughly)
2014 6/4 Fav
2010 7/2
2005 5/1
1998 24/1
If he went for NOAA
2014 EVENS Fav
2010 4/1
2005 13/2
1998 19/1
So, while 2014 is not a certainty, it would still be be a clear (I won’t say ‘hot’) favourite. I’m not sure I’d bet against it.
That makes no sense. If GISS were able to determine exactly what the average global temperature was for any calendar year then you would not need statistical odds and probabilities because there would be no error.
Oh, FFS.
I’ve given the relative odds for each year being the warmest. 2014 is the favourite.
Is that clear enough for you.