Guest Post by Bob Tisdale
AUSTRALIA’S BOM UPGRADES ENSO TRACKER STATUS TO EL NIÑO ALERT
On November 18, Australia’s Bureau of Meteorology (BOM) upgraded the conditions in the tropical Pacific from El Niño “watch” to “alert” levels, “indicating at least a 70% chance of El Niño occurring”. See the rest of their update here.
NOAA’S WEEKLY NINO3.4 DATA
The sea surface temperature anomalies of the NINO3.4 region of the equatorial Pacific are a commonly used ENSO index. NOAA’s Oceanic NINO Index is a form of the data of that region. According to NOAA’s weekly sea surface temperature data for the NINO3.4 region, as of the week centered on November 12th, El Niño conditions (+0.5 deg C or greater) have existed in the NINO3.4 region for 5 weeks and they are presently well above the threshold, now at 0.8 deg C for two weeks. This is still a far cry from the NOAA requirements to declare an “official” El Niño has taken place (5 consecutive periods of 3-month averages with NINO3.4 anomalies equal to or above the +0.5 deg C threshold). But it’s a start.
BE CAREFUL HOW YOU INTERPRET ANOMALIES ON MAPS
Over the past month or so, the unusual warming of the eastern extratropical North Pacific (known as “the blob”) has dissipated. Whether or not it will return next year is still uncertain. But as a result of the blob, there was a large volume of warm water on the surface in the northeastern North Pacific, and presently there are residuals (leftovers) that are now hugging the west coast of North America. See the map of sea surface temperature anomalies in Figure 1. It’s from the CMC Environment Canada webpage here.

Figure 1
Some of that warm water along the North American coast, according to the recent interviews with Trenberth and Timmermann, came from a coastally trapped Kelvin wave that formed after the large downwelling equatorial Kelvin wave hit the coast of Ecuador back in April 2014. Also see the discussion of coastally trapped Kelvin waves in the post Axel Timmermann and Kevin Trenberth Highlight the Importance of Natural Variability in Global Warming… And some of the warm is left over from the blob.
That raises a few questions: is that warm water feeding back down to the tropics? If so, will it enhance the El Niño conditions in the tropics?
If we look at animations of sea surface temperature anomaly maps, it APPEARS that, yes, the warmer waters along the west coast of North America might be migrating southward along the California Current.
Animation 1 presents the 6 cells from the maps available as part of today’s animation from the CMC Environment Canada webpage here. That animation runs early October to today. The visual effect shows up pretty well on those maps. [Note: It could also be that the warming sea surfaces along the equator are creating a more typical El Niño spatial pattern.]

Animation 1
But in Animation 2 the visual effect isn’t as clear. Animation 2 shows 10 of the weekly cells of the animation here from the NOAA PSD Map Room webpage. They run from mid-September to mid-November.

Animation 2
Unfortunately, there is a large seasonal component to hemispheric sea surface temperature anomaly data, especially in the Northern Hemisphere. As a result, on sea surface temperature anomaly maps, the warmest anomalies can cycle yearly, tracking the change of seasons. Some of the seasonal appearance (not the blob) results from the seasonal loss and gain of Arctic sea ice, but there can still be large seasonal cycles in small regions…such as along the west coast of North America, where the California Current exists. See Figure 2.

Figure 2
That brings us to the questions: is the appearance of warm water migrating southward simply a product of the climatology used to determine the anomalies? Or is the warmer water actually heading south along the coast of North America as one might expect in the California Current?
Well, there’s something else to keep an eye on.
Discover more from Watts Up With That?
Subscribe to get the latest posts sent to your email.
Hi Bob, thanks for the aminations.
The standard base period being used is not helpful unless you want to shout about ‘unprecedented’ anomalies in Aug/Sept.
What would be more help in seeing what is happenning is to use, say, the post 1998 period as the base for annual cycle. That way there would be less annual residual in the recent data and that, after all, is the real point of anamalies.
I seem to recall that you have produced maps using KNMI in the past. They let you define the anomaly period ( assuming you’re not already looking at an anomaly dataset ).
Could you use that create your own maps and then map animations with a more appropriate base period?
[Please use a legitimate email address. ~mod.]
Greg, maps of monthly sea surface temperatures and anomalies can be created at the KNMI Climate Explorer. Monthly maps would serve little purpose in this discussion. If you’d like to verify that, here’s a link:
http://climexp.knmi.nl/selectfield_obs.cgi?someone@somewhere
Cheers
Is it possible that the warm waters could be driven to the West Pacific and kick off a La Niña or does the whole system have to trend neutral and a fresh warm pool develop?
What is happening to the trade winds presently?
Normal conditions or a La Niña cause upwelling of cold water in the East Pacific but in the El Niño phase do we get colder water upwelling in the West Pacific?
Farmer Gez, normally, according to the delayed-oscillator theory of ENSO, the downwelling (warm) equatorial Kelvin wave at the start of this year should have spawned a pair of off-equatorial upwelling (cool) Rossby waves heading east to west. In theory, they reflect of the coasts of Asia and reform along the equator about 8 to 10 months later, creating an upwelling (cool) equatorial Kelvin wave to counteract the El Niño and initiate a La Niña.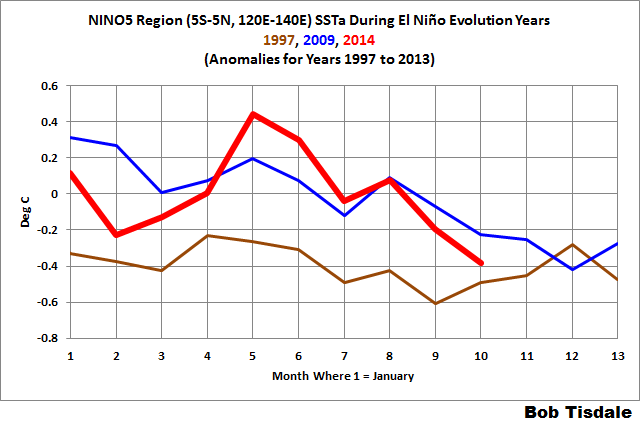
http://orca.rsmas.miami.edu/~melicie/dmodel1.htm
Unfortunately, this year has been far from normal. A minor upwelling (cool) Kelvin wave followed the strong (first) downwelling (warm) Kelvin wave this year, offsetting some of the impacts of earlier downwelling (warm) Kelvin wave. Then some of the warm water from the first downwelling recirculated back to the western tropical Pacific and reentered the subsurface Cromwell Current. It’s been making its way east for a couple of months. More recently, another round of warm water entered the Cromwell Current and has begun its subsurface march east.
Since nothing is normal this year, I haven’t the slightest idea what’ll happen next.
With respect to your last question, as a reference, the following graph shows the absolute temperature profile from west to east along the equatorial Pacific during December 1996 (the ENSO neutral year before the 1997/98 El Niño), during December 1997 (the peak of the 1997/98 El Niño, and a year later in December 1998 at the peak of the first year of the trailing La Niña. The sea surface temperatures in the western equatorial Pacific didn’t drop that much from the ENSO-neutral to the El Niño year, even during that super El Niño.
http://i46.tinypic.com/2h2h1e0.jpg
That is to say, there’s some cooling in the western equatorial Pacific, but it’s little by comparison to what’s going on in the east.
Back to this year. Let’s look at the NINO5 region (5S-5N, 120E-140E) sea surface temperature anomalies for 2014 and compare them to 2009 and 1997 as references. What stands out this year is the uptick in April and May and then the sharp decline.
This year has been full of surprises.
Cheers.
Thank you Bob for your detailed reply. As usual with weather the answers to simple questions are often complex.
Not sure I would trust anything coming from the BOM in Australia. They have been subject to various enquireies over the legitimasy of there reporting in recent years. Dodgy outfit?
It seems that this is a classic El Nino behavior: It is closing in on Christmas and an El Nino may form. Just like Joe Bastardi and Bob Tisdale have been saying.
Were Joe and I at odds regarding the 2014/15 El Nino, Peter? I don’t do forecasts. Joe does.
“indicating at least a 70% chance of El Niño occurring”
When I see a rain forecast a few days out for my area of 70% rain, I conclude that either one of two things will happen, it will rain, or it won’t rain. I imagine the same possible outcomes with El Nino.
Here are a few cross-sections which relate to the hotspot in the north Pacific, what is going on in the California Current and more about what is happening under the surface.
First, the cross-section of Pacific ocean temperatures from the GODAS model at the 140W longitude down to 1000M (going from the Gulf of Alaska to Antarctica, more-or-less the middle of the Nino 3.4 region going across the Pacific from north to south). This is just barely catching the side of the hotspot along the North American coast and side of the California current.
Generally, the warmth, the hotspot is only at the surface.
http://www.cpc.ncep.noaa.gov/products/GODAS/mnth_gif/yz/mnth.anom.yz.temp.140w.2014.10.gif
Then last summer when the north Pacific hotspot was at its max. This transect should be right in the middle of where the north Pacific hotspot was this summer. Surface only again.
http://www.cpc.ncep.noaa.gov/products/GODAS/mnth_gif/yz/mnth.anom.yz.temp.140w.2014.08.gif
Then the cross-section at 110W, Antarctica to mid-Mexico coast. Pretty good hotspot here at 15N. This is actually the California Current which bends and flows east to west at this latitude. It is need to fight its way through the Equatorial counter-current at 8N which flows east to west (the big blue cold spot) to make it into the ENSO circulation at the Equator. Or more accurately, it needs to be warm enough to warm up the Eq. counter-current at 8N. It might be big enough to do just that.
http://www.cpc.ncep.noaa.gov/products/GODAS/mnth_gif/yz/mnth.anom.yz.temp.110w.2014.10.gif
Sorry, the Equatorial counter-current at 8N flows WEST to EAST.
Forgot to mention all of the cold water in the southern hemisphere transect at 110W. This water has more chance to influence the ENSO equatorial current as it partially flows right in under the influence of the Humbolt Current along the South American coast
Latest animation of surface currents in the region from the high resolution US Navy Hycom model which helps explain a little of the above.
http://www7320.nrlssc.navy.mil/GLBhycom1-12/navo/equpacsst_nowcast_anim30d.gif
Bill
I’ve always considered SSTs to be a transient thing. All you need is a calm ocean surface for a few days undisturbed by currents or winds.
A bit OT- was just watching the morning news channels, and Gov. Cuomo was on, loudly proclaiming how the 7 feet of lake effect snow in Buffalo was all due to “Climate Change”.
I didn’t know whether to laugh or cry – wanted to do both.
Isn’t it amazing that he can say that with a straight face.
I didn’t think anyone was dumb enough to start down that road this early, and not wait for people’s misery to be over first.
If you watch this Australian ytube video I guarantee a laugh. Funny F**king weather man from Australia: http://youtu.be/ooaQoBSD52k
Just to explain, Chopper was a real life celebrity hit man. He claimed never to have killed anyone worthwhile. He said he was doing society a service by knocking them off. A macabre sense of humour.
Farmer Gez. The fellow in the video is not really Chopper Reid is he?
WWS — Try this fore dots one might connect:
Nina3.4 looks to be peaking around the new year – perfect for triggering a nice big La Nina for 2015.
With ENSO, and climate in general, what goes up must come down.
La Nina would be nice.
Were those warm water blobs responsible for the sharp down turn in sea ice extent that happened toward the end of October/early November. The trend line was headed right into the 1979-2000 1SD “grey area” and then took a sharp downward/rightward turn.
It looks more to me like this is an El Blobo. If the warm water from The Blob circulating down the CA coast into the tropics is replacing normally cold water that would be cooling the tropics. Without the influence of the colder water mixing into the tropics, it should warm a bit. So, instead of the latest energy surge coming from the PWP, it appears the energy (or lack of cooling in this case) is coming from The Blob. This appears visually in Bob’s animation as it looks like the warm water is moving from the East Pacific to the West Pacific with the normal trade winds.
Now for some wild speculation. We had the 1983 strong El Nino and a 1998 Super El Nino and then the appearance of The Blob in 2013. Notice how they are all 15 years apart. Now, go back to 1968 and 1953 and we also see El Nino conditions of a weaker nature (during a negative PDO). Am I seeing a pattern?
What if during a negative PDO we get a different mode of heating that eventually tracks into the tropics producing an El Nino of a slightly different flavor. Both are instigated by a Kelvin Wave but the strong El Nino events are reinforced by more Kelvin Waves while the El Blobo events are reinforced by warmer water flowing down the California current.
These El Blobo events of the past were fairly long duration which would indicate these conditions will persist through 2015. They were then followed by multi-year La Nina events. If this repeats, then next year will also be warm before the bottom falls out in 2016.
But where are the expected convection and rain on the equator? After all, we are well into the Mature Phase of a warm event.
Joe Bastardi has called for this way back in the spring and has not varied in his opinion. He is the ONLY one that has called this correctly.
Impressed with cold water south of the Aleutians. This is a huge change. Namias did
a lot of work on this back in the 70’s. In coordination with weak ENSO…Cold Winter for
the Eastern US?
The El Nino has not been very predictable ever since the super El Nino paid us a visit in 1998. What should have been an El Nino peak starting in 1999 stretched itself out into an irregular, horizontal platform that we now look upon as start of the hiatus. This stretched-out of warming extended for 7 years and then a regular La Nina appeared in 2008. It is a likely candidate for that coooling Trenberth complained about in the Climategate emails. That 2008 La Nina was the first sign that normal ENSO activity was starting up again . It was followed by the 2010 El Nino as expected. But after that the irregularity we had from 2001 to 2007 returned and must be explained. There was no proper La Nina after 2010 and when the time for the next El Nino came it too was somehow botched. They are of course right to look for it in Nino3.4 because that is a point in mid-Pacific where an El Nino must pass through to get to South America. Apparently there was an El Nino wave that did pass through but did not create the warming expected when it hit South America. It was even reported that it spread out along the coast north and south, just what an El Nino wave normally does.But normally it also warms the air above it which then rises, joins the westerlies, and brings us the warmth we expect from an El Nino. That last action is the only thing that is missing now. I am inclined to hold strong trade winds responsible for that. It would appear that the warm air which normally rises when the El Nino wave spreads out along the coast was captured by the extra strong trade winds and carried west instead of east. That robs us of an El Nino peak and the El Nino heat that should have warmed the globe will now warm the central Pacific instead.
I am still doing a rain dance. Hoping, hoping …
Bob — Do you have an opinion on the possibility that Nuri affected/reduced the “blob”? Thanks.
Hi Dave. Looking at the second of the animations, the blob was diffusing in October before Nuri arrived
The Blob is on the move. What will the alarmists make of this? Probably something like the original Blob:
http://quickhitflix.com/wp-content/uploads/2014/10/Blob-Town-The-Blob-1958-Documentary-@-Phoenixville-Pennsylvania-by-James-Rolfe.jpg
I am not looking forward to the 2015-2016 El Nino
http://tallbloke.wordpress.com/2014/11/15/evidence-that-strong-el-nino-events-are-triggered-by-the-moon/#comments
Also being discussed at More On Miriam O’Brien’s Hot Whopper
http://moreonmiriamobrien.wordpress.com/2014/11/21/miriam-obrien-says-deniers-are-weird-at-wuwt-enso-is-a-bom-conspiracy/
I do forecasts but it seems that no one is listening:
http://tallbloke.wordpress.com/2014/11/15/evidence-that-strong-el-nino-events-are-triggered-by-the-moon/#comments
Here is my ~ 9 year year cycle in each corresponding 31 year tidal epoch:
A. Full Moon Epochs
1st FULL MOON EPOCH [1870 to 1901]
1877-88 –> 1888-89 –> 1896-97 –> 1905-06 with 1899-1900 as a half cycle
2nd FULL MOON EPOCH [1932 to 1963]
1940-41 –> 1951-52 (weak) –> 1963-64 (weak) with 1957-58 as a half cycle
3rd FULL MOON EPOCH [1993-94 to 2024-25]
1997-98 –> 2006 –>. 2015-16 –> 2024-25 with 2019-20 as a possible half cycle.
B. New Moon Epochs
1st NEW MOON EPOCH [1901 to 1932]
1902-03 –> 1911-12 –> 1918-19 –> 1931-31 with 1925-26 as a half cycle
2nd NEW MOON EPOCH [1963 to 1993-94]
1965-66 –> 1972-73 –> 1982-83 –> 1991-92 with 1987-88 as a half cycle.
3rd NEW MOON EPOCH [2024-25 to 2055]
Only accurate to +/- one year and only a heightened chance of occurring.
2027 –> 2036 –> 2045 —> 2054 with a 2049-2050 half cycle.
Sir,
You write a lot on ENSO., it is a lot of effort.
But; I am too confused to understand the current Status. Can you simplify; something like an Abstract or Summary?
Thanks,
Gopinathan Krishnan is a Scientist in the 7th “World”