John McLean writes of a new paper about the pattern in global average temperature anomalies since 1950 and how they are linked to changes in cloud cover and ENSO:
 Key points of the paper:
- Indicates that the temperature pattern can be attributed to a
sequence of events, namely a shift in the prevailing ENSO conditions,
then a reduction in total cloud cover and then a shift on cloud
(decrease in low level cloud that was largely offset by an increase
in mid and upper level cloud)
- Uses the Trenberth, Fasulo & Kiehl energy balance diagram to show
that the loss in total cloud cover caused an increase in heat energy
being absorbed at the Earth’s surface that was greater than the
increase that IPCC 5AR claims was due to greenhouse gases
- Indicates that greenhouse gases played little if any part in the
warming, which not only refutes the IPCC’s belief or opinion but also
means that there is negligible, or even no, 16 or more years’ of
“missing heat” to be found.
- Shows the changes in cloud cover and temperature both as global
averages and then for the six latitude bands each of 30 degrees, the
latter indicating the changes in cloud cover applied to most latitude
bands except the Antarctic and to a less extent 30S-60S.
- Doesn’t attempt to identify the reason for the reduction in total
cloud cover or the shift from low level cloud.
McLean writes:
On the last point above, I think a reduction in micro-particle emissions probably contributed. The disappearance of London’s “pea soup” fogs after the ban on the burning of coal is probably a good precedent. It would be ironic if the reduction in micro-particle emissions was due to government legislation because that would mean that the warming was manmade. To be fair though, it was probably the first deliberate attempt to clean up the atmosphere even if it didn’t come with a warning about possible changes to weather patterns. We also shouldn’t forget that there may be other causes, such as changes to cooking fuel in the tropics.
The paper is available free of charge via
http://www.scirp.org/journal/PaperInformation.aspx?PaperID=50837#.VE9LlFfivOU
Late Twentieth-Century Warming and Variations in Cloud Cover
ABSTRACT
From 1950 to 1987 a strong relationship existed between the El Nino-Southern Oscillation (ENSO) and HadCRUT4 global average temperature anomaly, interrupted occasionally by volcanic eruptions. After 1987 the relationship diverged, with temperature anomaly increasing more than expected, but was re-established after 1997 at an offset of ~0.48°C higher. The period of increased warming from 1987 to 1997 loosely coincided with the divergence of the global average temperature anomalies over land, which are derived from observation station recordings, and the global average anomalies in sea surface temperatures. Land-based temperatures averaged 0.04°C below sea temperatures for the period 1950 to 1987 but after 1997 averaged 0.41°C above sea temperatures. The increase in the global average temperature anomaly and the divergence of land and sea surface temperatures also coincided with two significant changes in global average cloud cover. Total cloud cover decreased during the period from 1987 to 1997 and, for most of the remainder of the period from 1984 to 2009, decreases in low-level cloud were accompanied by increases in middle and upper level cloud. These changes can be found in both global average cloud cover and in each of the six 30°C-latitude bands. The impact of these changes in cloud cover can account for the variations in HadCRUT4 global average temperature anomalies and the divergence between land and sea temperatures.
aren’t temps driving the cloud cover?…..seems that temps change first
Latitude,
“aren’t temps driving the cloud cover?…..seems that temps change first”
Yes, but it is circular logic. Clear skies > warmer temps > more wind > more evaporation > cloudy skies > cooler temps > less wind > less evaporation > clear skies, rinse and repeat. Pick whichever variable you prefer as the driver they are all equally valid.
LOL….yep
This sounds like Willis’ thermostatic hypothesis. This may be the true reality of it all.
Not necessarily. As noted in the intro way above, cloud formation isn’t just a matter of temperature. The reduction of micro-particles, which go on to form cloud nuclei, can also impact cloud formation, or in London’s case the forming of “pea soup” fog.
Its interesting that the sceptic community likes to list all the “excuses” for the pause. But there is also a growing sceptic list of theories to try to explain away the real warming that has taken place since the 1970s, avoiding the increasing concentrations of GHGs as the main driver.
Occam’s Razor applies.
You don’t have to have an alternate theory to decide that this one doesn’t work. Perhaps you noticed, the CO2 theory isn’t doing very well at explaining the available data. It is part of science to decide that we don’t know.
James Abbott:
Did you come here to sneer at skeptics in general or to make some contribution to the thread?
Because, if you intended to make some useful contribution, you failed.
a growing sceptic list of theories to try to explain away the real warming that has taken place since the 1970s
=======
james, there’s no explaining to do……..
http://stevengoddard.files.wordpress.com/2010/10/1998changesannotated.gif?w=500&h=355
Show us a correlation between CO2 and global temperatures for the last 12,000 years. Oh…that’s right…you can’t because there is no correlation. Thus, as current CO2 continues to rise, we see no increase in global temperatures.
The list of other possible explanations has always been long. The assumption of CO2 as the driver of all things climate is simplicity reduced to absurdity. The potential for warming to increase due to less cloud cover, and or cloud location changes, thus greater surface insolation, is much simpler then the postulated CO2 plus positive feedback, which is falsified by observations.
The CO2 based theory does not seem to be working very well. Finding a new theory or two or three to replace it is going to take more than a bit of looking. This paper is an exploration towards that end. It is not reasonable toe expect a theory to immediately spring forth, fully developed all at once from one paper. Let the theorists and statisticians play around for a while, a little on this relationship, a little on that. Maybe something will turn up to be useable as part of the next theory of climate. Maybe this will be part of it, maybe it won’t but it’s a worthwhile exploration if for no other reason that someone can decide now that this piece is done that they don’t have to do it.
The authors establish at some level a correlation, which of course does not prove a causal link, but it does leave the possibility. If there is causation there will be correlation, even if the reverse is not true.
Sorry about the blockquotes.
Don’t apologize, Jimbo — that was COOL. Going to keep THAT one in mind!
#(:))
I was merely pointing out that as well as a long list of reasons drawn up by the sceptic community poking fun at the reasons for the pause, there is a similar long list of reasons being used by the same community to explain the post 1970s temperature rise, avoiding a GHG driver.
mpainter you ask for a “useful contribution”
How’s this:
The GHE is well understood. Without GHGs, surface temperatures would be many tens C colder than now – permanent ice age.
Humans are increasing the concentration of GHGs, particularly CO2.
Increasing the concentration of GHGs should produce warming.
The exact response to increasing GHG concentrations, and any amplification, cannot be known due to the complexity of the system, so forecasts cover ranges of response.
Temperatures will not rise year on year. Natural variation dictates there may be pauses or short term cooling, but the long term trend will be warming of the surface – both oceans and atmosphere.
Therefore, in the absence of a plausible mechanism that explains the extent of the warming, or its timing, the GHG driver is by far the most likely reason for the observed warming, which is essentially the approach contained in Occam’s Razor.
James, how does that explain the temperature fall from the 1930’s to the 1970″s?
It is the CO2 AGW proponents who are violating Occam’s Razor by proliferating (ad hoc) proposed causes for the lack of warming over recent decades; missing heat in the deep oceans, etc.
Occam’s Razor would conclude, CO2 does not produce significant warming relative to other causes.
@ur momisugly James Abbott
October 30, 2014 at 2:35 pm: The razor has already removed your propositions, James, and that is all the troll-feeding I’ll be doing. Brett
I find reasonable the epistemic approach of the paper in the following regard.
In the datasets he referenced, McLean explicitly and openly says why he focuses on using data from the period he did. It was to evaluate a period in his paper which was the same period that the IPCC evaluates /claims is the period where “warming was largely due to human activity”. He is picking the same period as the IPCC focuses on to compare his finding with theirs in a critical manner.
He finds against the IPCC assessment of that period. It is reasonable.
John
Latitude
First off it was more of a plateau than a fall, in the context of long term changes.
http://data.giss.nasa.gov/gistemp/graphs_v3/Fig.A2.gif
Secondly, the GHG forcing in the mid 20th was smaller. CO2 concentration was 320ppm in 1965. Not only did it rise subsequently to the current 395ppm, it accelerated.
The timing and the extent of warming from the 1970s onwards was broadly consistent with what would be expected as a response.
The current pause started about 12 years ago (not 18).
Resumed warming should be expected and I do not see any reason why it should not do so unless there is some new significant driver (eg a major volcanic eruption).
2014 is very likely to be close to record warm despite no strong El Nino.
http://www.esrl.noaa.gov/gmd/webdata/ccgg/trends/co2_data_mlo.png
Much better, James. You will find that people will accord you the right to present your scientific point of view here.
And if you are not the rigidly doctrinaire type (as is often the case), you will learn some things here. For example, you might learn that the bubonic plague is endemic to the western US. It’s true. The ground squirrels harbor the disease. Watch out for those cute little chip monks and especially the burrowing types like the golden ground squirrel.
Another interesting fact is that atmospheric CO2 has no effect_absolutely_none_ on sea surface temperatures. This by the immutable laws of radiative physics. To put it another way, water is opaque to IR, and the greenhouse effect has no effect on water. This is not just theoretical, but can be confirmed by an easy experiment.
So James, you must not think that you can cut and paste from SKS or Hot Whopper. People here know their stuff, and most know a lot more than I. So be prepared to learn, that is, if you are capable of learning.
That temp plot is pure fiction, the decade of the 1930s was the warmest.
http://wattsupwiththat.com/2012/08/08/dear-noaa-and-seth-which-1930s-were-you-referring-to-when-you-say-july-is-the-record-warmest/
There has never been any methodically placed global surface temperature measurement network in human history. Satellites since 1980 don’t measure surface temps, only lower troposphere for 95 percent of the planet. The UAH/RSS data show a current anomaly of about +0.3 degrees with an error of about 0.2 degrees.
There are a very few scientifically reliable rural surface temperature records scattered around that show no significant warming in the industrial era. Antarctic science stations show zero warming since 1958
“the decade of the 1930s was the warmest.”
That link you gave was to do with U.S.Temps, not global temps. Duh!
Not bad James. As you rightly note, the CO2 was a lot lower in the early to mid 29th Century and in the late 20th Century the increase accelerated.
But that leaves you with a little problem. If you look at your graph you will see two warming periods, roughly 1910-1940 and 1970-2000. The rates of warming for these periods are statistically identical, at roughly .16 degrees per decade. with more CO2 and the amount increasing at an accelerating rate, the 1970-2000 period should show increased warming. But it doesn’t.
It may interest you to know that the 1850-1880 warming period had the same rate of warming as the other two but with little increase in CO2 at all.
Three warming periods which according to the IPCC, the 1850-1880 is natural, the 1910-1940 is part AGW and part natural and AGW and the 1970-2000 is almost totally AGW. And yet all three have exactly the same rate of warming. What an amazing coincidence, the natural factors reduced at exactly the right rate for the CO2 to take over without changing the rate of warming. Did God do it or was it just plain old magic?
Like most in the “sceptic” camp, I do believe the planet has warmed (and that CO2 had some part to play), but I don’t believe in coincidence or magic.
http://i1264.photobucket.com/albums/jj484/rlcina71/PDOcorellation_zpsb1b8cff2.gif
http://i1264.photobucket.com/albums/jj484/rlcina71/HadCRUT4GlobalMonthlyTempSince1958AndCO2_zps45eb2fc8.gif
http://i1264.photobucket.com/albums/jj484/rlcina71/hc_fig3_zpsfcbceaee.jpeg
Could it really be that we have multi decadal cycles in oceans, cloud cover, and atmospheric warming and cooling, and they all tent to line up? How synchronized is the AMO and PDO?
Funny, James. You use the finagled surface temp series to prove your point. You might as well have used the Mannomatic Hockey Shtick. That would be so 1990s.
The only reliable temp series are the satellite series.
The graph below shows how Global cloud cover % (ISCCP) has varied with global temperatures.(c)
https://imageshack.us/i/nqglobaltempvglobalcloudbp
The graph below shows how global temperatures change when adjusted for by global cloud levels. (ISCCP) Observed satellite data has been used for estimating global clouds affect on planets temperature.
https://imageshack.us/i/mvhad3vlowcloudvsolar2p
This does back up the article that when this is taken into account there is very little else left for other causes. Global temperatures show an adjustment similar to those of the 1970’s when global cloud cover is taken into account.
Numerous countries including those in the UK recording sunshine hours present similar findings. With previous sunshine levels generally increased over this period and support the trend in ISCCP global cloud cover.
The correct links are below.

The take-home from John McLean’s paper: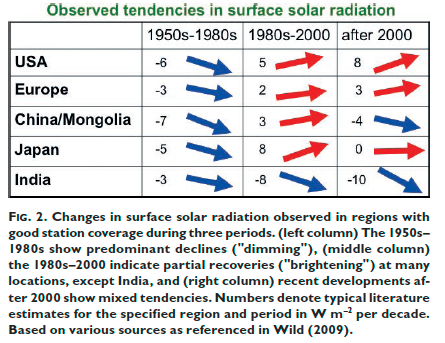
——————————————
http://www.scirp.org/journal/PaperInformation.aspx?PaperID=50837#.VFLoKPnF-Sq
The reduction in total cloud cover of 6.8% [between 1984 – 2009] means that 5.4 Wm−2 (6.8% of 79) is no longer being reflected but acts instead as an extra forcing into the atmosphere… To put this [5.4 Wm-2 of solar radiative forcing via cloud cover reduction between 1984-2009] into context, the IPCC Fifth Assessment Report…states that the total anthropogenic radiative forcing for 2011 relative to 1750 is 2.29 Wm−2 for all greenhouse gases and for carbon dioxide alone is 1.68 Wm−2. The increase in radiative forcing caused by the reduction in total cloud cover over 10 years is therefore more than double the IPCC’s estimated radiative forcing for all greenhouse gases and more than three times greater than the forcing by carbon dioxide alone [from 1750 to present].
——————————————
We can further confirm this much-stronger solar radiative forcing (via albedo changes) pattern relative to the anthropogenic contribution since 1950 by not only looking at this IPCC commentary regarding the paltry 0.3 W/m2 of anthropogenic forcing from 1951 to 2011….
——————————————
“Over the period 1951–2011 the trend in anthropogenic forcing is almost 0.3 W m–2 per decade and thus anthropogenic forcing over this period is more than 1.5 W m–2.” IPCC AR5 Chapter 8, page 699
——————————————
….relative to several other peer-reviewed papers that show a similarly strong (5.4 W/m2 for 1984-2009) solar radiation forcing via albedo variations (brightening/dimming) as John McLean’s fine paper does:
——————————————
http://journals.ametsoc.org/doi/abs/10.1175/JCLI-D-12-00482.1?journalCode=clim
Data from this summation method suggest that surface incident solar radiation increased at a rate of 6.6 W m−2/decade−1 (3.6%/ decade) from 1992 to 2002 (brightening) at selected sites.
——————————————
http://onlinelibrary.wiley.com/doi/10.1029/2008JD011290/abstract
The decadal trend shown in the 5-year running mean indicates a period of rapid increase [solar radiation reaching the surface/brightening] starting in late 1930s and continuing to early 1950s with a change of 10 W m2. The dimming trend from the early 1950s to the late 1980s shows a decrease of 13 W m2. The subsequent increase starting in late 1980s is about 10 W m 2 by 2005. These changes are not confined to a small number of stations in western Europe, but shared by more than 400 other sites where global irradiance has been continuously observed for more than 40 years.
——————————————
ftp://bbso.njit.edu/pub/staff/pgoode/website/publications/Palle_etal_2005a_GRL.pdf
Traditionally the Earth’s reflectance has been assumed to be roughly constant, but large decadal variability, not reproduced by current climate models, has been reported lately from a variety of sources. There is a consistent picture among all data sets by which the Earth’s albedo has decreased over the 1985-2000 interval. The amplitude of this decrease ranges from 2-3 W/m2 to 6-7 W/m2 but any value inside these ranges is highly climatologically significant and implies major changes in the Earth’s radiation budget.
——————————————
http://onlinelibrary.wiley.com/doi/10.1029/2010JD015396/abstract
We find distinct patterns of dimming and brightening in the aerosol optical depth and thus clear-sky downward surface shortwave radiation (SSR) in all analyzed subregions.The strongest brightening between 1973 and 1998 under clear-sky conditions is found in mid-Europe (+3.4 W m−2 per decade [8.5 W m−2 total], in line with observations).
——————————————
http://www.sciencemag.org/content/308/5723/850.abstract
Long-term variations in solar radiation at Earth’s surface (S) can affect our climate, the hydrological cycle, plant photosynthesis, and solar power. We observed an overall increase in S [solar radiation] from 1983 to 2001 at a rate of 0.16 watts per square meter (0.10%) per year [3.04 W/m-2 total]
——————————————
http://www.sciencedirect.com/science/article/pii/S1352231014007456
Total global solar shortwave (G) irradiation and sunshine duration were recorded at nine Spanish stations located in the Iberian Peninsula. Averaged series (using the nine locations) showed a statistically significant decrease in annual G [global dimming] from 1950 to the mid 1980s (−1.7%dc−1) [-8.5 W/m2] together with a significant increase [global brightening] from the mid 1980s to 2011 (1.6%dc−1) [+8 W/m2].
——————————————
Graph showing global dimming/brightening trends in W/m2 per decade (taken from Martin Wild, 2012: Enlightening Global Dimming and Brightening. Bull. Amer. Meteor. Soc., 93, 27–37):
Nice work KennethRichards. Can I just add that while variations in solar irradiance are interesting the real question is how much of that radiation is reaching the Earth’s surface and how it might vary over time.
Please also be aware that I figure that at no time in human history until the 1980s was there a widespread effort to reduce emissions (and perhaps at the same time some less deliberate efforts). Given the disappearance of London’s “pea soup” fogs when coal burning was banned, I don’t think anyone should be surprised that the Earth warmed slightly when total cloud reduced.
Yes indeed. All I can say is it is observational data, and appears to be a hell of a lot more like science then the Global Climate Models. Thank you John, and I think your paper deserves a great deal of attention.
Thanks for your efforts Kenneth! I was impressed by the spanking you gave Publicola in a discussion a couple weeks back. Your doing the best job I’ve seen of getting appropriate facts out there. We need more like you out on the front lines.
The author appears not to be aware of the sensitivity of minimum temperatures to changes in low clouds. HadCRUT land is predominantly a min/max dataset.
Briefly, minimum temperatures occur at the point when solar insolation at the surface exceeds OLWR. Decreases in low level clouds increase solar insolation at the surface, and cause earlier and higher minimum temperatures. Particularly true in the mid to higher latitudes in winter when the angle of incidence
of solar radiation after dawn is low for an extended period.
Most warming in HadCRUT land over the last 60 years is in winter minimum temperatures, ex tropics.
Therefore, there is no need to invoke radiative balance causes. As at least half the warming is an artifact of using minimum temperatures.
I was aware of it but decided it was irrelevant. Yes, the HadCRUT data is derived from minimum and maximum temperatures and variations in cloud cover at the times of maximum temperature (typically early to mid afternoon) and minimum temperature (typically just after sunrise) can impact those min and max temps.
The real issue is net radiation (OLWR v. incoming) strength and direction. Cloudy nights are typically warmer than clear nights; cloudy days typically cooler than cloud-free days, and I say “typically” because we shouldn’t forget other influences on weather (e.g. winds). In northern Scandinavia cloud free days in October and November are frequently cooler than cloudy days at that time of year because the net radiation flow is outwards, to space, even when the sun is shining.
You miss my point.
I say, much of the warming in HadCRUT (probably more than half) is due to the sensitivity of minimum temperatures to solar insulation at the surface in the period after dawn Resulting from the interference to solar radiation effect of low level clouds in the period shortly after dawn. That is, small changes in solar insolation (radiative balance) at the surface at these times produces a disproportinately large change in minimum temperatures.
FYI, the only published paper comparing changes in minimum temperatures to overnight temperatures, for which minimum temperatures changes are supposedly a proxy, was done using Mauna Loa data. About the last place in the world where you would expect to find a low level cloud effect.
One would think that minimum temperature changes, which constitute the bulk of the warming in the surface temperature record, and which form most of the empirical basis for AGW, would merit rather more scrutiny than that.
Phillip, solar radiation just after dawn is very weak because of the angle of incidence. An Australian study has shown that many minimum temperatures occur under clear sky just on or a few minutes after sunrise. The warmest minimum temperatures will usually occur when the night has been cloudy and there’s been a warm wind. Mind you if the days and nights were cloudy but there’s a shift and the day is no longer as cloudy, I would expect extra heating during the day that can’t escape from under the cloudy night sky.
John McLean commented
I’ve been measuring Zenith temp for about 3/4 of a year now, and without exception any water increases it’s temp. With clear dry (surface humidity) skies, I’ve measured -60F at about 50F air temps. But for radiative cooling I think the surface of the ground temp is more important. You see this when the grass has frost on it, and the roads and sidewalks don’t, and the reason is the top of the grass is below freezing, and the sidewalk isn’t (easy to measure). But something happens during the night, cooling rates drop off throughout the night. Where the last few hours the temps don’t drop much. But it cools until the Sun comes up. I suggest anyone who actually cares enough to read these blogs, go buy a $100 weather station, watch the weather, and if you can, get a low temp IR thermometer.
But, my work with surface records (NCDC GSoD) shows the big swings in min temps are regional not global. And compared to Max temps, the change a lot. I suspect that what it’s showing is large swings in ocean surface temps up wind of the area the majority of that continents air mass comes from.
I posted my latest graphs here:
http://wattsupwiththat.com/2014/10/23/weather-channel-founder-john-coleman-there-is-no-significant-man-made-global-warming-at-this-time/#comment-1769579
I’ve written stuff here http://www.science20.com/virtual_worlds/blog/global_warming_really_recovery_regional_cooling-121820
The attribution is just my musing, but the numbers are good.
And if you follow the url in my name all of the output and code it there, data is available from the NCDC.
Philip Bradley commented
You might be interested
http://wattsupwiththat.com/2014/10/23/weather-channel-founder-john-coleman-there-is-no-significant-man-made-global-warming-at-this-time/#comment-1769579
and this
http://www.science20.com/virtual_worlds/blog/global_warming_really_recovery_regional_cooling-121820
H. L. Penman in his evaporation equation in 1948 used cloud cover data to estimate sunshine data. The equation he used is: s = 1 – m, where s is the sunshine as a fraction of day length (n/N) and m = cloudiness expressed as a decimal fraction [low + medium + high clouds/8, as sky is divided in to 8 octas]. I presented an equation s = 1 – f1 + f2 where f1 is a function of cloud factor and f2 is a function of latitude — Solar Energy [USA], 1974, 15: 281-285.
Dr. S. JeevanandaReddy
.
clivebest October 30, 2014 at 12:38 pm
Clive, that’s very interesting. Where did you download the ICSSP data in netCDF from?
Regards,
w.
Willis,
Yes I downloaded the monthly global cloud cover data in netCDF format. The file is called MnCldAmt.nc . It is a 3-D nc file CC(month,lat,lon).
I converted it to ASCII using ncdump and wrote a PERL script to perform the global and hemispheric area averages. The code is shown below.
#!/usr/bin/perl
# use strict;
# use warnings;
# changed to calculate the monthly averages first.
use Time::Local
my @CC=();
my @mvap=();
my @nhit=();
@mdays=(31,28,31,30,31,30,31,31,30,31,30,31);
# date set at half of december 1987 for the mid month normalization
$time = timegm(1,1,12,15,0,1988)-978307200;
$command = ‘ncdump -v MnCldAmt MnCldAmt.nc’;
$istart = 0;
my @docs = qx($command);
$icount=0
foreach my $line (@docs) {
chomp $line;
if ($istart eq 0) {
if ($line =~ /water_vapor =/)
{
$istart =1;
$lon=0;
$lat=0;
$imonth=0;
}
} else {
$icount++;
my @values = split(‘,’, $line);
foreach my $val (@values)
{
if ($val 144) {
$lon=0;
$lat++;
}
if ($lat > 72) {
# make mnthly average
#
for ($i=0; $i<360; $i++)
{
for ($j=0; $j 0.0) {
$wvap[$i][$j] = $mvap[$i][$j][$imonth]/$nhit[$i][$j];
$nhit[$i][$j] = 0;
$mvap[$i][$j][$imonth]=0.0;
# print $lon.’ ‘.$lat.’ ‘.$wvap[$lon][$lat],” \n”;
} else {
$wvap[$i][$j] = -9999;
}
}
}
#
# – calculate global average
#
my $W_tot_NH = 0;
my $A_tot_NH = 0;
my $W_tot_SH = 0;
my $A_tot_SH = 0;
for ( my $j = 0 ; $j 90 || $Lat < -90 ) { next; }
my $Weight = cos( $Lat * 3.141592 / 180 );
for ( my $i = 0 ; $i < 360 ; $i++ ) {
if ( $wvap[$i][$j] 0 ) {
$W_tot_NH += $Weight;
$A_tot_NH += $wvap[$i][$j] * $Weight;
# print $Weight,” \n”;
}
else {
$W_tot_SH += $Weight;
$A_tot_SH += $wvap[$i][$j] * $Weight;
}
}
}
if ( $W_tot_NH > 0 && $W_tot_SH > 0 ) {
$glavg = ( $A_tot_NH / $W_tot_NH + $A_tot_SH / $W_tot_SH ) / 2;
$navg = $A_tot_NH / $W_tot_NH;
$savg = $A_tot_SH / $W_tot_SH;
# print $iyear.’ ‘.$iday.’ ‘.$glavg.’ ‘.$navg.’ ‘.$savg,” \n”;
print $time.’ ‘.$glavg.’ ‘.$navg.’ ‘.$savg,” \n”;
$time = $time+$mdays[$imonth]*86400;
}
$imonth = $imonth + 1;
$dmonth= 0;
} else {
$dmonth++;
}
}
}
Sorry – lost the indentations !
Thanks, Clive. For those interested, I finally found the ISCCP data here in netCDF format. The main dataset (monthly mean cloud cover %) is here.
You see how easy it is to specify the exact dataset, instead of just waving your hands at the front page of the ISCCP website like the McLean paper did? That’s one of the reasons I said the paper was junk, and I stand by it.
w.
Willis: ” I said the paper was junk and I stand by it”
###
I, and several others, suggested that you contact John McLean for help in locating the data. You rejected that sensible advice in a distempered fashion:”Put up or shut up” you told us.Your abusive tirades don’t help you, Willis.
You have condemned McLean’s study because of your trouble in locating the data set. That is a very egocentric set of standards for evaluating science, Willis. You should work on improving your standards, that is , if you wish to gain recognition as a scientist.
I disagree with your characterization of this paper. Indeed, I consider it as a most important contribution to our understanding. I hope to see more studies of the cloud albedo factor in determining surface temperatures.
Thanks to John McLean for this study and his participation here.
Willis, I accept that it was probably an error on my behalf not to mention the specific ISCCP dataset I used but an email to me would have quickly resolved the question. If I hadn’t by chance seen your comment here you wouldn’t have received an answer.
I smile and ponder whether peer-review should have picked it up. (In a submission to a UK Parliamentary inquiry into peer review a few years ago I suggested that checklists be used. Some but far from all journals now seem to be using them. “Clear identification of data sources” should appear on those lists.)
Also, in future can you please spell my name correctly? Incorrect spelling is an obstacle to anyone trying to do a web search. Thanks.
‘Phillip, solar radiation just after dawn is very weak because of the angle of incidence.’
Which is my point. Small changes in solar radiation at the surface when the incidence is low, after dawn, cause relatively large changes in minimum temperature (Compared to solar radiation changes around maximum temperature). And low level clouds cause such changes in the early morning.
Using the average of a min/max dataset (HadCRUT) and ascribing changes to radiation at the surface.you are essentially equally attributing your radiation cause to both min and max temps changes. I’d suggest looking at the effect of surface radiation on min and max temps separately would be more productive.
regards
This is not really new. The correlation between global temperature and cloud cover was published by me in
Scafetta, N. 2013. Discussion on climate oscillations: CMIP5 general circulation models versus a semi-empirical harmonic model based on astronomical cycles. Earth-Science Reviews 126, 321-357.
http://people.duke.edu/~ns2002/pdf/EARTH_1890.pdf
http://www.sciencedirect.com/science/article/pii/S0012825213001402
See Figure 19.
Nicola, with a twinkle in my eye I’d say that your paper mentioned total cloud cover in passing while concentrating on other matters. I must admit that I don’t recall seeing your paper. Literature reviews aren’t easy given the huge volume of papers that are published now. Electronic searching helps but can still return lots of potentially relevant papers that need to be assessed. With no mention of clouds in your title or abstract I might well have seen it returned by a search engine but rejected it.
One difference is that I derive cloud cover anomalies in order to obtain a clearer picture, because cloud cover varies on a seasonal basis over small and large regions. I also looked at the three levels of cloud (low, mid and upper) and found the important shift. Another significant difference (general, not statistical) was that I first resolved a residual global average temperature anomaly to identify the patterns that ENSO and volcanic eruptions couldn’t account for. (FWIW my paper grew out of the fact that the ENSO provided a pretty good account of temperatures until 1987 but after that the relationship changed – why?.)
Note to John McLean – Nice to see ANY paper that does not assume increased atmospheric CO2 is the primary driver of global warming.
Note to James Abbott – the following was written one year ago, based my paper published in 2008, and is still valid imo.
http://wattsupwiththat.com/2013/10/10/the-sun-does-it-now-go-figure-out-how/#comment-1445683
[excerpt]
The popular debate in climate science suggests that this science is in its infancy. I further suggest that the majority of climate science has taken a giant step backwards in recent decades due to egregious political interference and scientific misbehaviour.
Notwithstanding all the wonderful data available especially since ~1979, we have an “ECS mainstream debate” that ASSUMES THAT CO2 SIGNIFICANTLY DRIVES TEMPERATURE and centres on the question of “climate sensitivity to atmospheric CO2” (“ECS”) that questions whether ECS is greater or less than 1 (that is, are there positive or negative feedbacks to increasing atmospheric CO2).
Since CO2 clearly LAGS temperature at all measured time scales, this ECS mainstream debate requires that, in total, “the future is causing the past”, which I suggest is demonstrably false.
To be clear, I suggest that atmospheric CO2 does NOT significantly drive Earth temperatures, and Earth temperatures clearly drive atmospheric CO2.
This does not preclude the possibility that the observed increase in atmospheric CO2 is primarily caused by some factors (natural and/or humanmade) other than temperatures, but such increase in CO2 is insignificant to Earths’ temperatures.
In summary, in climate science we do not even agree on what drives what, and it is probable that the majority, who reside on BOTH sides of the ECS mainstream debate, are BOTH WRONG.
It is also possible that I am wrong on this point ( possible, but not probable :-} ).
Regards to all, Allan
“Since CO2 clearly LAGS temperature at all measured time scales”
– except the modern warm period where CO2 appears to be leading temperature.
Claiming “this time is different” because of that correlation is a central tenet for AGW theory. Disproving AGW theory requires measurements that show other forcing’s are the cause of the observed warming. This paper does a good job of pointing to what those other factors are.
The models have failed validation but the theory will stand until empirical proof of what actually drives climate has been established.
“– except the modern warm period where CO2 appears to be leading temperature”
THAT STATEMENT IS FALSE EXCEPT FOR ABOUT 30 YEARS FROM 1975 TO 2005 AND THEN ONLY COINCIDENTAL – IT MEANS NOTHING.
IN THE 30 YEARS PRIOR TO 1975, CO2 INCREASED WHILE TEMPERATURES DECREASED.
SINCE ABOUT 2005 (OR EARLIER) CO2 HAS INCREASED AND TEMPERATURES HAVE REMAINED FLAT.
CO2 LAGS TEMPERATURE IN THE MODERN DATA RECORD (SINCE 1958) BY ABOUT 9 MONTHS.
CO2 LAGS TEMPERATURE IN THE ICE CORE RECORD BY ABOUT 800 YEARS ON A LONGER CYCLE.
CO2 DOES NOT SIGNIFICANTLY DRIVE TEMPERATURE. TEMPERATURE (AMONG OTHER FACTORS) DRIVES CO2.
NOT SHOUTING ABOVE – CAPS LOCK WAS STUCK ON…
This what happens when you look at your fingers when you type. 🙂
“The models have failed validation but the theory will stand until empirical proof of what actually drives climate has been established.”
With respect, I suggest the theory has been effectively falsified as follows:
Based on observations, increased atmospheric CO2 does not significantly drive Earth’s temperature – that is, not enough to matter.
Other factors are much more significant drivers of Earth’s climate.
And all our yesterdays have lighted fools
The way to dusty death. Out, out, brief candle!
Life’s but a walking shadow, a poor player
That struts and frets his hour upon the stage
And then is heard no more. It is a tale
Told by an idiot, full of sound and fury,
Signifying nothing.
– W.S.
I should have qualified that with “the theory will stand in mainstream climate science until empirical proof of what actually drives climate has been established.” That was what I was referring to but didn’t state.
I agree with you but we have a long way to go before the majority wakes up. I think most here have moved on to trying to figure out what the primary drivers of climate are.
“I think most here have moved on to trying to figure out what the primary drivers of climate are.”
Good comment gyan1.
Although I no longer have time to research, I try to keep up with the conversation.
A few musings follow:
I suspect that the Sun and its small variations are a significant driver of the changes we see in climate over hundreds of years, such as the Dalton and Maunder minimums and their associated cold periods. However, I have not been able to detect a clear correlation of global temperatures with solar cycles such as the ~11-year the Schwabe or even the ~90-year Gleissberg. This may be my failure. However, I suspect that irregular oceanic cycles such as the “slosh” of the PDO/ENSO are sometimes in-phase and sometimes out-of-phase with solar cycles, such that global temperatures vary on an irregular basis, and so just appear to go up and down.
If this hypo is true, it suggests warmer trends during periods of an active Sun and cooler trends during periods of a less active Sun, but with considerable noise in the temperature signals – and that is consistent with observations. Based on this hypo, I suggest global temperatures will cool in the next few years, regardless of atmospheric CO2 concentrations.
That cooling prediction directly contradicts the popular (IPCC et al) CO2-driven hypo of humanmade global warming. We will see which hypo more accurately predicts the years to come.
Regards to all, Allan
Alan,
“However, I suspect that irregular oceanic cycles such as the “slosh” of the PDO/ENSO are sometimes in-phase and sometimes out-of-phase with solar cycles, such that global temperatures vary on an irregular basis, and so just appear to go up and down.”
You can see large differences in the average of minimum temps when done for the various continents.
MCro – Not objecting, but can you please provide some references?
Some supporting evidence for your statement may be provided this winter (2014-15).
This winter in the Northern Hemisphere is predicted to be quite cold in North America (Eastern and Central), Western Europe and very cold all across Russia.
I am concerned about a significant increase in excess winter mortality rates. Cold winters tend to kill off the elderly – I hope to not be one of them.
Allan MacRae commented
Just my own work.
You can start here http://wattsupwiththat.com/2014/10/23/weather-channel-founder-john-coleman-there-is-no-significant-man-made-global-warming-at-this-time/#comment-1769579
The reports I used to create those graphs are @ur momisugly the URL in my name on this post, continents.zip
and then there’s more here.
http://www.science20.com/virtual_worlds
mpainter November 1, 2014 at 11:14 am Edit
Condemned it because of “trouble in locating the data set”? Actually, what I said was that it was:
I stand by that. As published, it is assuredly incapable of replication because of the lack of data and code. In addition, the citing of the entire IPCC opus with no page numbers is indeed a joke.
w.
John McLean October 30, 2014 at 2:05 pm Edit
John, thanks for your responses. What you had said was:
Really? I don’t think that the takeaway message from AR5 was that the climate models run too hot. In fact, I couldn’t point to where in the IPCC report they said that, and I doubt greatly that many readers could. In fact, this is so contrary to the general claims of the IPCC that it most definitely needs specification chapter and verse.
In any case, that kind of citation is a red flag to me. It’s like the bible-thumping tent revival preachers of my youth waving the Bible around and saying “the answer is in the good book” … perhaps it is, but where? As I remarked above, my high school science teacher, Mrs. Henniger, would red-pencil our papers into submission if we tried that nonsense on …
It’s funny how people like my analyses until I take apart their own work … then suddenly they are all on about how they have to re-evaluate their opinion of me.
As to the work of David Evans (whose name you mis-spelled), seriously? A notch filter with 19 separate tunable parameters? Seriously? My friend, the idea that I am “peeved” that I didn’t write that piece of work is hilarious. If I’d written it, I would be deeply ashamed.
John McLean November 1, 2014 at 3:54 pm Edit
John, again my thanks … but I still haven’t received an answer. As I pointed out above, there are no less than 19 “D2” datasets, so telling us you used the D2 dataset tells us nothing. What we need is a link to the dataset AS USED. For example, I’m using an ISCCP D2 dataset from NOAA … can you guarantee that it is identical to the dataset you used? Datasets change all of the time as new data is added, and some dataset you used may have been superceded. This is why you need to archive your data, so that we can be sure that we are starting from the same point. What is needed is a LINK to the data AS USED.
Actually, what is needed is not clear identification of data sources. It is a link to a frozen copy of the data AS USED. But that’s not the biggest problem with your paper. It is the lack of the code that you used. I know that you’ve described your methods in clear English, but there is a reason we don’t program in English—it’s far too vague and imprecise.
And even if you’ve managed to describe what you think you did and have done so in a clear and precise manner, we have no guarantee that you’ve done that. The problem, as any programmer will testify, is bugs. You may think you have done one thing, but you’ve actually done something else entirely … and without access to the code AS USED, there is no way for us to determine whether you’ve done something foolish.
Those were my objections to the paper, John, that there was no data as used, no code as used, and the references were a joke that wouldn’t be accepted in my high school class. I stand by that. I know that it is harsh, but there’s no way to sugar-coat it. Without data and code, it’s simply not science.
It’s a deal, but only if in future you please spell David Evans’ name correctly. As someone recently informed me, incorrect spelling is an obstacle to anyone trying to do a web search. Thanks …
You see how pissy that sounds? In any case, I’ve fixed the mis-spelling, my bad.
John, I’m sorry that I was so harsh on your paper, but I’ve had it up to here with this no data, no code hogwash. This is the 21st century, times have changed. Nobody trusts climate scientists any more, and with damn good reason. Not posting links to your data and code is asking us to take your word for it, to take things on trust … sorry, not gonna happen.
And to be fair, John, surely my position on this can’t come as a surprise to you. I’ve been fighting this fight for some time now. I can’t tell you how many times I’ve said “No code, no data, no science”, or how many people I’ve excoriated for not archiving data and code, or how many open letters I’ve written to the journals and funding agencies pushing this same agenda of no data, no code, no science. I never heard you complain any of the many times when I’ve done that in the past.
… But people like you and David Evans seem to think that because you are on the side of the angels, I shouldn’t mention that neither of you have archived your data or your code, and thus that your work is not science of any kind. You must see that it would be entirely hypocritical of me to expect less of you than I do of Michael Mann, for heavens sake.
In addition, the citing of the entire IPCC report is a sure-fire sign to me of someone just phoning it in. If you can’t be bothered to identify the facts that support your claims, I can’t be bothered reading your claims.
In any case, there’s a simple solution to this whole difficulty, one that cuts the Gordian Knot—archive your data as used and code as used, and provide us with links to both of them. I do that for almost every one of my blog posts, for heavens sake, surely you can do the same for a full-blown scientific paper.
I’m also curious as to where the IPCC said the models were running too hot, so if you wanted to identify that as well it would be great, but that’s a side issue … the main issue is no data, no code, no science.
Anyhow, the ball’s in your court.
Again, my thanks for responding to the issues that I raised, much appreciated.
w.
John McLean, meet Willis Eschenbach.