UPDATE: Miriam responded in depth (?). See update at end of post for links.
# # #
Guest Post By Bob Tisdale
Date: October 5, 2014
Subject: Thank You for Admitting You Were Clueless
From: Bob Tisdale – Climate Observations and Regular Contributor at WattsUpWithThat
To: Miriam O’Brien – HotWhopper (a.k.a. Sou from Bundangawoolarangeera)
Dear Miriam:
I wanted to thank you for admitting you had little grasp of the subject matter in a recent post at your blog HotWhopper. Your post was Human influence on the Californian drought. (Archived version is here, just in case you decide to change your post.) Under the heading of “Disclaimer and further reading” you wrote (my boldface):
I make no assurances that I’ve interpreted the work properly. I think I’ve got the gist of it but please point out if you think I’ve gone astray anywhere.
If I may suggest, it would be helpful to your readers if you would preface all of your posts with the reality that you can make no assurances that you’ve interpreted anything properly at any time, and that you’re going to yak about it anyway, regardless. That way your readers can respond as I do to your absurd writings, with laughter.
EXAMPLE 1 OF WHY I FIND YOUR POSTS SILLY
In your recent post, you criticized Anthony Watts for referring to El Niños in the title of his recent post about the California drought: Claim: Cause of California drought linked to climate change – not one mention of ENSO or El Niño. Under the heading of “Why not ENSO or El Niño?”, after quoting Anthony’s title, you wrote (my boldface):
Indeed. I’ve no idea why Anthony thought ENSO or El Niño should be mentioned. For one thing, doesn’t El Nino often bring rains to California? For another thing, the paper was about the 2013-14 Californian drought. There was no ENSO event in that time.
That was exactly Anthony’s point. If El Niños “often bring rains to California”, and there hasn’t been an El Niño since the one in 2009/10, one might think the absence of El Niños may have exacerbated the drought.
And “another thing”, when your paragraph includes a statement where you, Miriam, admit to not having any idea why a statement was made, it undermines the point you’re trying to make. The facts that (1) you didn’t understand why Anthony mentioned El Niños in the title of his post and (2) you admitted it, made your criticism twice as funny.
EXAMPLE 2 OF WHY I FIND YOUR POSTS SILLY
This example is rather long, but please bear with me, Miriam, because this will help you understand a little more about weather and climate.
You then moved on to comment about my blog post California Drought – A Novel Statistical Analysis of Unrealistic Climate Models and of a Reanalysis That Should Not Be Equated with Reality, which was cross posted at WattsUpWithThat here.
You noted that much of Swain et al. (2014) was about the Ridiculously Resilient Ridge and geopotential height, not about sea surface temperature:
Bob didn’t mention geopotential height once. He spent most of his time writing about sea surface temperatures and CMIP5 models.
You continued (your boldface):
Bob wrote a whole heap about stuff that the paper wasn’t about and didn’t discuss what the paper was about.
And you, Miriam, added later (my boldface):
I don’t know what he was thinking.
I will apologize, Miriam. Sorry that I wasn’t thinking of you when I wrote my blog post. I assumed when writing it that the readers at my blog and at WattsUpWithThat were knowledgeable enough of climate and weather to understand that the oceans and atmosphere above it are coupled, meaning they interact with one another; they’re interrelated. That is, a change in one impacts the other, and that it’s difficult at best to determine which is the ultimate driver in any given situation. I received a comment at my blog that told me that I needed to clarify that, so I provided an update to my post and the cross post at WattsUpWithThat:
[Start of update to earlier post.]
Based on a comment on the thread of the cross post of this article at my blog Climate Observations, some persons might be wondering why I compared models of sea surface temperature to data, when Swain et al (2014) focused on geopotential height (see note below). My reply:
The large scale atmospheric circulation patterns are in part dependent on local sea surface temperatures. The oceans and atmosphere are coupled. If the models cannot simulate the sea surface temperatures properly, then they are not simulating atmospheric circulation properly.
Let’s confirm that.
Lead author Swain also wrote an article for The California Blog at WeatherWest titled Special update: The Extraordinary California Drought of 2013-2014: Character, Context, and the Role of Climate Change. In it, he acknowledged the relationship between ocean and atmosphere a number of times. On page 2 of his article, Swain wrote (my boldface):
Several recent studies have examined precisely this possibility in assessing cause of the extraordinary persistence of the Ridiculously Resilient Ridge in 2013 and 2014. Wang et al. (2014) find that tropical West Pacific SST warm anomalies (associated with the West Pacific Warm Pool that acts as a precursor of El Niño) played a leading role in causing the strength and longevity of the Triple R by generating a recurring series of atmospheric “Rossby waves” that propagated from west to east across the Pacific Basin. Wang and Schubert (2014) find that the North Pacific SST warm anomalies during early 2013 created a “predilection” for dry conditions during the second half of the 2013-2013 2013-2014 “rainy season” in California, and Funk et al. (2014) also report that the observed Pacific SST anomalies during 2013-2014 contributed to the extremely low precipitation that was observed during 2013-2014.
However, Funk et al. also note that it’s possible the record-breaking warmth in the North Pacific (discussed further below) was actually a geographically remote response to the changes elsewhere in the Pacific–similar to the mechanism considered by Wang et al. It’s even possible that that the Triple R played a role in sustaining itself by reducing North Pacific storm activity and preventing vertical mixing of cooler sub-surface ocean water, culminating in a self-reinforcing feedback loop by which atmospheric ridging led to warm SSTs , which in turn led to more ridging, and so on. Regardless of whether the record-breaking warmth in the North Pacific was the primary cause of the Triple R or merely a secondary one, it’s pretty clear that Pacific SST anomalies contributed to the persistent northeastern Pacific ridging and extremely low California precipitation observed in 2013-2014.
Swain confirmed that the sea surface temperatures of the eastern extratropical North Pacific and atmosphere above it are interrelated, and that the warm sea surface temperatures contributed to the California drought.
Looking back now at my post above, Figures 1 and 2 [The figure numbers refer to earlier post, not this one.] showed that the sea surface temperatures of the eastern extratropical North Pacific had not warmed for 2.5 decades, and had cooled prior to the unusual warming…while the climate models employed by Swain et al, Figure 4, showed the sea surface temperatures of that region should have warmed more than 0.65 deg C in those 2.5 decades if they were warmed by manmade greenhouse gases.
In other words, the climate models employed by Swain et al are not realistic representations of climate in the eastern extratropical North Pacific. This further indicates they have no value when attempting to determine the cause or causes of the California drought, and no values when trying to attribute that drought to manmade factors.
Note: If the term geopotential height is new to you, see the ECMWF webpage here.
[End of Update to earlier post.]
Oddly, Miriam, in your post, under the heading of “Teleconnections and The Blob”, you quoted one of the same paragraphs of lead author Swain’s blog post at WeatherWest that I included in my update. But you ended your quote too soon. If you had read one more paragraph…just one more paragraph…you would have found the answer to your questions:
Regardless of whether the record-breaking warmth in the North Pacific was the primary cause of the Triple R or merely a secondary one, it’s pretty clear that Pacific SST anomalies contributed to the persistent northeastern Pacific ridging and extremely low California precipitation observed in 2013-2014.
Does that help you understand why I focused on sea surface temperatures, Miriam? Between the Triple R (Ridiculously Resilient Ridge) and the sea surface temperatures of the eastern extratropical North Pacific, Swain understands they’re interrelated, but he does not know which is the ultimate driver.
EXAMPLE 3 OF WHY I FIND YOUR POSTS SILLY
Early in your post you presented a gif animation of sea surface temperature anomalies, which I have presented here as my Animation 1. You were very kind to your readers and you highlighted the region of elevated sea surface temperatures being discussed with a red circle. Please notice, Miriam, that the unusual warming of the sea surface (known as “the blob”) varies in strength and location.

Animation 1 (gif Animation “SwainBlob” from HotWhopper)
Very oddly, Miriam, after posting that gif animation of sea surface temperature anomalies, you questioned the fact that I presented graphs of sea surface temperature anomaly data. Thanks, your apparent contradiction made me chuckle.
EXAMPLE 4 OF WHY I FIND YOUR POSTS SILLY
Later in your post, you presented a map of the region I used for the unusual warming in the Northeast Pacific and then you criticized me for using such a large area. See the lower map in my Figure 1. The upper map is one of the cells from your gif animation (presented above). Oddly, they’re basically the same region, Miriam.

Figure 1
Your readers must really be wondering about that complaint of yours.
EXAMPLE 5 OF WHY I FIND YOU’RE YOUR POSTS SILLY
Toward the end of your complaints about my post, Miriam, you wrote:
Not that anything Bob wrote had anything to do with the Swain paper. That was about the Californian drought of 2013-14. It was about the Ridiculously Resilient Ridge, which is in the atmosphere not the ocean. The paper was about geopotential height and precipitation. Bob was writing about sea surface temperatures.
You forgot something, Miriam. If you had read and understood Swain et al., you would understand what you missed. Swain et al. used climate models to attribute the “ridiculously resilient ridge” [Triple-R], which is associated with the “blob” in sea surface temperatures, to manmade global warming. They wrote:
While the occurrence of events exceeding the P.I. 90–99th percentiles categorically increases in the 20C simulations (which include both natural and anthropogenic forcings), we find no such increase in those CMIP5 simulations which include only natural forcing (Fig. 2.2f; see SM). Thus, we find that anthropogenic forcing—rather than natural external forcing—dominates the simulated response in extreme GPH.
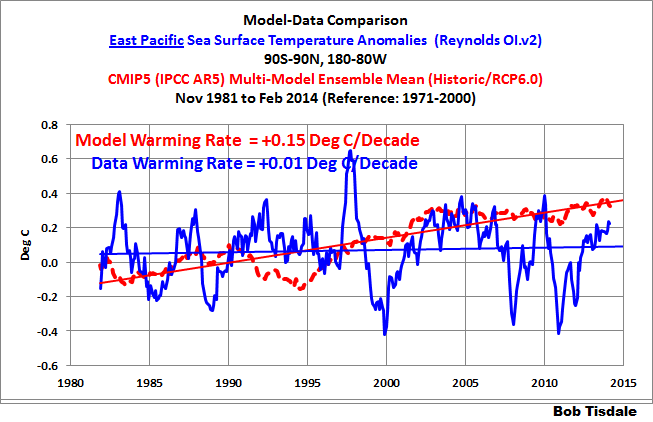
That’s basically the flawed IPCC argument that’s been around for years. In other words, the climate models that are forced by natural factors alone (volcanic aerosols and solar radiation) cannot simulate “metric X”, but the models that are forced by natural and anthropogenic factors can simulate “metric X”; therefore, the anthropogenic factors must be responsible for the change in “metric X”. That is an absolutely absurd argument, because the models cannot simulate naturally occurring coupled ocean-atmosphere processes that contribute to long-term warming or stop it. A side effect of that is, they cannot simulate where global sea surfaces show no long-term warming, Miriam. And one of the very large ocean regions where the surfaces show little to no warming for over 30 years is the entire East Pacific Ocean, from pole to pole, from the dateline to Panama. That region covers about 33% of the surface of the global oceans, and its surfaces have shown little to no warming in more than 3 decades. I post a graph of the surface temperature anomalies of the East Pacific every month in my monthly sea surface temperature updates, Miriam. Surely you’ve seen that graph and understood its importance, especially when climate models show it should have warmed about 0.45 deg C in that time.
Not too surprisingly, Miriam, the region with the blob is part of the East Pacific.
The fact that Swain et al. presented that flawed argument, Miriam, is why I presented the climate models used by Swain et al. and showed how poorly they simulated sea surface temperatures for the Northeast North Pacific, which as you’ll recall is coupled to the atmosphere and the recent Triple-R above it. Swain et al. presented a flawed argument and used flawed models to support it. If the models didn’t simulate the cooling of the ocean surface in that region, a cooling that occurred for almost 2.5 decades before the 2013/14 ridiculously resilient ridge appeared along with the unusual blob, then the models have no value in any attempt to attribute the Triple-R and blob to manmade greenhouse gases.
Miriam, hindcasts are different than forecasts. The data existed. The modelers knew the answers. Yet the modelers could not get their models to spit out those answers. Climate models have no value other than to show us how poorly they perform, and they do a great job of showing how poorly they perform.
EXAMPLE 6 OF WHY I FIND YOUR POSTS SILLY
In your post, Miriam, you wrote about the region I used for sea surface temperatures in the Northeast North Pacific:
It covers a lot of territory. Averaging it would diffuse the “blob” referred to above…
Now the reason I ended the quote at that point is because your complete second sentence in that paragraph mixed and jumbled two topics. That is, you find the topics so confusing that you blended two different topics in one sentence. Here’s your paragraph in its entirety:
It covers a lot of territory. Averaging it would diffuse the “blob” referred to above, had Bob bothered to focus on the period in question – 2013-14 instead of excluding that period. Most of Bob’s charts were from January 1989 to December 2012. I don’t know what he was thinking. The authors were writing about the 2013-2014 California drought. Bob did include this chart:
The first topic was area. The second was time, which I’ll get to in a moment.
Using an area that was larger than the blob can reduce the long-term and short-term variations. So in that respect, you were right with your “Averaging it would diffuse the ‘blob’ referred to above…”
But you forgot to note that the sea surface temperatures in that region cooled, not warmed, from 1989 to 2012. Does that mean the larger area I used showed less cooling than the blob region? If I was one of your readers, I’d be asking that question. The other question I’d be asking was, why didn’t Miriam show us why it was bad to use the larger region?
The map in Figure 2 shows the average sea surface temperature anomalies from July 2013 to June 2014 for the region I presented in my earlier blog post. The blob stands out quite plainly in that map. Yup, it looks like my larger area would have damped the impact of the blob. So we’ll use the coordinates of 30N-55N, 160W-130W for the sea surface temperature data of the blob region.

Figure 2
Figure 3 compares the sea surface temperature anomalies and cooling rates of the eastern extratropical North Pacific (the region I presented in my earlier post) and the blob region. Again, I’m ending the data in this graph the year before the blob appeared. The sea surface temperature anomalies of the blob region show more monthly volatility and they also show a higher cooling rate from 1989 to 2012. The cooling rate of the blob region is more than twice that of the larger region I presented in my earlier post.

Figure 3
Hmm. I don’t believe we have to wonder why you elected not to show that, Miriam.
Let’s add the last year and a half of data…the time of the blob. The last year and a half doesn’t cause a warming trend. See Figure 4. All the blob did was stop the cooling in the blob region.

Figure 4
But what about the models that Swain et al. used for attribution? See Figure 5. The models show the sea surfaces of the blob region should have warmed about 0.7 deg C in the 24 years from 1989 to 2012. But, in the real world, the sea surface temperatures there cooled.

Figure 5
And you don’t find the disparity between the models and reality important, Miriam? Remarkable. Simply remarkable. If the models can’t explain the cooling, the models cannot be used to explain the warming. It’s that basic, Miriam.
EXAMPLE 7 OF WHY I FIND YOUR POSTS SILLY
Let’s continue with the paragraph that you appeared to jumble, Miriam. You wrote in continuation:
… had Bob bothered to focus on the period in question – 2013-14 instead of excluding that period. Most of Bob’s charts were from January 1989 to December 2012. I don’t know what he was thinking. The authors were writing about the 2013-2014 California drought.
It’s pretty obvious what I was thinking, Miriam. I was showing that there was no evidence of the impacts of manmade greenhouse gases on the surface temperatures of the eastern extratropical North Pacific, or on the North Pacific as a whole, for almost 2.5 decades leading up to the unusual warming. Yet Swain et al. found evidence of human-induced global warming in the virtual worlds of climate models…which blatantly have no relationship with the real world. I thought that was so obvious that I didn’t have to spell it out. Next time, I’ll spell it out for you, Miriam, so you can grasp the obvious point I was making.
I further explained what I was thinking in my earlier post, but apparently you missed it, Miriam. Here, let me repeat it for you:
It’s tough to employ climate models so you can claim that manmade greenhouse gases caused the California drought, when the models used by Swain et al. can’t simulate the lack of warming of one of the key metrics associated with it.
That key metric is sea surface temperature, Miriam. And as you now know, sea surface temperatures are coupled to the atmosphere…that is, the Triple-R is associated with the blob in sea surface temperatures and the blob is associated with the Triple-R.
EXAMPLE 8 OF WHY I FIND YOUR POSTS SILLY
You repeatedly stated that you didn’t think I even read Swain et al., Miriam. One of your headings read:
Bob Tisdale probably didn’t read the paper
And later in your post:
Reading Bob’s article I have to wonder if he even read the paper.
I obviously read Swain et al., Miriam. How do we know? I presented the outputs of the three climate models they employed. Also, in the comments on the thread at WattsUpWithThat, I asked if anyone had found a link to the supplementary materials referred to in Swain et al. And, Miriam, if I hadn’t read Swain et al., how would I have known to present the sea surface temperatures for the region of the North Pacific under the Ridiculously Resilient Ridge?
You simply fabricate stuff, and I really enjoy that. You have no qualms about making statements regardless of whether there’s any truth behind them.
EXAMPLE 9 OF WHY I FIND YOUR POSTS SILLY
As part of your “Disclaimer and further reading”, you wrote (my boldface):
I think I’ve got the gist of it but please point out if you think I’ve gone astray anywhere.
When I read that, I was immediately reminded of the harassment you gave a newcomer to your blog recently. After lurking there, that blogger tried to offer some corrections, noting where you had “gone astray” in another of your posts. He was so frustrated by your rude response to him that he archived that thread with his comments, thinking (correctly) that you’d delete his replies, and he posted a comment at my blog.
My post was Data Reveal Florida Keys Sea Surface Temperatures Haven’t Warmed in 80+ Years*. It was cross posted at WattsUpWithThat here. Your mistake-filled response, Miriam, was the post Perennially Puzzled Bob Tisdale surfs the surface at Florida Keys. The archived copy of your post is here. The blogger’s name was 7DaBrooklynKnight7. His questions and comments start at September 13, 2014 at 1:33 AM in the archived version. After you insulted that newcomer to your blog, his final comment on that thread was:
wow. i will happily go elsewhere, sou. there is no reason for a newcomer (like me) to ask questions of someone so rude (like you).
i tried nicely to show you where your article is wrong and you keep repeating skin temperature. hadisst is not skin temperature data; it is sea surface temperature data. the data from the paper (figures 2 and 3) you’ve shown above in your article is Sea Surface Temperature data. the y-axis in both figures reads SST. maybe it’s you who needs “remedial arithmetic services or personal tuition in climate science and oceanography for dummies”.
something else you’ve overlooked. are the data from the lighthouses and from the buoys included in the hadisst data?
i may not be a skeptic but i am now skeptical of what you call science, sou. i will happily go elsewhere. maybe tisdale will answer my questions. his series of posts about el nino this year were easy to understand and accurate. they were educational. i noticed you didn’t try to question those. he is building his credibility by helping people understand. you are not. you seem intent on hiding the truth and that destroys your credibility.
Do you remember that blogger, Miriam? Not too surprisingly, Miriam, you deleted his last comment. It no longer exists on that thread. It now reads:
This comment has been removed by a blog administrator.
And now you’d like visitors to your blog to, as you said, point out if they think you’ve gone astray? I almost spritzed coffee on my keyboard this morning when I read that. Thanks for the belly laugh, Miriam.
But that’s not the best.
EXAMPLE 10 OF WHY I FIND YOUR POSTS SILLY
As part of many of your posts, you’ll copy and post portions of the comments made by visiting bloggers on the threads at WattsupWithThat and you’ll criticize what the visitors wrote. Every now and then you’ll find a comment you agree with. As a preface, in the above, under the heading of EXAMPLE OF WHY I FIND YOU’RE FUNNY 2, I explained why I included sea surface temperature data in that post, Miriam, while Swain et al. dealt with geopotential height. The two metrics are interrelated—they’re coupled.
You copied a comment by blogger Barry on the thread at WattsUpWithThat. Barry wrote (my boldface):
Bob, if you read Chapters 3 and 4 of the BAMS report, they both indicate that the CA drought cannot be attributed to the long-term warming trend, which seems to align with your argument. The Swain et al. paper, though, does not make a case based on sea surface temperatures, but rather geopotential height and wind anomalies (the high pressure ridge).
What Barry overlooked was the fact that the sea surface temperatures in the eastern extratropical North Pacific hadn’t warmed in 24+ years, and cooled from 1989 to 2012, so the other two papers he referred to did not agree with my post if they were discussing a long-term warming trend. There was no warming in the North Pacific for 24+ years.
That aside, you wrote about Barry’s comment (your boldface):
Barry is the first person to point out that Bob got it all wrong:
That implies that you believe Barry is correct. But Barry wrote, “…if you read Chapters 3 and 4 of the BAMS report, they both indicate that the CA drought cannot be attributed to the long-term warming trend.” Barry’s comment undermines the basic premise of your post, Miriam. The title of your post is “Human influence on the Californian drought.”
Visitors to your blog have to wonder why they wasted their times reading a 3000-word post, with you yakking about this and that, making stuff up, admitting you didn’t know what you were talking about, when in the end you contradict yourself by implying Barry got it right. Thank goodness I had put down my coffee by that point.
CLOSING
Once again, thank you, Miriam, for admitting you had no understanding of the subject matter. Every time I stop by your blog to see what you’ve written about one of my posts, I discover once again that you have little grasp of the topics. I find that very entertaining. And, the fact that there are visitors to HotWhopper who agree you…that’s the icing on the cake.
If I could make a suggestion, you may want to consider changing the name of your blog to HotWhopperIsClueless. That would be a perfect fit for your blog.
I sent an email to another “fan” of yours, Miriam, and let that blogger know I was writing you an open letter. That blogger emailed back:
I would add something like “Miriam O’Brien is professional consultant for businesses and boards of directors in Australia, where the stakes of being wrong are very high. So it is puzzling that she doesn’t do the most basic homework on some of these issues before she launches attacks and vitriol. While she might score some tribal points for attacking people, it certainly does not enhance her professional credibility.”
Would you like to guess who wrote that Miriam? I’ll give you two guesses.
Sincerely,
Bob Tisdale
PS: One more comment, Miriam. You threw what you thought was a jab about my understandings of the long-term effects of ENSO. You wrote:
But then again, Bob thinks that global warming is caused by ENSO. We’re used to mistakes made by perennially puzzled Bob Tisdale.
You must be aware that I’ve been showing the flaws in your perennially puzzled post for more than half a decade, Miriam. Yet, in response to my data-filled posts, you simply repeated the flawed arguments. Basically, you’ve used the absurdly funny contradiction approach to argument, reminiscent of the Monty Python sketch. You really crack me up, Miriam. Thanks.
You must also be aware that data support my understanding of ENSO, Miriam. I’ve been presenting it for more than 5.5 years. Sea surface temperature data support it. Ocean heat content data support it. Sea level data, trade wind strength and direction data, precipitation data, cloud cover data, ocean current data, lower troposphere temperature data, sea level pressure data, warm water volume and depth-averaged temperature data for the equatorial Pacific, etc., all support my understandings of ENSO. I’ve animated many of those metrics to show their relationships with ENSO, Miriam, so people could watch and learn.
Last year, Dr. Kevin Trenberth of NCAR jumped on the bandwagon and began saying that ENSO contributes to long-term global warming. In addition to being a loyal advocate of the hypothesis of human-induced global warming, Dr. Trenberth is also a world-renowned expert on ENSO. And he now says that El Niño events cause global warming…not that they’re caused by global warming. Here’s the kicker, Miriam. Dr. Trenberth has also written in at least two peer-reviewed papers that El Niños are fueled by sunlight.
Just in case you missed it, I provided an overview of Dr. Trenberth’s new understandings of ENSO in my post The 2014/15 El Niño – Part 9 – Kevin Trenberth is Looking Forward to Another “Big Jump”.
# # #
UPDATE: It took about a day and some coaxing, but over at HotWhopper, Miriam O’Brien responded to my post, admitting again that she still had no idea what I was talking about…even though I spent a good amount of time explaining. Her “Huh?” and “Huh (again)” are classics.
See the archived version of Miriam’s consecutive comments at October 6, 2014 at 12:32 PM and 12:51PM here. She continued her rant on the next thread, replying to a skeptical blogger who made an appearance at HotWhopper. See Miriam’s October 6, 2014 at 10:34 PM comment here. (Thanks for coming to my defense blogger “LongIslandSound71”. Your comments to WebHubTelescope are spot on, too.)
Jimbo quoted from the IPCC’s report, and here is a quote the NY Times, from 1994.
“BEGINNING about 1,100 years ago, what is now California baked in two droughts, the first lasting 220 years and the second 140 years. Each was much more intense than the mere six-year dry spells that afflict modern California from time to time, new studies of past climates show. The findings suggest, in fact, that relatively wet periods like the 20th century have been the exception rather than the rule in California for at least the last 3,500 years, and that mega-droughts are likely to recur.”
http://www.nytimes.com/1994/07/19/science/severe-ancient-droughts-a-warning-to-california.html
In 1994 the NYT was either less involved in climate campaigning, or science surreptitiously slipped by the gatekeepers. (Note the Triple-S.)
Oh, and Pete, you aren’t qualified to judge comments on women unless you understand the difference between someone who truly anti-women and and someone who is clearly only being anti-wench.
The fact that you seem to feel the need to attack ONLY the comments that apply to her gender, and have ZERO defense for her actual arguments, reeks of a misogynistic belief that her gender is the only ” weakness ” you see being mentioned here that elicited a response from you.
This paper published by the AMS in 2013 predicted that AGW will increase winter precipitation in California. This was allegedly a ”robust feature” in CMIP5 simulations.
Now the same CMIP5 models are used to justify the claim that AGW caused the “unusually low” winter precipitation in California.
It would be more impressive if the models could tell beforehand whether California gets wetter or drier. It’s less impressive to speculate afterwards how AGW did it, even though we predicted it would do the opposite.
Thanks for the link, ilmastotiede. They’ve got the bases covered, now, don’t they? Too much precipitation, there are papers for that. Too little precipitation, there are papers for that. No change in precipitation, there are papers for that, too. That’s one of the reasons why I love climate science.
That is their MO. Produce mountains of papers contradicting each other then sit and wait. No matter what happens they will say “the models predicted it”. This is akin to climastrology voodoo played on gaming machines.
Don’t take Slandering Sou’s attacks personally Bob. She is a sniper bent on denigrating all who she disagrees with. When I posted about Kivalina Island that is in the Chukchi Sea, I used the record extent of sea ice to the south in the Bering Sea plus the only two PSMSL tidal gauge date one from the Beaufort and from the Bering Sea. Although I never ever said Kivalina was in either one of those sea, Slandering Sou twisted it with headlines that I do not know my geography. When I posted about the restoration efforts in Florida that could account for any changes in the mangroves range,
http://landscapesandcycles.net/mangroves–hijacking-another-conservation-success.html
She focused on one region to the south to again use the ignorance of geography attack. She accused me of not examining all the evidence but she herself ignored data that the mangroves were much further north in the 60s than they are today. When I posted about the Texas Heat Waves in which climate scientists reported there was no warming, she turned it into me denying warming. When I responded to he misinterpretations she deleted several posts to maintain just her twisted view. I realized it was pointless to ever hope for an honest discussion with Slandering Sou.
But its not just skeptics, she has attacked and pissed off a former moderator of RealClimate because he exposed some bad science and he regrets ever visiting her website. She has shown absolutely no integrity and acts as if her life depends on catastrophic global warming being a reality. As she so often to brands others, she is a real “nutter”.
I had a post up on IPCC ‘predictions’. I went over to her blog when she covered it. She insisted I accept her point of view otherwise I would not be allowed to comment further. I told here she must accept my point of view and told here to basically piss off.
How did ‘her’ turn to ‘here’? Grrrrr.
[But, how does “Her is Sou” make more sense? 8<) .mod]
I may have an explanation–it appeared in today’s Sunday edition of the “literature pages” in the form of B.C. by Mastroianni and Hart.
It shows Peter grabbing a tablet and writing “Humanity shall extinguish itself in a smoldering plume of toxic ash”. He then throws it into the ocean and watches it swim off.
After sitting up all night, the next day Peter sees a response tablet coming his way. It says: “Have you tried the patch?”
MOD, the mistakes I made are in bold.
“I told here she must accept my point of view and told here to basically piss off.”
jim Steele, I don’t take Miriam’s attacks personally. I actually find her entertaining. Reading her posts really does make me laugh.
Cheers.
Laughing at what they say, when their intention is to hurt, is the worst thing for them. It enrages them even more.
And the only response is to laugh more.
I dont get the attention devoted to this moonbat Cultist!
Her whole site is about whopping WUWT. And she references Lewandowski which tells you all you need to know about her veracity… not even counting the heavy use of ‘denier’
Just use one liner ‘fisking’ with links.
I’ve never seen a more appropriately named blog. It is one hot whopper after another there. Perhaps I misunderstand and that she’s actually a very successful fiction blogger. That doesn’t explain the serial stalking of site owners she disagrees with, though. Her name should be offered to SNL on the chance they’re looking for a role model for a GF from Hell skit.
…and what’s funny is that they’re so self-absorbed, so brainwashed, they don’t even recognize it!
For Miriam, the issues are not the issue. She creates controversy in order to draw attention to herself, is extremely sensitive to criticism, and among other things, has rules which only she knows and then attacks others for breaking them. On the other hand, she sees herself as exempt from common rules of civil discussion.
I suspect she may suffer from Borderline Personality Disorder.
bonanzapilot,
No ‘borderline’ about it.
May be she has been “Thunder Struck” as in the you tube cover by steve’nseagulls
Cool tune 🙂
Miriam and Obama have the same personality disorder.
Commenting on commenters on another site is of course cowardly… and they don’t have much other choice. I’ve seen time and again on this site, when warmists put forth their arguments and get ripped to shreds by data and facts, no name calling or vitriol needed. They simply can’t stand up to scrutiny. So the only thing they can do is to hide behind their own little blog and take pot shots at individual commenters.
She cherry picks silly comments / jokes or sarc at WUWT and presents them as being representative. They are never a random selection you will note. There are so few visitors at her site that there is little to gain in traffic.
From Psychcentral
Frantic efforts to avoid real or imagined abandonment.
A pattern of unstable and intense interpersonal relationships characterized by alternating between extremes of idealization and devaluation.
Identity disturbance, such as a significant and persistent unstable self-image or sense of self.
Impulsivity in at least two areas that are potentially self-damaging (e.g., spending, sex, substance abuse, reckless driving, binge eating).
Recurrent suicidal behavior, gestures, or threats, or self-mutilating behavior.
Emotional instability due to significant reactivity of mood (e.g., intense episodic dysphoria, irritability, or anxiety usually lasting a few hours and only rarely more than a few days).
Mr. Tisdale — I have no doubt that your points are correct, and, of course, you have the right and obligation to defend yourself from unfair criticism. Still, I didn’t like the tone of this piece. It was unnecessarily nasty IMHO.
It appears to be an attempt at writing in-kind. If so it was wonderfully successful.
The tone was unnecessarily mild IMHO. This is climate war not climate nice.
David in Cal, my post was nasty?
I won’t pretend to speak for everyone, and I’m certain there are those like David in Cal who think you may have over done it. However, I agree with Jimbo that this is a war now, and we must treat it as such. It’s not a simple debate anymore. Whether we win or not *will* affect our livelihoods and our standards of living, and possibly even more so for a great many more who are not there yet, but want and have the right to develop their resources to attain it. This doesn’t mean we have to sling mud like they (warmists, warmistas, warmunists, illusionists, delusionists, whatever title that suits) do, but I think what you did and how you did it was warranted, and I think many others share that view. As long as at core of our position is facts and empirical data.
Bob, I do understand the need to point out the color of the blemishes on the skin of the emperor without clothes….
Good job.
How do you manage to write so much good stuff faster than I can read and appreciate it? I just bought your Who Turned Up the Heat? at the new, incredible bargain price and have started working my way through it to great profit in personal knowledge.
You’re right. Who Turned Up the Heat? is worth reading at 5X the price. An incredibly smart book.
Thanks for the kind words about “Who Turned on the Heat?”, Alan Watt, Climate Denialist Level 7 and thank you, too, policycritic.
Cheers
RE: rgbatduke 10/5 at 9:20 am
Concisely stated and highly focused, rgb
If important bits are left out of a model, then the training process will give unimportant bits much greater weight than deserved so as to force fit the training result.
Very amusing. John von Neumann proven wrong. The elephant can be made to wiggle his trunk and wink with only four. Odd that he’d make such an elephantine curve mistake…
rgb
Whopper
noun
1. big lie, fabrication, falsehood, untruth, tall story (informal), fable
http://www.thefreedictionary.com/whopper
I went to that Hotwhopper post about “Perennially Puzzled…” and she writes this gem of total lack of self-awareness.
Holy crap.
I followed one of the links to Hot Whopper where this was a heading.
Is the lack of self-awareness really this bad?
Is this Sou? The profile of Miriam matches the one at HotWhopper.
Miriam O’Brien Consulting
http://www.miriamobrienconsulting.com/aboutus.php
http://www.miriamobrienconsulting.com/art/mob/miriamsmall.jpg
I think she should add Hedging and Insurance to her risk management class.
If it is the government work may be drying up with the new regime. I imagine that would be quite annoying!
Here is Sou?
http://www.miriamobrienconsulting.com/aboutus.php
Just checked in on her article on the CA drought- as everyone already predicted, she not only did not learn one Damned thing, she has doubled-down on Stupid.
It’s great to see her ignorant opinions confronted with humor and FACTS! Well done and thanks Bob Tisdale.
Is Sou pronounced Sow as in a sow, suckling her piglets?
I think you being a little hard on O’Brien, after they are working to ‘acceptable ‘ standards for climate ‘science ‘ as set by Mann , Jones etc who made it clear that a lack of ability , knowledge or honest is in no way a negative thing in this area .
Some people see things through objective eyes. Some allow bias to influence their perceptions. Many don’t bother to look at all and just rely on others to decide for them. It is the latter group that seem to hold the strongest opinions. The more evidence you present the more desperate they become. If you disprove the beliefs of the people they rely on for their opinions, they might have to start thinking for themselves and make a decision. Nothing frightens them more.