Allan MacRae says: Thanks to Alberta Jacobs
2
1
vote
Article Rating
Kadaka
Jupiter, on the other hand, is 318 times as massive as Earth. Therefore, the barycenter of Jupiter and the Sun is a bit further from the Sun’s center. So, as Jupiter revolves around the Sun, the Sun itself is actually revolving around this slightly off-center point, located just outside its surface.
The barycenter “wobble” gives us a way to find planets around other stars.
Thus, a planet the size of Jupiter will make its star wobble a tiny bit. This picture shows you that the center of mass of a star and the barycenter of a star and a planet can be slightly different points.
http://spaceplace.nasa.gov/barycenter/en/barycenter.en.gif
http://spaceplace.nasa.gov/barycenter/en/
ren says:
August 13, 2014 at 8:43 am
Jupiter, on the other hand, is 318 times as massive as Earth. Therefore, the barycenter of Jupiter and the Sun is a bit further from the Sun’s center. So, as Jupiter revolves around the Sun, the Sun itself is actually revolving around this slightly off-center point, located just outside its surface.
Consider a double star system with both stars having the same mass. Each star is then ‘actually’ orbiting their common barycenter which is halfway between the two stars, but an observer on either star would not feel a thing. Orbiting a barycenter position, no matter where, has no effect on either star, or on the Sun [for the Sun-Jupiter system].
kadaka (KD Knoebel) says:
“Why did the little yellow Tweety bird lose a Twitter war with Sylvester the cat?”
No not all, I don’t like using twitter.
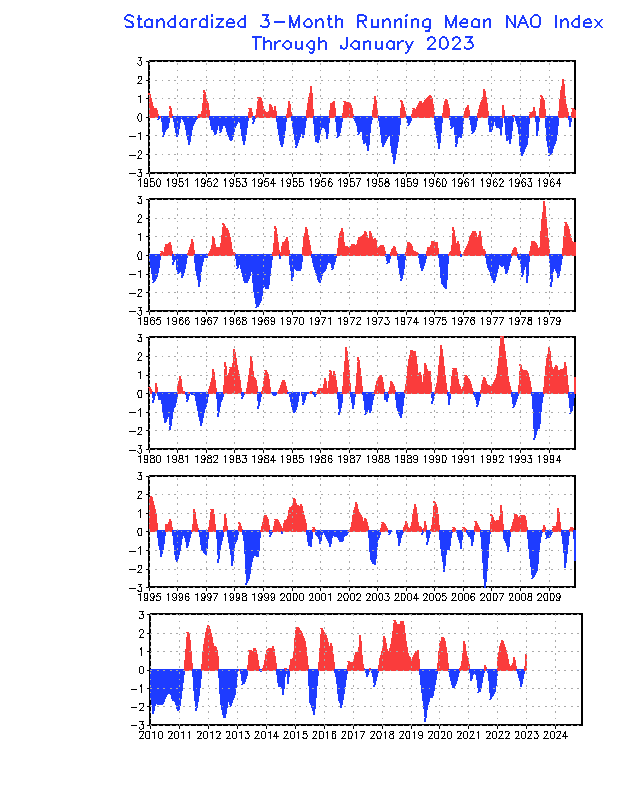
“So from the heights of 1979 at the start of the satellite record, there was a positive NAO regime during the ongoing extent losses to about 1995… Wait, that can’t be right, you said it was negative NAO.”
There was a very positive NAO late 1978 which is why the ice extent peaked then. Cherry picking that start point doesn’t prove anything about the trend up to 1995, why not start earlier in the 1970’s: http://snag.gy/gSIaw.jpg
The Arctic ocean cooled from late 1979 to early 1995: http://snag.gy/mfOI7.jpg
As did the heat content of the high Atlantic:
http://bobtisdale.files.wordpress.com/2012/10/4-northern-no-atl.png
The acceleration of sea ice loss is in two steps, from 1995-1998, and from 2005 onwards (albeit with a slight recent respite due to moderately more positive NAO conditions in the last ~2yrs):
http://arctic.atmos.uiuc.edu/cryosphere/IMAGES/seaice.anomaly.arctic.png
“The acceleration of sea ice loss is in two steps, from 1995-1998, and from 2005 onwards ”
Rate of ice loss was increasing until somewhere around 2007 when it started slowing.
http://climategrog.wordpress.com/2013/09/16/on-identifying-inter-decadal-variation-in-nh-sea-ice/
@kadaka
I forgot the NAO link, increased negative NAO 1995-1998, and 2005 onwards:
http://www.cpc.ncep.noaa.gov/products/precip/CWlink/pna/nao.timeseries.gif
Salvatore Del Prete says:
August 13, 2014 at 8:05 am
The reality is sunspot activity and solar magnetic activity was at an all time high through out last century
No so. Solar activity has been about equally high in each of the last three centuries.
Greg Goodman says:
August 13, 2014 at 9:33 am
“Orbiting a barycenter position, no matter where, has no effect on either star…”
… insofar as the bodies can be treated as point masses.
Just make the distance between the stars large enough. For small distances, tidal effects become important, but they do not depend on where the barycenter is, only on the ratio between the diameter and distance.
Dr. Svalgaard says: produce a paper !
Greg Goodman says: there’s a rather big “oops” behind all this !
Pamela Gray says: Vuk keeps secrets!
I mention a back extrapolation to 1700, so let’s see how it compares with the AMO/NAO.
There is also Mann’s reconstruction (I’ll show that on another occasion), however the rainfall in British isles is well correlated to the AMO; a stalagmite proxy from Scotland :
(ftp://ftp.ncdc.noaa.gov/pub/data/paleo/treering/reconstructions/amo-gray2004.txt
data scaled down by factor of 4)
correlation with the GSO 1710-1815 looks good, but it totally fails during the Dalton minimum.
Miss Gray tells us it is the burst of volcanic activity, managed to cool instantly the ocean surface, no evaporation in the N. Atlantic no rain, but the geo-solar magnetic oscillations suggest positive AMO for the period.
However, there is another well known N. Atlantic variable, the NAO (often in and out of phase with the AMO), reconstruction from C. Folland –MetOffice
data: ftp://ftp.ncdc.noaa.gov/pub/data/paleo/treering/reconstructions/snao-folland2009.txt )
Indeed the NAO-GSO correlation at time of Dalton confirms the fact that Dalton SST fell because of the volcanic eruptions at the time.
Comparison result is shown here:
GSO-AMO-NAO-reconstructions 1700+
Thus:
@ur momisugly Dr. Svalgaard: I don’t bother with papers, data clearly shows that the Earth’s climate parameters responds to solar magnetic polarity input.
@ur momisugly Greg Goodman: there’s NO a big “oops” (may be a modest ‘wow’) behind all this !
@ur momisugly Pamela Gray: No secrets, the Dalton AMO was trashed by volcanic eruptions.
Ms Gray, congratulations; you win this contest.
Greg Goodman says:
“Rate of ice loss was increasing until somewhere around 2007 when it started slowing.”
These are the steps that correlate to the increased negative NAO episodes:
http://snag.gy/3mgZy.jpg
Ren
Thanks for the links.
Intensity of solar activity is closely synchronised with the periods when the Jupiter’s magnetosphere tail (once every 19.6) years links into the Saturn’s magnetosphere.
Leif Svalgaard says:
August 11, 2014 at 9:54 pm
“M Simon says:
August 11, 2014 at 9:52 pm
And yet low sun spot numbers correlate well with periods of cooling.
“Doesn’t look that way to me. The sunspot number is the lowest in a hundred years and the global temperature is at all-time highs”.
Leif, with all due respect but the claim you just made of lowest sunspot numbers in a hundred years and all time global temp records is flabbergasting from my point of view and hopefully also from the view of WUWT crowd.
Your all time high global temperature claim is total BS of course and reflects the debunked hockey stick saga.
Nice to know which doctrine you really support.
R. de Haan says:
August 13, 2014 at 11:26 am
Global temperature was higher than now c. 1000, 2000, 3000 & 5000 to 8000 years ago. It was probably also higher during the 1930s-40s, but the books have been thoroughly cooked to a crisp, so can’t be sure.
And of course the Eemian & other previous interglacials were warmer than the Holocene, the Pliocene was warmer than the Pleistocene, the Miocene warmer than the Pliocene, at least parts of the Oligocene warmer than the Miocene, the Eocene a lot warmer than the Oligocene, the Paleocene about as warm as the Eocene and parts of the Cretaceous even hotter still.
R. de Haan says:
August 13, 2014 at 11:26 am
Your all time high global temperature claim is total BS of course and reflects the debunked hockey stick saga.
We just need to go back a bit more than 100 years [to stay out of hockey-stick trouble]:
http://jameswight.files.wordpress.com/2010/07/global-land-temperature-reconstructions.png
You want to quibble with the data? The data that some people say support their notion that ‘it is the Sun, Stupid’. Keep me out of that.
Greg says
Since you’ve already figured it all out, perhaps you can explain it.
Henry says
This is the same old story. William Arnold picked up on it, 1985, I followed up on it and confirmed it, including the bending points on the ozone decrease/increase, as discussed earlier,
http://blogs.24.com/henryp/2013/04/29/the-climate-is-changing/
My results are there for everyone to read, if they want to. Ridicule me if you like, check the worry about that in my eyes?
I suspect Ulric also figured it out, since he is not open and honest with me about it [trying to hide it? until when?]
@Salvatore del Prete;
When you make a comment, tell us whom you are addressing it to. That makes the blog more interesting. Otherwise it looks like you are talking to yourself (using an another alias to answer your positions). Please stop this nonsense
FYI
It is globally cooling, from before the millennium. You should be able to work that out from the formulae at the end of each table;
http://blogs.24.com/henryp/files/2013/02/henryspooltableNEWc.pdf
It is either globally cooling or warming. There is no pause. There is no AGW, as my table for minima shows.
Leif Svalgaard says: August 13, 2014 at 11:05 am
You didn’t do that and you “don’t bother with papers”. I say ‘put up or shut up’.
…………….
Some you win, but this one you loose, science doesn’t stay still, new evidence tramps outdated views.
The evidence is in the data all the way back to 1700, and the NASA says there is the observational evidence as shown in their video presentation
There is also the LOD variability as shown from the data by Jeremy Bloxham from Harvard University, who just happen to be in the Ren’s Jupiter video (further up in the thread).
I hope you aren’t going to accuse him of fiddling the data.
Data here, there, everywhere… your honour the defence calls on ‘R. Feynman v.s. Crown’ case.
Greg says
Since you’ve already figured it all out, perhaps you can explain it.
Henry says
This is the same old story. William Arnold picked up on it, 1985, I followed up on it and confirmed it, including the bending points on the ozone decrease/increase, as discussed earlier,
http://blogs.24.com/henryp/2013/04/29/the-climate-is-changing/
My results are there for everyone to read, if they want to. Ridicule me if you like, check the worry about that in my eyes?
I suspect Ulric also figured it out, since he is not open and honest with me about it [trying to hide it? until when?]
@SdP;
When you make a comment, tell us whom you are addressing it to. That makes the blog more interesting. Otherwise it looks like you are talking to yourself (using an another alias to answer your positions). Please stop this nonsense
FYI
It is globally cooling, from before the millennium. You should be able to work that out from the formulae at the end of each table;
http://blogs.24.com/henryp/files/2013/02/henryspooltableNEWc.pdf
It is either globally cooling or warming. There is no pause. There is no AGW, as my table for minima shows.
Greg says
Since you’ve already figured it all out, perhaps you can explain it.
Henry says
This is the same old story. William Arnold picked up on it, 1985, I followed up on it and confirmed it, including the bending points on the ozone decrease/increase, as discussed earlier,
My results are there for everyone to read, if they want to. Ridicule me if you like, check the worry about that in my eyes?
I suspect Ulric also figured it out, since he is not open and honest with me about it [trying to hide it? until when?]
@Salvatore del Prete;
When you make a comment, tell us whom you are addressing it to. That makes the blog more interesting. Otherwise it looks like you are talking to yourself (using an another alias to answer your positions). Please stop this nonsense
FYI
It is globally cooling, from before the millennium. You should be able to work that out from the formulae at the end of each table;
http://blogs.24.com/henryp/files/2013/02/henryspooltableNEWc.pdf
It is either globally cooling or warming. There is no pause. There is no AGW, as my table for minima shows.
Without any comment: http://chiefio.wordpress.com/2014/08/04/what-a-coincidence/
R de Haan [must be a clever dutchman like me]
says
of Leif Svalgaard:
Nice to know which doctrine you really support.
Henry says
You got that right. Anyone can/should be able to figure out that it is globally cooling
http://blogs.24.com/henryp/files/2013/02/henryspooltableNEWc.pdf
and that there is no AGW
following the correct sampling technique
http://blogs.24.com/henryp/2013/02/21/henrys-pool-tables-on-global-warmingcooling/
but he has to find a way to keep the money rolling [into his pocket]?
In a recent paper “The Centennial Gleissberg Cycle and its Association with Extended Minima”, to be soon published in JGR/Space, Feynman and Ruzmaikin discuss how the recent extended minimum of solar and geomagnetic variability (XSM) mirrors the XSMs in the 19th and 20th centuries: 1810–1830 and 1900–1910.
Edited abstract:
Such extended minima also were evident in aurorae reported from 450 AD to 1450 AD. The paper argues that these minima are consistent with minima of the Centennial Gleissberg Cycles (CGC), a 90–100 year variation observed on the Sun, in the solar wind, at the Earth and throughout the Heliosphere. The occurrence of the recent XSM is consistent with the existence of the CGC as a quasi-periodic variation of the solar dynamo. Evidence of CGC’s is provided by the multi-century sunspot record, by the almost 150-year record of indexes of geomagnetic activity (1868-present), by 1,000 years of observations of aurorae (from 450 to 1450 AD) and millennial records of radionuclides in ice cores.
The “aa” index of geomagnetic activity carries information about the two components of the solar magnetic field (toroidal and poloidal), one driven by flares and CMEs (related to the toroidal field), the other driven by co-rotating interaction regions in the solar wind (related to the poloidal field). These two components systematically vary in their intensity and relative phase giving us information about centennial changes of the sources of solar dynamo during the recent CGC over the last century. The dipole and quadrupole modes of the solar magnetic field changed in relative amplitude and phase; the quadrupole mode became more important as the XSM was approached. Some implications for the solar dynamo theory are discussed.
* Says The Hockey Schtick: If it is true that the current lull in solar activity is “consistent with minima of the Centennial Gleissberg Cycles,” and the Gleissberg Cycle is a real solar cycle, the current Gleissberg minimum could last a few decades before solar activity begins to rise again.
* Solar physicist Habibullo Abdussamatov predicts the current lull in solar activity will continue until about the middle of the 21st century and lead to a new Little Ice Age within the next 30 years.