Allan MacRae says: Thanks to Alberta Jacobs
From Ulric Lyons on August 12, 2014 at 6:07 pm:
I would call that disparaging flippancy rather than knowledge, you have no information by which to form an opinion, at least not that I have supplied, I have only made an offer to disclose my findings. But then if you had bothered to read my scribblings, you would be that much wiser.
You said, bold added: “I have identified the precise heliocentric planetary progression that causes solar minima.”
Apparent minimums and maximums are caused by the outer layers of the Sun modulating the constant output of the core. The only force the planets could exert on the Sun that is possibly worth mentioning is gravity. The Sun has 99.8% of all the mass in the solar system, most of the rest is Jupiter.
You would have to provide a mechanism whereby planetary movement controls the modulating of the core output by the outer layers, to substantiate that said planetary movement causes solar minimums. But this is like proposing how the regular dispersal of handfuls of rubber ducks onto a certain river will control the output of Niagara Falls.
Thus in that one line you did supply me with enough information to form an opinion, and the opinion was and is you’re spouting quackery. Further reading of your scribblings cannot improve that opinion, only the retraction of your obviously erroneous statement could help. The only way further reading could make me that much wiser, would be wiser in the ways of quackery and deception, presumably self-deception. And I can study more refined versions daily in climate science.
Thus I ignore you.
“2014 has featured a wet and cooler-than-average summer across a wide swath of the country from the central Plains to the mid-Atlantic, including the Northeast and Great Lakes. As children get ready to go back to school, some people are asking where all the summer warmth was and why was it so cool and wet?”
Air circulation in the lower stratosphere.
http://earth.nullschool.net/#current/wind/isobaric/70hPa/orthographic=-88.74,26.93,481
There will be no hurricanes in the Atlantic.
Leif Svalgaard says:
August 12, 2014 at 7:01 pm
Nothing had been discovered that overturns the 1977 view on this.
Produce a link to a paper that shows the ‘new discovery’ if you persist.
As usual, you do not know what you are talking about.
Your theoretical treatise from 1977, may have been at the time, the corner stone of understanding, then at the end of 2008 NASA’s Themis project comes with the series of observational data that contradict conclusions of your work. Such things happen all the time, nothing new about that.
It is not me, or anyone on this blog, and I would suggest that may include you, but it is the observational data which will decide (if it hasn’t already) what is the actual reality.
I’ll go with Feynman’s ruling….
In the west, US will be hot as in Africa. Meridional circulation.
http://earth.nullschool.net/#2014/08/17/0600Z/wind/isobaric/1000hPa/overlay=temp/orthographic=-88.74,26.93,481
Greg Goodman says:
………
You probably missed my earlier comment:
Its spectrum’s principal components are 9.1 and 64.5 years, which is more or less the AMO’s spectral composition.
http://wattsupwiththat.com/2014/08/11/a-gleissberg-solar-minimum/#comment-1707534
Aliasing frequency? You bet, there is!!
Interaction between variables all run by different clocks.
Solar magnetic input:
Carrington rotation of 27.2753 days
Ocean tidal system:
The draconic month 27.212days
The anomalistic month 27.554days
The tropical month 27.321 days
The sidereal month 27.321 days
Earth’s magnetic input:
The outer liquid core (generator of the magnetic field) also responds to the above luni-solar tides clock (as per A. Jackson, major expert in the field).
Energy input:
Solar insolation at 365.25 days
Monthly data averaged at a rate 11% longer than the luni-solar time base.
Data is synchronized with the energy input, but out of sync with factors controlling the energy distribution. .
From moreCarbonOK[&theWeatherisalwaysGood]HenryP (Henry Pool) on August 12, 2014 at 1:30 pm:
If you think I am here to listen wiseguys like you and Leif you are thoroughly mistaken. I am trying to educate you all on what is lying ahead of us. Note the first comment on this thread. It seems markstoval also figured it out.
From markstoval on August 11, 2014 at 12:18 pm:
(…) We have built our societies and infrastructure based on the mistaken belief that the climate could never return to that of the Little Ice Age but we might be very wrong in that. Feeding 7 Billion people in a little ice age will be demanding at best.
We have significantly advanced in agriculture since the previous Little Ice Age. Crop yields per worker have greatly increased from just mechanization. We have developed techniques like nutrient film hydroponics and even aeroponics that allow people to inexpensively grow their own food without tilling soil, even where they have no soil to till.
Feeding 7 billion people in a little ice age will not be demanding at all, from a capability standpoint. We could feed twice that many. What will be demanding then is the same thing making it demanding now, paying for it all, at sufficient levels of financial compensation to induce producers and distributors to continue supplying it.
What Mark Stoval was saying is the colder climate will make the feeding demanding. That is not the case.
And as for our societies and infrastructure, our building codes generally require greater insulation and weatherization than what was known in the LIA, we have more durable roads and snowplows, we have central heating and grid-supplied electricity. We even have safer food supplies, from improved canning to refrigeration to better food preservatives. We have 4×4 and all-terrain vehicles, and snowmobiles.
We have built our societies and infrastructure to far better withstand the possible conditions of a new little ice age than they were at the end of the last one. If the mistaken belief was we would never see those conditions again, it certainly doesn’t show.
You said it seemed Mark Stoval had figured it out. He’s wrong on both of his two major points. If you agree with him that is what’s to come and why, then you are also wrong.
Thanks Vuk’ , i had indeed missed that earlier post:
“Hi Greg
GeoSolar cycle is derived directly from geomagnetic field response to the solar activity.
Its spectrum’s principal components are 9.1 and 64.5 years, which is more or less the AMO’s spectral composition.”
This 9.1 is found everywhere ( until Hadley start messing with the spectral content of the data ).
It is a strong component in cross-correlation of N. Atl and N. Pacific SST. Scafetta finds it in Aurora data.
So what IS this “geomagnetic field response”? Give me something I plot and analyse, not words !
http://climategrog.wordpress.com/?attachment_id=754
NB refer to the text for accurate periods, graph is approximate cursor readout only.
http://climategrog.wordpress.com/?attachment_id=755
As I said above this period corresponds to the superposition of two periods of lunar origin 8.85 and 9.3y . That combo will produce a modulation frequency of about 365 _years_. Odd number, but that’s another storey.
If this is a prominent feature in some “geo-solar” magnetic effect, it would be very interesting to see how that could arise but I still have no idea what you are actually plotting and what the data source(s) is(are).
It’s a couple of years that you’ve been posting this graph, it’s long over due that you say _exactly_ what it is you are plotting, so others can reproduce it. Otherwise it becomes a joke.
Greg Goodman says:
August 13, 2014 at 1:53 am
It (9.1 years) is a strong component in cross-correlation of N. Atl and N. Pacific SST. Scafetta finds it in Aurora data.
…………..
Not surprised, it doesn’t come from the sun directly, it comes from the geo-solar (sun-earth) magnetic cycle
9.1 years is rock steady, while 64 when extrapolated back to 1700, it drifts in range 58-67 years .
GSC-spec
“The sunspot number is the lowest in a hundred years and the global temperature is at all-time highs.” – Leif Svalgaard
This sequence of flashbacks begins at a time in history when it was still safe to print a story titled “snowfalls are now a thing of the past” in a newspaper without being ridiculed.
==============
Scientists blame sun for global warming
BBC
February 13, 1998
Climate changes such as global warming may be due to changes in the sun rather than to the release of greenhouse gases on Earth.
Climatologists and astronomers speaking at the American Association for the Advancement of Science meeting in Philadelphia say the present warming may be unusual – but a mini ice age could soon follow.
==============
Sunspots reaching 1,000-year high
By Dr David Whitehouse (BBC)
July 6, 2004
A new analysis shows that the Sun is more active now than it has been at anytime in the previous 1,000 years.
Scientists based at the Institute for Astronomy in Zurich used ice cores from Greenland to construct a picture of our star’s activity in the past.
They say that over the last century the number of sunspots rose at the same time that the Earth’s climate became steadily warmer
==============
A First! Snow Falls in Baghdad
By CHRISTOPHER CHESTER (AP)
Jan 11, 2008
==============
Arctic blast brings London earliest snow for 70 years
Mark Prigg (Evening Standard)
Oct 10, 2008
It is a sight not seen in the capital since 1934.
Londoners today woke up to the earliest snow cover for more than 70 years as a freezing blast of wind from the Arctic hit the capital.
==============
Spokane, Washington., residents cope with record snow
By NICHOLAS K. GERANIOS (AP)
Jan 7, 2009
SPOKANE, Wash. (AP) – More than 6 feet of snow in the past three weeks has left Spokane residents frustrated. Tempers are so frayed that a man was arrested for shooting at a snow plow operator.
==============
The day the sea froze: Temperatures plunge to MINUS 12C and forecasters say it won’t warm up until Sunday
By Daily Mail Reporter
Jan 8, 2009
Temperatures plunged so low yesterday that the sea actually began to freeze as Arctic conditions continued to grip the UK.
In the exclusive enclave of Sandbanks in Poole, Dorset, a half-mile stretch along the shoreline reaching about 20 yards out to sea is covered in ice.
================
Where’s global warming?
By Jeff Jacoby, Globe Columnist
March 8, 2009
[…] The United States has shivered through an unusually severe winter, with snow falling in such unlikely destinations as New Orleans, Las Vegas, Alabama, and Georgia. On Dec. 25, every Canadian province woke up to a white Christmas, something that hadn’t happened in 37 years. Earlier this year, Europe was gripped by such a killing cold wave that trains were shut down in the French Riviera and chimpanzees in the Rome Zoo had to be plied with hot tea. Last week, satellite data showed three of the Great Lakes – Erie, Superior, and Huron – almost completely frozen over. In Washington, D.C., what was supposed to be a massive rally against global warming was upstaged by the heaviest snowfall of the season, which paralyzed the capital.
===================
‘Quiet Sun’ baffling astronomers
By Pallab Ghosh (BBC News)
April 21, 2009
The Sun is the dimmest it has been for nearly a century.
[…] In the mid-17th Century, a quiet spell – known as the Maunder Minimum – lasted 70 years, and led to a “mini ice-age”.
This has resulted in some people suggesting that a similar cooling might offset the impact of climate change.
According to Prof Mike Lockwood of Southampton University, this view is too simplistic.
“I wish the Sun was coming to our aid but, unfortunately, the data shows that is not the case,” he said.
=========
Children die in harsh Peru winter
By Dan Collyns (BBC News, Lima)
July 12, 2009
Almost 250 children under the age of five have died in a wave of intensely cold weather in Peru.
==========
‘Quiet’ sun could mean cooler days
STEPHEN CAUCHI (The Age)
September 13, 2009
THE number of sunspots has declined dramatically in the past two years – but scientists say it is too early to tell if it is the start of a solar depression that could lead to cooler weather on Earth.
Over the past millennium, whenever the sun has had long periods of low sunspot numbers, Earth has weathered equally long cold snaps. The most famous of these was the Maunder Minimum of 1645 to 1715, when sunspots all but vanished for 70 years. It coincided with the coldest period of the Little Ice Age.
For the past two years, sunspots – dark and intensely magnetic blotches on the sun’s surface – have been at their fewest since 1913.
============
Beijing’s Heaviest Snow in 54 Years Strands Thousand
Bloomberg News
Nov 12, 2009
[…] In Beijing, snowfall is the heaviest since weather data began in 1955, according to the administration’s Web site.
============
Heavy snow continues as temperatures set to plunge minus 20C
Herald, Scotland
Jan 6, 2010
Heavy snow has brought more chaos to parts of Scotland amid warnings that temperatures could plunge to minus 20C this weekend.
The prolonged Arctic blast is now the worst cold spell seen in Scotland for almost 50 years, according to the First Minister.
============
Quiet sun puts Europe on ice
New Scientist
May 4, 2010
[…] The research finds that low solar activity promotes the formation of giant kinks in the jet stream. These kinks can block warm westerly winds from reaching Europe, while allowing in winds from Arctic Siberia. When this happens in winter, northern Europe freezes, even though other, comparable regions of the globe may be experiencing unusually mild conditions.
Mike Lockwood at the University of Reading in the UK began his investigation because these past two relatively cold British winters coincided with a lapse in the sun’s activity more profound than …
============
Freeze Challenges Power Supply
(Xinhua, China)
Jun 1, 2010
Most parts of China were seized by a sustained cold snap Wednesday, when the minimum temperature hit a 40-year low in Beijing and a rare snowstorm in the central Hubei Province kept all school children at home.
The Beijing weather bureau said the capital had its lowest temperature in 40 years at daybreak Wednesday, when the low was minus 16.7 degrees Celsius.
============
BRITAIN FACES A MINI ‘ICE AGE’
By Laura Caroe (Express UK)
Oct 11, 2011
BRITAIN is set to suffer a mini ice age that could last for decades and bring with it a series of bitterly cold winters.
And it could all begin within weeks as experts said last night that the mercury may soon plunge below the record -20C endured last year.
Scientists say the anticipated cold blast will be due to the return of a disruptive weather pattern called La Nina. Latest evidence shows La Nina, linked to extreme winter weather in America and with a knock-on effect on Britain, is in force and will gradually strengthen as the year ends.
The climate phenomenon, characterised by unusually cold ocean temperatures in the Pacific, was linked to our icy winter last year – one of the coldest on record.
And it coincides with research from the Met Office indicating the nation could be facing a repeat of the “little ice age” that gripped the country 300 years ago, causing decades of harsh winters.
The prediction, to be published in Nature magazine, is based on observations of a slight fall in the sun’s emissions of ultraviolet radiation, which may, over a long period, trigger Arctic conditions for many years.
=============
US weather in pictures: ‘Polar vortex’ brings big freeze to North America
Telegraph UK
Aug 13, 2014
=============
http://en.wikipedia.org/wiki/2013%E2%80%9314_North_American_cold_wave
“The typical polar vortex configuration in November, 2013”
http://en.wikipedia.org/wiki/File:November2013_polar_vortex_geopotentialheight_mean_Large.jpg
“A wavy polar vortex on January 5, 2014”
http://en.wikipedia.org/wiki/File:Jan52014_polar_vortex_geopotentialheight_mean_Large.jpg
=============
And that’s only the tip of the Gleissberg.
kadaka (KD Knoebel) says:
“The only force the planets could exert on the Sun that is possibly worth mentioning is gravity.”
It’s not really worth mentioning, and as it happens, the nature of the configurations involved precludes any gravitational mechanisms.
“Thus in that one line you did supply me with enough information to form an opinion, and the opinion was and is you’re spouting quackery. Further reading of your scribblings cannot improve that opinion, only the retraction of your obviously erroneous statement could help.”
No it was not enough information to form an opinion, the erroneous statements and quackery are your own, by assuming that you know best about the mechanisms.
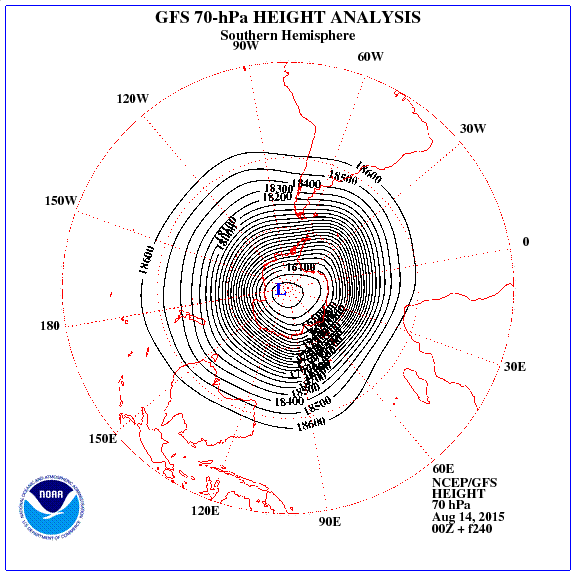
Predicted shape of the polar vortex on 23 August. Further cooling of the South Pacific. Blockade in the region of Australia.
http://www.cpc.ncep.noaa.gov/products/stratosphere/strat_a_f/gif_files/gfs_z70_sh_f240.gif
Vuk : “Not surprised, it doesn’t come from the sun directly, it comes from the geo-solar (sun-earth) magnetic cycle” ….. WHICH IS …. ????
Your reluctance to say exactly what it is that you plotted, despite numerous explicit requests is starting to look suspect.
I’m trying to take what you present seriously but it’s getting harder in the face of this constant evasion.
Greg.
Khwarizmi:
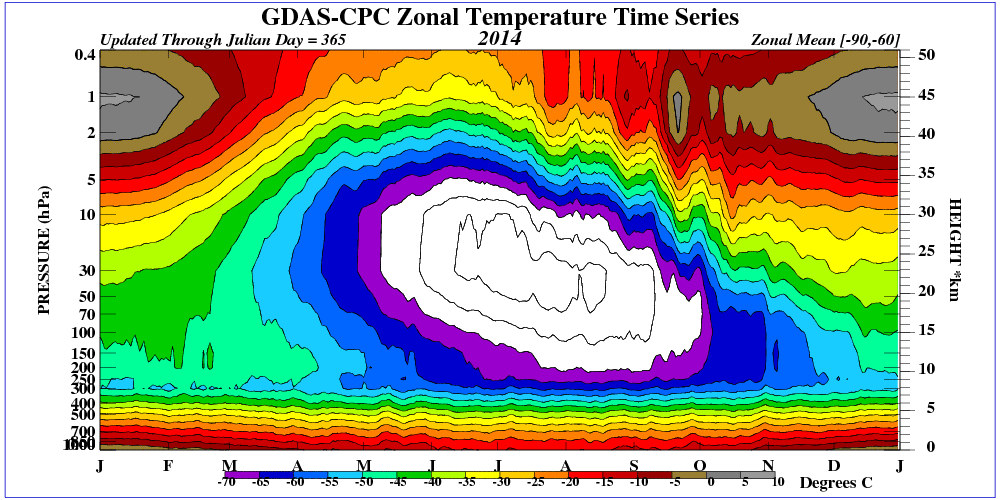
500 mb (hPa) is not the polar vortex, but the troposphere (about 5 km). Circulation at this altitude is consistent with the jet stream, which in the winter is strictly dependent on velocity (strength) of the polar vortex.
http://upload.wikimedia.org/wikipedia/commons/b/bb/Jan52014_polar_vortex_geopotentialheight_mean_Large.jpg
“Since polar vortices exist from the stratosphere downward into the mid-troposphere,[2] a variety of heights/pressure levels within the atmosphere can be checked for its existence. Within the stratosphere, strategies such as the use of the 4 mb pressure surface, which correlates to the 1200K isentropic surface, located midway up the stratosphere, is used to create climatologies of the feature.[7] Due to model data unreliability, other techniques use the 50 mb pressure surface to identify its stratospheric location.[8] At the level of the tropopause, the extent of closed contours of potential temperature can be used to determine its strength. Horizontally, most polar vortices have a radius of less than 1,000 kilometres (620 mi).[9] Others have used levels down to the 500 hPa pressure level (about 5,460 metres (17,910 ft) above sea level during the winter) to identify the polar vortex.”
http://en.wikipedia.org/wiki/Polar_vortex
Khwarizmi says:
August 13, 2014 at 4:00 am
I’m not sure what your list of newspaper article is supposed to show. There are one or two predictions which haven’t been borne out (yet) and a few cold weather related headlines. However, there have been plenty of warm weather records broken over the same period. For example
The CET is currently showing that, to date, 2014 is the warmest year on record.
From Ulric Lyons on August 13, 2014 at 4:52 am:
It’s not really worth mentioning, and as it happens, the nature of the configurations involved precludes any gravitational mechanisms.
Ah, so in your system it is planetary configurations that cause solar minimums, namely special ones where the gravitational effect of Jupiter is minimized.
Well why don’t you just come right out and say you’re talking about Astrology? I evaluated your statement like you were presenting real-world science. My mistake.
In a recent paper “The Centennial Gleissberg Cycle and its Association with Extended Minima”, to be soon published in JGR/Space, Feynman and Ruzmaikin discuss how the recent extended minimum of solar and geomagnetic variability (XSM) mirrors the XSMs in the 19th and 20th centuries: 1810–1830 and 1900–1910.
Edited abstract:
Such extended minima also were evident in aurorae reported from 450 AD to 1450 AD. The paper argues that these minima are consistent with minima of the Centennial Gleissberg Cycles (CGC), a 90–100 year variation observed on the Sun, in the solar wind, at the Earth and throughout the Heliosphere. The occurrence of the recent XSM is consistent with the existence of the CGC as a quasi-periodic variation of the solar dynamo. Evidence of CGC’s is provided by the multi-century sunspot record, by the almost 150-year record of indexes of geomagnetic activity (1868-present), by 1,000 years of observations of aurorae (from 450 to 1450 AD) and millennial records of radionuclides in ice cores.
The “aa” index of geomagnetic activity carries information about the two components of the solar magnetic field (toroidal and poloidal), one driven by flares and CMEs (related to the toroidal field), the other driven by co-rotating interaction regions in the solar wind (related to the poloidal field). These two components systematically vary in their intensity and relative phase giving us information about centennial changes of the sources of solar dynamo during the recent CGC over the last century. The dipole and quadrupole modes of the solar magnetic field changed in relative amplitude and phase; the quadrupole mode became more important as the XSM was approached. Some implications for the solar dynamo theory are discussed.
* Says The Hockey Schtick: If it is true that the current lull in solar activity is “consistent with minima of the Centennial Gleissberg Cycles,” and the Gleissberg Cycle is a real solar cycle, the current Gleissberg minimum could last a few decades before solar activity begins to rise again.
* Solar physicist Habibullo Abdussamatov predicts the current lull in solar activity will continue until about the middle of the 21st century and lead to a new Little Ice Age within the next 30 years.