Guest essay by Ken Gregory
See abstract and PDF version here.
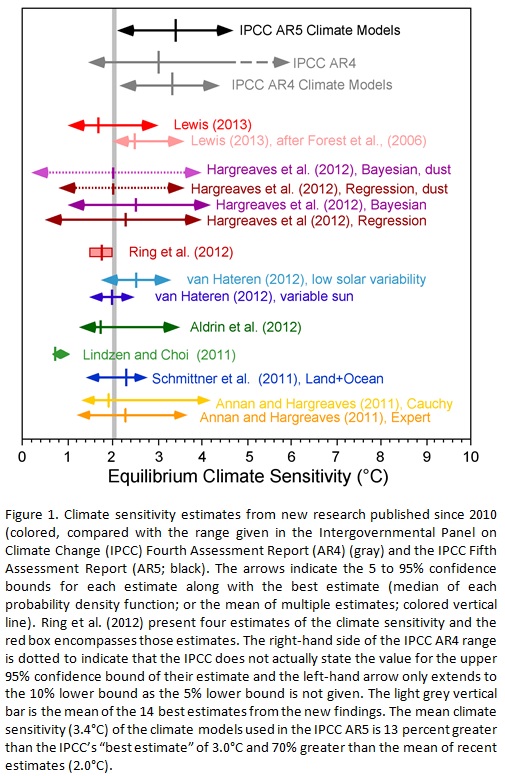
The determination of the global warming expected from a doubling of atmospheric carbon dioxide (CO2), called the climate sensitivity, is the most important parameter in climate science. The Intergovernmental Panel on Climate Change (IPCC) fifth assessment report (AR5) gives no best estimate for equilibrium climate sensitivity “because of a lack of agreement on values across assessed lines of evidence and studies.”
Studies published since 2010 indicates that equilibrium climate sensitivity is much less that the 3 °C estimated by the IPCC in its 4th assessment report. A chart here shows that the mean of the best estimates of 14 studies is 2 °C, but all except the lowest estimate implicitly assumes that the only climate forcings are those recognized by the IPCC. They assume the sun affects climate only by changes in the total solar irradiance (TSI). However, the IPCC AR5 Section7.4.6 says,
“Many studies have reported observations that link solar activity to particular aspects of the climate system. Various mechanisms have been proposed that could amplify relatively small variations in total solar irradiance, such as changes in stratospheric and tropospheric circulation induced by changes in the spectral solar irradiance or an effect of the flux of cosmic rays on clouds.”
Many studies have shown that the sun affects climate by some mechanism other than the direct effects of changing TSI, but it is not possible to directly quantify these indirect solar effects. All the studies of climate sensitivity that rely on estimates of climate forcings which exclude indirect solar forcings are invalid.
Fortunately, we can calculate climate sensitivity without an estimate of total forcings by directly measuring the changes to the greenhouse effect.
The greenhouse effect (GHE) is the difference in temperature between the earth’s surface and the effective radiating temperature of the earth at the top of the atmosphere as seen from space. This temperature difference is generally given as 33 °C, where the top-of-atmosphere global average temperature is about -18 °C and global average surface temperature is about 15 °C. We can estimate climate sensitivity by comparing the changes in the GHE to the changes in the CO2 concentrations.
The Clouds and Earth’s Radiant Energy System (CERES) experiment started collecting high quality top-of-atmosphere outgoing longwave radiation (OLR) data in March 2000. The last data available is June 2013 as of this writing on January 14, 2013. Figure 1 shows a typical CERES satellite.

Figure 1. CERES Satellite
The CERES OLR data presented by latitude versus time is shown in Figure 2.

Figure 2. CERES Outgoing Longwave Radiation, latitude versus date.
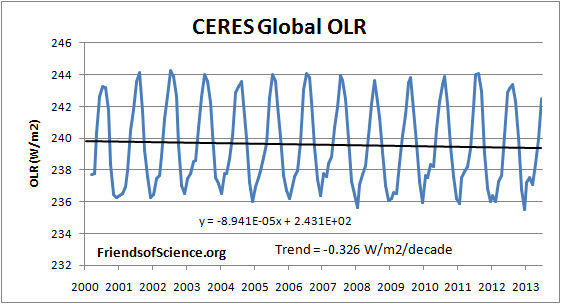
The global average OLR is shown in Figure 3.

Figure 3. CERES global OLR.
The CERES OLR data is converted to the effective radiating temperature (Te) using the Stefan-Boltzmann equation.
Te = (OLR/σ)0.25 – 273.15. where σ = 5.67 E-8 W/(m2K4), Te is in °C.
The monthly anomalies of the Te were calculated so that the annual cycle would not affect the trend.
We use the HadCRUT temperature anomaly indexes to represent the earth’s surface temperature (Ts). The HadCRUT3 temperature index shows a cooling trend of -0.002 °C/decade, and the HadCRUT4 temperature index shows a warming trend of 0.031 °C/decade during the period with CERES data, March 2000 to June 2013. The land measurement likely includes a warming bias due to uncorrected urban warming. The hadCRUT4 dataset added more coverage in the far north, where there has been the most warming, but failed to add coverage in the far south, where there has been recent cooling, thereby introducing a warming bias. We present results using both datasets.
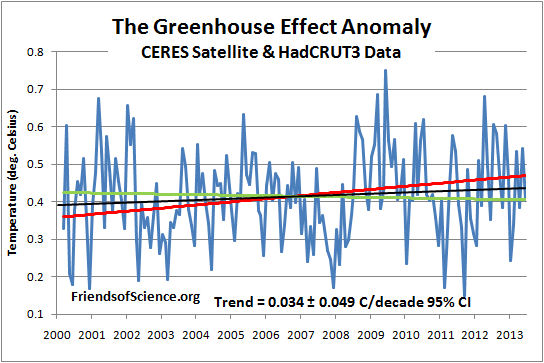
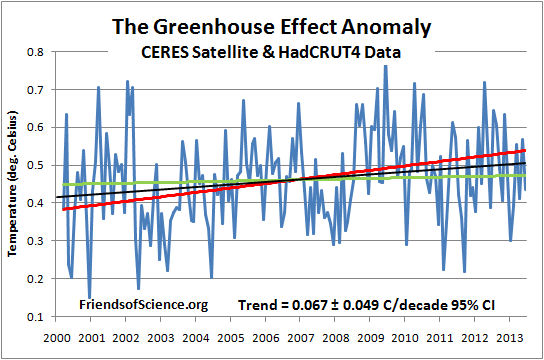
The difference between the surface temperatures anomaly and effective radiating temperature anomaly is the GHE anomaly. Figures 4 and 5 show the Greenhouse effect anomaly utilizing the HadCRUT3 and HadCRUT4 temperature indexes, respectively.

Figure 4. The greenhouse effect anomaly based on CERES OLR and HadCRUT3.

Figure 5. The greenhouse effect anomaly based on CERES OLR and HadCRUT4.
The trends of the GHE are 0.0343 °C/decade based on HadCRUT3, and 0.0672 °C/decade based on HadCRUT4.
We want to compare these trends in the GHE to changes in CO2 to determine the climate sensitivity. Only changes in anthropogenic greenhouse gases can cause a significant change in the greenhouse effect. Changes in the sun’s TSI, aerosols, ocean circulation changes and urban heating can’t change the GHE. Changes in cloudiness could change the GHE, but data from the International Satellite Cloud Climatology Project shows that the average total cloud cover during the period March 2000 to December 2009 changed very little. Therefore, we can assume that the measured change in the GHE is due to anthropogenic greenhouse gas emissions, which is dominated by CO2.
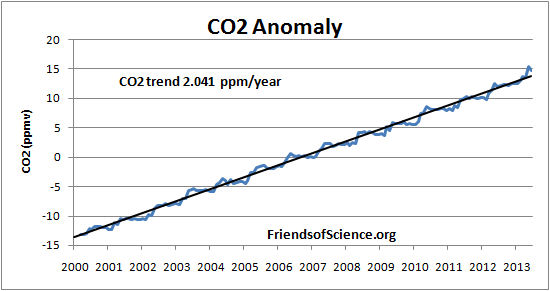
The CO2 data also has a large annual cycle, so the anomaly is used. Figure 6 shows the monthly CO2 anomaly calculated from the Mauna Loa data and the best fit straight line.

Figure 6. CO2 anomaly.
The March 2000 CO2 concentration is assumed to be the 13 month centered average CO2 concentration at March 2000, and the June 2013 value is that value plus the anomaly change from the fitted linear line. Table 1 below shows the CO2 concentrations, the logarithm of the CO2 concentration, and the change in the GHE from March 2000 for both the HadCRUT3 and HadCRUT4 cases.
Table 1 shows that the GHE has increased by 0.046 °C from March 2000 to June 2013 based on changes in the CERES OLR data and HadCRUT3 temperature data. Extrapolating to January 2100, the GHE increase to 0.28 °C by January 2100. Using the HadCRUT4 temperature data, the GHE increases by 0.55 °C by January 2100 compared to March 2000.
| hadCRUT3 | hadCRUT4 | |||
| Date | CO2 | Log CO2 | ΔGHE | ΔGHE |
| ppm | °C | °C | ||
| March 2000 | 368.88 | 2.567 | 0 | 0 |
| June 2013 | 395.94 | 2.598 | 0.046 | 0.089 |
| January 2100 | 572.68 | 2.758 | 0.283 | 0.554 |
| 2X CO2 | 737.76 | 2.868 | 0.446 | 0.873 |
Table 1. Extrapolated changes to the greenhouse effect (GHE) based on two versions of the hadCRUT datasets.
Table 1 shows that the GHE has increased by 0.046 °C from March 2000 to June 2013 based on changes in the CERES OLR data and HadCRUT3 temperature data. Extrapolating to January 2100, the GHE increase to 0.28 °C by January 2100. Using the HadCRUT4 temperature data, the GHE increases by 0.55 °C by January 2100 compared to March 2000.
The last row of Table 1 shows the transient climate response (TCR), which is the temperature response to CO2 emissions from March 2000 levels to the time when CO2 concentrations have doubled. TCR is less than the equilibrium climate sensitivity because the oceans have not reached temperature equilibrium at the time of CO2 doubling. TCR is calculated by the equation:
TCR = F2x dT/dF ; where dT means the temperature difference, dF means the forcing difference, from March 2000 to June 2013.
The CO2 forcing was calculated as 5.35 x ln (CO2/CO2i). The change in forcing from March 2000 to June 2013 is 0.379 W/m2. The forcing for double CO2 (F2x) is 3.708 W/m2. The TCR is 0.45 °C using hadCRUT3, and 0.87 °C using hadCRTU4 data. These values are much less than the multi-model mean estimate of 1.8 °C for TCR given in Table 9.5 of the AR5. The climate model results do not agree with the satellite and surface data and should not be used to set public policies.
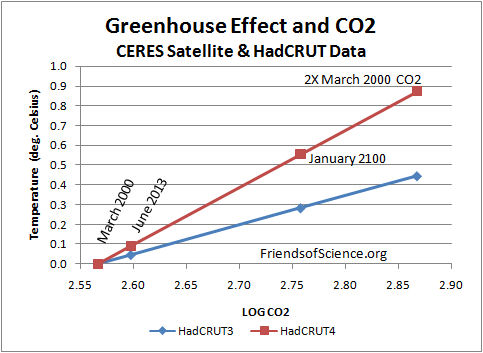
Figure 7 shows the results of Table 1 graphically.

Figure 7. The greenhouse effect and CO2 extrapolated to January 2100 and double CO2 bases on CERES and HadCRUT data.
This analysis suggests that the temperature change from June 2013 to January 2100 due to increasing CO2 would be 0.24 °C (from HadCRUT3) or 0.46 °C (from HadCRUT4), assuming the CO2 continues to increase along the recent linear trend.
An Excel spreadsheet with the data, calculations and graphs is here.
HadCRUT3 data is here.
HadCRUT4 data is here.
Mauna Loa CO2 data is here.
CERES OLR data is here.
Total cloud cover data is here.
Mike M says: January 16, 2014 at 10:04 am
Assuming NPP means ‘net primary production’ the increased biomass would cause more CO2 sequestration, so allow more OLR. Why do you say it reduces OLR?
Ken
Because GHE is not Ts-Te. GHE is the portion of surface radiation beeing blocked by the atmosphere, roughly 60%.
@Igl: “GHE is the portion of surface radiation being blocked by the atmosphere, roughly 60%”
No it’s not. The maximum operational surface emissivity of the planet surface to the atmosphere is ~0.4. In practice, only 40% is emitted as IR, the rest being convected. Therefore, the operational emissivity of the Earth’s surface is 0.4×0.4 = 0.16 = 63/396 (assumes 16 deg. C average surface temperature).
The 60% is annihilated at the surface; Radiative Physics 101 for the IR semi-transparent atmosphere, most GHG bands self-absorbed therefore black body emitters to the surface.
The GHE is from an entirely different route, the balance between albedo and SW thermalisation compared with a base mean surface temperature for no clouds or ice of between 4 and 5 deg C at 341 W/m^2 TSI.
AlecM 11:39am – Thanks, I take it you have no cites for the experimental work you mention?
Rented Goody&Yung awhile ago, I learned it was telling the same exact story as the top post here so I fail to as yet understand the alchemy you claim. Perhaps need to reconcile Goody/your work with Dr. M.F. Modest’s modern tome, a relevant link is here:
http://books.google.de/books?id=J2KZq0e4lCIC&pg=PA298#v=onepage&q&f=false
“You integrate this over time, space and wavelengths…”
This integration is exactly what is done using the CERES data in Stephens et. al 2012 (i.e. integrated over the wavelength spectrum) so at that point you seem ok with the top post science. I am not sure where the alchemy starts as yet.
Goody’s qdot = -div Fv reconciles to 0 = energy in avg. over spectrum – energy out avg. over spectrum for a planet atm. in ~LTE for the respective CERES time period (Stephens is 2000-2010 spatial-temporal avg.d) so I don’t as yet see where your claim of alchemy materializes, need to see the published experiments you discuss.
Note the minus sign is not a big deal, means whether any energy flux qdot added within system is in direction of local system flux or against it (shows up as sun energy in direction or terrestrial energy out direction). Since there is effectively 0 qdot flux added within atm. (well, except for burning leaves, camp fires, forest fires, car radiators, rocket blast offs, Colorado hemp burning, and the like) the minus sign issue is trivially eliminated.
Katherine says: January 16, 2014 at 2:53 am
No, my method makes no assumption about unknown forcings. I am comparing changes to the greenhouse effect to the only factor that could change the greenhouse effect, which is GHG emissions. Svensmark theory would change cloud cover. Clouds have a strong short-wave albedo effect and a weak greenhouse effect. A change of albedo affect both surface temperatures and effective radiating temperatures equally, but not the GHE. There might have been a very small longwave effect of changing clouds from March 2000, but cloud cover didn’t change much over the period.
An increase in energy input due to a cloud albedo change does not change the GHE. Any albedo reduction will increase surface temperatures and effective radiating temperatures equally, to GHE is unchanged. Only a forcing that changes longwave absorption in the atmosphere will change the GHE. Clouds are not disregarded; their effects are included in both Ts and Te.
In my article I define the greenhouse effect as the difference in temperature between the surface and the effective radiating temperature of the real earth with the actual albedo. The effective radiating temperature of the real earth is also the surface temperature of a hypothetical earth with no greenhouse gases but with the same albedo as the real earth. In both cases, the temperature is determined by the radiation balance between incoming absorbed solar radiation and OLR.
It is true that if there were no greenhouse gases in the atmosphere there wouldn’t be any clouds. That doesn’t prevent us to make the definition, which conveniently separates the GHE from the albedo effect.
Ken Gregory – thanks for your reply (Jan 16 8:10am), but I don’t think it covers my question. Re TSI, I’m not referring to actual GHE, but to your calculation of it. In your calcs, one of the factors is, if I’m reading it correctly, OLR. Since OLR includes reflected solar LR, it seems that a change in TSI could affect your result. Temperature is not involved.
On another issue, you say (jan 16 8:22am) “There was no temperature change during the CERES period, so there was no feedback response of natural CO2 production.“. The fact that there was no temperature change doesn’t mean that there was no change in the rate of natural CO2 production, because natural CO2 production itself changes the balance. All other things being equal (which unfortunately they never are), natural CO2 production slows to zero over time, with a half-life of maybe 12 years, so over the period of your study it would roughly halve. (‘Natural CO2 production’ can be positive or negative).
Richard
You are such strange people,the notion is that humans can control the planet’s temperature,I will repeat this – the wayward notion is that humans have control of the planet’s temperature as though it were a thermostat that you can,by doing or undoing something will govern global temperature.
You have an identity crisis going on here and I find this amazing notwithstanding that none of you can even define global climate .
MikeB says:
January 16, 2014 at 11:49 am
Mike please note I said at that location. No it was not too tough I just disagree with the 255 K average temperature idea.
Mike M said: January 16, 2014 at 10:04 am “But increased NPP can account for at least a portion of reduced outgoing LWR.”
Ken Gregory said January 16, 2014 at 12:38 pm: “Assuming NPP means ‘net primary production’ the increased biomass would cause more CO2 sequestration, so allow more OLR. Why do you say it reduces OLR?”
But Ken, CO2 concentration in the atmosphere keeps going UP so it would be even higher w/o biomass sequestration correct? GHE depends only on the CO2 that is in the atmosphere – NOT how much is or isn’t being sequestered into the ground. So more CO2 being sequestered represents more SWR radiation being absorbed by plants, converted into chemical energy and therefore represents LESS SWR radiant energy going into heating and reflected back up as LWR.
You guys seem to want to attribute the cooler conditions of vegetated areas solely on transpiration but that’s an incomplete equation because there is also energy transformation going on – photons into a higher chemical potential. Those photons are gone and cannot produce LWR.
Gkell1:
I am replying to your post at January 16, 2014 at 12:52 pm. It says to me
We are scientists. If you think that makes us “strange people” then we are content to live with that.
Your notion may be that “humans can control the planet’s temperature”. That is a strange notion.
My post you are answering explained there is a hypothesis that human activities may be capable of discernibly affecting global temperature but there is no evidence for that. And the above article is an attempt to determine if we can discernibly affect it. If we cannot discernibly affect global temperature then we certainly cannot “control” it.
We do not have an “identity crisis”. We are being scientists.
You seem to want us to be pseudoscientists of similar kind to Hansen, Mann, Trenberth, et al. but with us promoting the opposite contention to them.
We refuse to alter our “identity” from being scientists.
In conclusion, I ask you to again read my post that you have replied because it is clear that you did not understand it. To help you I provide this link which jumps to it.
http://wattsupwiththat.com/2014/01/16/ceres-satellite-data-and-climate-sensitivity/#comment-1538185
Richard
Mike Jonas says: January 16, 2014 at 12:47 pm
No, Mike, OLR does not include reflected solar radiation. There is no such thing as reflected solar longwave radiation (LR). Solar radiation that is reflected back to space is shortwave, resulting in the albedo. Solar radiation that is not reflected is absorbed, and the matter that absorbed it emitts longwave radiation.
Nature absorbs about half of man-made CO2 production. There is a strong annual cycle, see:
http://tinyurl.com/2dpoydt
so nature absorbs more than it emits each year. The natural cycle is not slowing over time because plants continue to grow and decay.
RichardSCourtney, I have repeatedly encouraged people not to encourage Gerald Kelleher (AKA Gkell1) after he disrupted Willis’s post on the longwave/shortwave balance.
Almost everyone realised that I was right not to waste time with him – not that he is necessarily wrong. Just that his comments are not relevant to the discussions.
But you are still playing with him. Please desist.
Courtney
“Avoiding Dangerous Climate Change: A Scientific Symposium on Stabilisation of Greenhouse Gases” was a 2005 international conference that examined the link between atmospheric greenhouse gas concentration, and the 2 °C (3.6 °F) ceiling on global warming thought necessary to avoid the most serious effects of global warming. Previously, this had generally been accepted as being 550 ppm”
http://en.wikipedia.org/wiki/Avoiding_dangerous_climate_change
That my dear man,whether you exist on one side of the modeling fence or the other,that statement above is the belief that humans can control temperatures within a certain range and that I find incredible in this era or any other. Your opposition already spelled it out for you that if you agree that atmospheric insulation is the basis for that control then game over.
Global climate is defined astronomically and specifically within a spectrum from a benign Equatorial climate to an extreme Polar climate,Jupiter’s inclination determines the former while the 82 degree inclination of Uranus defines the latter with the Earth having a largely Equatorial climate. This and this alone is the point of departure for climate research and not something that is way down the list including a minor atmospheric gas.
What you folk are presently seeing is something that has always existed where astronomy and terrestrial sciences are involved but you are too happy to engage in Simcity climate to care what one of the genuine scientists had to say .
“This assemblage of imperfect dogmas bequeathed by one age to another— this physical philosophy, which is composed of popular prejudices,—is not only injurious because it perpetuates error with the obstinacy engendered by the evidence of ill observed facts, but also because it hinders the mind from attaining to higher views of nature. Instead of seeking to discover the mean or medium point, around which oscillate, in apparent independence of forces, all the phenomena of the external world, this system delights in multiplying exceptions to the law, and seeks, amid phenomena and in organic forms, for something beyond the marvel of a regular succession, and an internal and progressive development. Ever inclined to believe that the order of nature is disturbed, it refuses to recognise in the present any analogy with the past, and guided by its own varying hypotheses, seeks at hazard, either in the interior of the globe or in the regions of space, for the cause of these pretended perturbations. It is the special object of the present work to combat those errors which derive their source from a vicious empiricism and from imperfect inductions.” Von Humboldt ,Cosmos
Ken, is there a way to plot the uncertainty over time of the projections?
Mike M says: January 16, 2014 at 1:06 pm
Yes, more CO2 is greening the planet, more SWR being absorbed by plants, converted into chemical energy, so less energy available to be emitted as upward LWR. Don’t say “reflected back up as LWR”. This is emitted radiation, not reflected, which is very different.
Yes, this is an effect, but it is very small and wouldn’t be large enough to affect the results.
The bottom line is that transient climate response is very small. This tiny warming effect of CO2 is almost entirely beneficial.
It doesn’t add up 7:11am: Agree that NASA 270.7K S-B and Diviner equator 206K topside measured; need to consider along with 40-45K higher subsurface temperatures from Apollo sites. Could be at equator the subsurface will be found much delta warmer than Apollo sites.
http://www.diviner.ucla.edu/science.shtml
Read 2012 paper No. 3 – Fig. 7 has equator 240K at 0.3m deep from the Diviner site ‘publications’ page, you can get the standard PDF here:
http://onlinelibrary.wiley.com/doi/10.1029/2011JE003987/abstract
Note Fig. 7 showing equator avg.s to 240K mean 0.3m deep in the regolith. Plus the 220K crater rims at pole. The moon Tmean deep in regolith being better indicator to compare S-B than emitted from the dust on top seen by Diviner radiometers; moon’s Tmean deep still isn’t known very well AFAIK but future papers should start to develop a conclusion possibly with added in situ drilled measurements.
I would bet will be found ~consistent with S-B from insolation and albedo avg.d. reducing the divergence between theory and actual you mention.
M Courtney:
re your post at January 16, 2014 at 1:27 pm.
Not everyone will have seen your call to ignore Gerald Kelleher (AKA Gkell1) which was made on another thread.
Onlookers need to be informed of the relevance of Gkell1’s posts. In this thread I answered his first post and responded to his reply by referring him to my first answer. People reading that can make their own judgements. Persistence which ignores my first answer would not merit additional reply, but I think there was good reason to reply as I did.
Subsequently, at January 16, 2014 at 1:30 pm he has provided a rude, silly and ignorant post addressed to me. It has no relevance of any kind to this thread so I shall consider this reply to you as being acknowledgement that I read it and I will not provide further reply to it.
My other contributions to this thread have discussed the statistical validity of the analysis in the above article by Ken Gregory.
Richard
Here is where my mistake was,in my haste to post in the other thread which practically gushes with the news that Americans really don’t care about global warming,this website saw fit to post an argument supporting global warming/carbon dioxide four days earlier.
The wider world has no idea whatsoever what the actual problem is but I assure you that I do. Having looked at the high school science curriculum most people don’t stand a chance as the science curriculum is written by the speculative/predictive empiricist for the same type of audience who engage in reaching a conclusion first and then modeling everything to suit that conclusion.
A unique astronomer died today in California,he also realized a problem that has gotten much worse over the last three decades as the modelers who were normally restricted to destroying astronomy moved into terrestrial sciences .Once they could state this in the very Discover magazine that the owner of this website now lampoons –
“A Langrangian is not a physical thing;it is a mathematical thing – a kind of differential equation to be exact.But physics and maths are so closely connected these days that it is hard to separate the numbers from the things they describe.In fact,a month after [Philip] Morrison’s remarks,Nobel Prize winner Burton Richter of the Stanford Linear Accelerator Center said something that eerily echoed it: ” Mathematics is a language that is used to describe nature” he said “But the theorists are beginning to think it is nature.To them the Langrangians are the reality ” Discover Magazine ,1983
The problem that began in astronomy has now spread to terrestrial sciences and nobody wants to know.
(Re – NPP = less LWR) Ken Gregory says: Yes, this is an effect, but it is very small and wouldn’t be large enough to affect the results. The bottom line is that transient climate response is very small. This tiny warming effect of CO2 is almost entirely beneficial.
I look at charts like this: http://www.esrl.noaa.gov/gmd/ccgg/trends/ and come away thinking that natural CO2 emission must be enormous, (and therefore likely underestimated), because the oscillation we are seeing is only the annual difference between NH and SH uptake (and SH has a lot of phytoplankton so it ain’t like it’s slacking along for the ride). You say the effect so “small” that it could not affect the results but the slope of the OLR decrease is also ~small~. So … the has anyone actually hung a number on average photosynthesis energy absorption in watts/m^2 ?
Mkelly
On what basis do you just disagree with it? In general, facts, physics and mathematics are not things you can choose not to believe just because you don’t like the answer – although AlecM seems to manage it all the time.
Gkell1, enjoying your comments more and more as time passes and hope you survive the p.t.b. here and are allowed to add another much needed different perspective. I’ve noticed what is happening to science over the last three decades. There are many here just wanting to learn never spending the time in the past years to delve into planetary atmospheres, some are here with agendas behind their words, you I am sure will discern who is who over time.
Ken Gregory: “That is, albedo changes Ts and Te equally, so no change in Ts – Te = GHE. So no, we don’t need to know the changes in short-wave radiation to calculate climate sensitivity.”
Thanks for your response, of which I agreed with everything up to the just-quoted passage. Even in that passage, I’ll accept the first sentence, although I’m not quite sure of it.
But the last sentence doesn’t seem to follow. If you had said, “we don’t need to know the changes in short-wave radiation to calculate GHE,” it would have followed.
More CO2 increases optical depth, so it requires a higher surface temperature to send the same long-wave radiation into space. The higher surface temperature, the argument goes, puts more H20 into the atmosphere, making the optical depth, and thus the surface temperature for a given top-of-the-atmosphere long-wave intensity, greater still. And you measure all of that.
But now (the argument goes) the thus-increased temperature melts the snow, decreasing albedo, making the earth still hotter–without increasing what you’re measuring, i.e., without changing the difference between the surface-long-wave-radiation temperature and the top-of-the-atmosphere long-wave radiation temperature. This increment of surface temperature would be the result, they say, of that CO2 increase, but it isn’t captured in your measurement.
I’m not saying I think that’s a big factor; I don’t know whether it is. But to me it does seem to make that passage incorrect.
“Only changes in anthropogenic greenhouse gases can cause a significant change in the greenhouse effect”
My bullshit-radar peaked….
“”””””……The CERES OLR data is converted to the effective radiating temperature (Te) using the Stefan-Boltzmann equation…….””””””
Well last time I studied Physics, the Stefan-Boltzmann equation, is an equation that is only valid for a theoretical, and non-existent object called a “Black Body” which has the absurd property, that it absorbs 100.000…% and reflects 00.000…% of ALL electromagnetic radiation energy that is incident on it, over the frequency range from zero to infinite frequency; not counting both ends. Such an object is impossible, because NO physical object has the same optical properties over all frequencies, as does free space; ergo, the reflection coefficient, cannot be zero.
But in particular, the top of the atmosphere is a very low molecular density environment, and so any EM radiation from it, can hardly be BB like. So using the SB equation to compute its Temperature is simply absurd.
However, not to worry, everybody does it so why not climatists.
But back to the essay, above; which I have read several times. No! I only clicked on one of the “here” tags, so maybe, I missed it; but nowhere in the entire “paper”, did I find the word “WATER” or even “WATER VAPOR”.
And for the life of me, I didn’t understand the author’s exposition on why it is ONLY anthropogenic green house gases that affect the climate sensitivity.
This reminds me of the miracle of the thermos flask; which keeps the hot things hot, and keeps the cold things cold. But how on earth does it know ??
So the climate sensitivity sensor, can distinguish volcanic CO2 from human exhalation; but how does it know ??
“””””…..The determination of the global warming expected from a doubling of atmospheric carbon dioxide (CO2), called the climate sensitivity, is the most important parameter in climate science……”””””
Finally, a definitive definition of “Climate Sensitivity”. pretty much as I believe the late Stanford Professor Stephen Schneider, is reputed to have defined it.
But I don’t have a good mental picture of exactly what “global warming” is, and it’s in the definition of the most important parameter in climate science is.
But I do understand what means “Doubling of atmospheric carbon dioxide CO2.”
That’s 400 ppm -> 800 ppm ; or 100 ppm -> 200 ppm ; or 3 ppm -> 6 ppm …etc. etc. , you get the idea.
But I do like the graphs.
One problem I see with the model; the climate sensitivity model, that is, is that ML CO2 and or its anomaly, have been steadily going up for at least the last 17 years or so, but I can’t fit the log of that to the quite stationary global Temperature over that same 17 year period. In fact I get as good a fit as a linear CO2 to Temperature graph, or even a CO2 to log of Temperature, over that period; or for that matter, any other period of history or even prehistory.
And the ancient pre-history data, seems to favor about an 800 year delay between the Temperature data, and the subsequent CO2 data; but nowadays, everybody seems to use zero delay.
Shouldn’t we be matching today’s CO2, data, to the Temperature data from 800 years ago, about the time of the mediaeval warm period ??
But it is good to learn that “climate sensitivity” is the most important parameter in climate science.
I’d be more interested, in knowing how many otherwise unemployable “scientists” get their life’s gravy train, from grant financed climate studies; knowing that they will retire, having never learned the exact value of “the most important parameter. in climate science”; such a deal !!
I hasten to add that my stream of consciousness post above is NOT directed at Ken Gregory, whose efforts in writing it, I do appreciate. It is directed at the whole concept behind it, that some simplistic notion as CS is could possible be representative of a whole planet, that at any time; say a northern midsummer day, could have a simultaneous temperature range over the globe, of as much as 150 deg. C, and routinely more than 120 deg. C, and due to a theorem, by Galileo Galilei, provides for an infinite number of points on the globe where ANY Temperature value in that roughly -94 to +60 deg. C total extreme range, can be simultaneously measured. And CS is all about one deg. C over 150 years or so. Balderdash !!