Andrew Revkin writes:
Michael Mann can’t be happy about this work.
Here’s a chat with two authors of an important new Science paper examining 10,000 years of layered fossil plankton in the western Pacific Ocean. The paper finds that several significant past climate ups and downs — including the medieval warm period and little ice age — were global in scope, challenging some previous conclusions that these were fairly limited Northern Hemisphere phenomena.
(video follows, an interview with authors)
The study finds that the rise in ocean temperatures in recent decades is far faster than anything seen earlier in the Holocene, the period since the end of the last ice age. But the researchers say that this rise is from a relatively cool baseline. Between 10,000 and 8,000 years ago, at depths between 500 and 1,000 meters, the Pacific Ocean was 2 degrees Celsius (3.6 degrees Fahrenheit) warmer than today. (text from the video description)
The paper is here:
http://www.sciencemag.org/content/342/6158/617
Pacific Ocean Heat Content During the Past 10,000 Years
Yair Rosenthal, Braddock K. Linsley, Delia W. Oppo
Abstract:
Observed increases in ocean heat content (OHC) and temperature are robust indicators of global warming during the past several decades. We used high-resolution proxy records from sediment cores to extend these observations in the Pacific 10,000 years beyond the instrumental record. We show that water masses linked to North Pacific and Antarctic intermediate waters were warmer by 2.1 ± 0.4°C and 1.5 ± 0.4°C, respectively, during the middle Holocene Thermal Maximum than over the past century. Both water masses were ~0.9°C warmer during the Medieval Warm period than during the Little Ice Age and ~0.65° warmer than in recent decades. Although documented changes in global surface temperatures during the Holocene and Common era are relatively small, the concomitant changes in OHC are large.
===============================================================
Steven Mosher says:
October 31, 2013 at 1:21 pm
from one ocean basin they jump to global conclusions.
what would folks say if the sediments showed the opposite
===========
Erect more windmills.
Mosher writes “from one ocean basin they jump to global conclusions.”
As far as your comment goes, I haven’t read the paper but it seems to me they went to a few randomish places on the earth and found medieval warming. The definitely supports the idea of medieval warming not being local like the team have suggested in the past.
I’m pretty sceptical about implications the Pacific ocean was 2C warmer than now though! Thats an enormous amount of energy and represents a lot of heating over a very long period. In that sense, I suspect either the proxy isn’t saying what they think its saying or the warming was coincidentally highly localised and not representative of the ocean in general (supporting Mosher’s argument but not for the reasons he thinks)
TimTheToolMan says:
October 31, 2013 at 4:44 pm
Two K might seem like a lot, but the drop from “normal” to La Niña conditions along the west coast of South America can be twice that much. Granted, that’s from the upwelling of cold water from below, but even in the western Pacific, centuries of greater warmth could IMO produce a difference of two K warmer than now, coming off the LIA as we are.
Steven Mosher says:
“from one ocean basin they jump to global conclusions.
what would folks say if the sediments showed the opposite?”
Steve, we would say the same thing you would: “Show me the data so I can try to replicate your results”.
But you knew that already, didn’t you?
At Huffpo, Mann writes:
‘They argue that, while the present rate of ocean warming is unprecedented, the actual level of ocean heat content (which depends not just on surface temperature, but also sub-surface ocean temperatures) is not as high as during Medieval times, i.e. during what they term the “Medieval Warm Period”…’
Does anyone believe that rates of ocean warming are reflected in proxies? I am talking about “unprecedented” ocean warming. How would the rate, as opposed to the extent, show up in proxies? Take tree rings for a familiar example. I recognize that the extent of warming might show up in individual tree rings but how would the rate show up? The extent of warming can be determined by several different things including length of season, cloud cover, precipitation, and other factors. These different factors have to be teased out. How is it possible to find a rate of warming among them that allows comparison over several centuries and includes relative rates of unprecedented warming?
milodonharlani writes “centuries of greater warmth could IMO produce a difference of two K warmer than now, coming off the LIA as we are.”
I dont think ENSO effects the waters from 500m to 1km depth so much. But even if it did, that would be a localised effect and Mosher’s argument is back on the table if they manage to pick locations that had those kinds of localised effects. Still no props to you though Mosher 😛
According to the study Continental-scale temperature variability during the past two millennia, involving 78 scientists all over the World which was published in april this year large parts of the Northern Hemisphere experienced MWP from ~ 800 to 1200 AD but not simultaneously and not equally warm.In the Southern Hemisphere it was delayed by ~ 100 years. The study is based on temperature reconstructions from a variety of proxies. All continents except Africa are covered.
http://www.nature.com/ngeo/journal/v6/n5/full/ngeo1797.html
Figure 2 shows the temperatures of each continent. To see the figure in higher resolution go to Supplementary information at the link below.
http://www.nature.com/ngeo/journal/v6/n5/full/ngeo1797.html#affil-auth
If you had a time machine and took Michael Mann on a trip, would you be able to change his mind?
It would be an interesting journey into human psychology if anything. Might have to stop in and get Mann to see Sigmund Freud once or twice.
I am really going to have to scour my records. Back in the mid-90s, on UseNet (ask your grampa), a certain Mr. Connolly of the British Antarctic something or other “debated” me and was pretty certain that the LIA was only regional to Europe. And a bit of North America. I actually love to say I told you so…
Steven Mosher on October 31, 2013 at 1:21 pm
from one ocean basin they jump to global conclusions
One ocean basin, bit like one tree I suppose
Global MWP, interactive chart. [Hover cursor over charts to embiggen]
Mosher, Have you ever considered getting you infrared spider senses recalibrate? If there is a region that is truly teleconnected to “global” climate, the IPWP looks about right.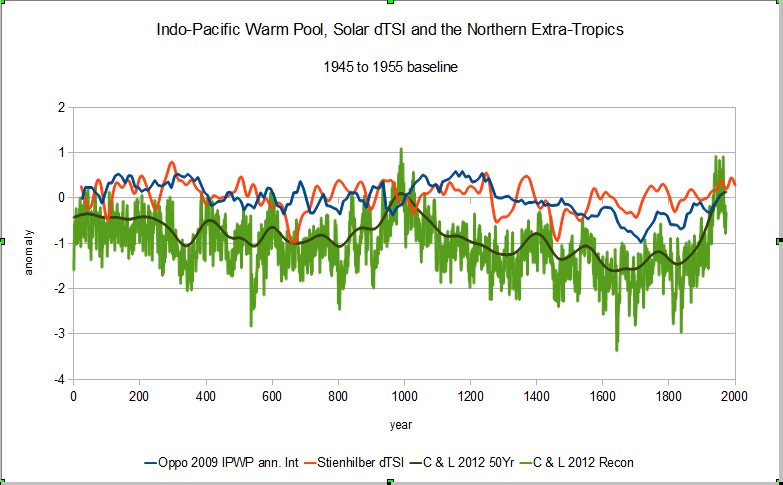
Of course paleo, just like BEST, is baseline dependent, doncha know 🙂
Dave in Canmore says:
October 31, 2013 at 1:27 pm
Given the location of the cores could it be that large ENSO events would be recorded?
————————————
That would only be an issue for short term data. In 10000 years of data such high frequency wiggles should not obscure trends and means.
Funny ain’t it, the concerted effort to regionalize the MWP and other variations of past temperature is the very thing that got me to pay attention to this “climate science”.
People who rewrite history can not be trusted.
Sadly I am still waiting for the science. Trillions spent world wide, government science working overtime, endless propaganda, but no empirical science to support the contention that increasing atmospheric CO2 concentrations cause increasing global heat retention.
I regard the actions of my, canadian, government employees in this sordid affair to be particularly odious.
Treason in my book.
Is logical thought dead?
This paper is damning to the CAGW swindle as it shows once again that the Medieval Warming Period was WARMER than today and, more importantly, was a global event and not just limited to the Northern Hemisphere as CAGW grant whores tried so desperately to promote.
It also shows that the Little Ice Age was a global event that significantly lowered global ocean temperatures and, more importantly, the 20th century warming was a simple NATURAL recovery from the LIA.
The fact that the LIA begins and ends with the Grand Solar Minima: Wolf, Sporer,, Maunder and Dalton, gives further support that the Sun is the primary driver of climate and NOT CO2. The fact that the solar cycles from 1933-1996 were the strongest 63-year string of solar cycles in 11,400 years also supports the premise that the Sun is the driver of climate. Furthermore, the fact that the global warming trend ended the same year these strong solar cycles ended in 1996, is further support of solar induced climate change.
Moreover, Lockwood’s recent findings that solar activity over the past 20+ years is dropping at the fastest pace in 10,000 years, corresponds perfectly to falling global trends since 1997 (RSS) and 2001 (HADCRUT4).
Research by Penn & Livingston, and Lockwood suggest a high probability that the Sun could enter another Grand Solar Minimum from the next solar cycle, which starts in 2020, suggesting the Modern Warming Period is in its final stages and that global cooling is on its way.
CAGW is dead.
“Is logical thought dead?” — SAMURAI
To be and not to be. That is the contradiction.
Here’s a repeat of part of my guest post of 10/29 which shows developments following Mann’s Hockey stick and suggests a suitable replacement as a basis for discussion.
“Central to any forecast of future cooling is some knowledge of the most important reconstructions of past temperatures after all the infamous hockey stick was instrumental in selling the CAGW meme.
Here are links to some of the most relevant papers-starting with the hockey stick.
http://stephenschneider.stanford.edu/Publications/PDF_Papers/MannBradleyHughes1998.pdf
http://www.ncdc.noaa.gov/paleo/pubs/mann_99.html
note Espers comments on the above at
http://eas8001.eas.gatech.edu/papers/Esper_et_al_Science02.pdf
and see how Mann’s hockey stick has changed in later publications
http://www.pnas.org/content/105/36/13252.full
http://www.meteo.psu.edu/holocene/public_html/shared/articles/MannetalScience09.pdf
an important paper by Berggren et al relating solar activity to climate is
http://www.eawag.ch/forschung/surf/publikationen/2009/2009_berggren.pdf
and another showing clearly the correlation of the various climate minima over the last 1000 years to cosmic ray intensities -( note especially Fig 8 C ,D below ) is: Steinhilber et al – 9400 years of cosmic radiation and solar activity from ice cores and tree rings:
http://www.pnas.org/content/early/2012/03/30/1118965109.full.pdf
for Holocene climate variability in general there is much valuable data in Mayewski et al :
http://yly-mac.gps.caltech.edu/AGU/AGU_2008/Zz_Others/Li_agu08/Mayewski2004.pdf
Of particular interest with regard to the cause of the late 20th century temperature increase is Wang et al:
http://www.atmos-chem-phys.net/12/9581/2012/acp-12-9581-2012.pdf
A review of candidate proxy data reconstructions and the historical record of climate during the last 2000 years suggests that at this time the most useful reconstruction for identifying temperature trends in the latest important millennial cycle is that of Christiansen and Ljungqvist 2012 (Fig 5)
http://www.clim-past.net/8/765/2012/cp-8-765-2012.pdf
The shape of the curve of Fig 3(Fig 5 Christiansen) from 1000 – the present should replace the Mann-IPCC hockey stick in the public consciousness as the icon for climate change and a guide to the future i.e. the temperature trends from 1000- 2000 will essentially repeat from 2000- 3000.”
These climate change deniers (such as Mike Mann) are running out of excuses. They tried to deny the medieval warm period. They tried to deny the little ice age. They tried to deny the cooling from 1945 to 1975. Slowly but surely science is overcoming these deniers. Someday they will be forced to admit that climate change has been real for the life of the planet.
Yamal was Briffa, not Mann. Fail.
Keigwin, L.D. 1996. The Little Ice Age and Medieval Warm Period in the Sargasso Sea. Science 274: 1504-1508.
This paper confirms Keigwin’s paper in regards to ocean temperatures of the MWP. Keigwin did not go back 10,000 YBP as these fellers did, but he did go back 3,000 years.
It is amazing how consistent the ocean temp is between the two large basins.
And for sure confirms the MWP was global in scope.
I guess we can expect a Mannturbation.
Michael Mann?
He can pound sand for all I care.
And that’s the best “compliment” I can come up with.
If pressed, I’d have to remain silent.
TimTheToolMan says:
October 31, 2013 at 5:11 pm
Keigwin, L.D. 1996. The Little Ice Age and Medieval Warm Period in the Sargasso Sea. Science 274: 1504-1508, cited by Camburn above, found, based upon a radiocarbon-dated box core in the Sargasso Sea (SW North Atlantic), that the sea surface temperature was about one K cooler than today approximately 400 years ago (the Little Ice Age) & 1700 years ago (Dark Ages Cold Period), & around one K warmer than today 1000 years ago (the Medieval Warm Period).
Doesn’t seem strange to me that in the western Pacific the Medieval Warm Period might have enjoyed SST two K higher than now.
This paper, press release and author comment present a complete mess of information. Revkin seems to see this, but skips reckless over it all.
Firstly, let’s remember that these are a few results from one area only, the oceans around the islands of Flores and Celebes and a climatically extraordinary place — the warm pool. In themselves these results say nothing about global phenomena. Anyway, I don’t recall any major dispute over the global nature of the Holocene optimum or Little Ice Age since they were identified 100 years ago.
The authors admitted only centenary scale resolution, and the core top problems does not allow results from the period of the recent local instrument record — see also Mann on this.
Thus, the press release makes a claim that the paper could not pretend to make:
“In a reconstruction of Pacific Ocean temperatures in the last 10,000 years, researchers have found that its middle depths have warmed 15 times faster in the last 60 years than they did during apparent natural warming cycles in the previous 10,000.”
They use Marcott’s mid-Southern Hemisphere data for comparison with air temperature and this shows much less dramatic cooling. From this stark difference in the trend they draw various conclusions about the differential behavior of the ocean temp/heat (in general?) and the air temperatures (in general?). But could not the differential indicate that one or both of the results is wrong, or that something special might be happening in (and over?) the Indonesian warm pool.
The only rapid recent warming they can and are talking about is warming out of the LIA, warming over the last 3 or 4 centuries — not over the last 3 or 4 decades when AGW is supposed to have impacted. Thus, it is the non-AGW recovery from the LIA that requires explaining, yet they are pushed to say that it is not. This makes them look particularly stupid.
Finally, support for global MWP?? Well yes, perhaps, if the MWP includes a collapse in temperatures from the second half of the 11th century — that is right when Lamb has his CET chart taking off into the warming to support the high middle ages. If you cut the chart off at the turn of the last millennium (as per the hockey stick) there is no MWP but only a general decline. (see their fig 3)
Shouldn’t your headline start “Yet another new paper …”