Guest Post by Willis Eschenbach
According to the current climate paradigm, if the forcing (total downwelling energy) increases, a combination of two things happens. Some of the additional incoming energy (forcing) goes into heating the surface, and some goes into heating the ocean. Lately there’s been much furor about what the Levitus ocean data says about how much energy has gone into heating the ocean, from the surface down to 2000 metres depth. I discussed some of these issues in The Layers of Meaning in Levitus.
I find this furor somewhat curious, in that the trends and variations in the heat content of the global 0-2000 metre layer of the ocean are so small. The size is disguised by the use of units of 10^22 joules of energy … not an easy one to wrap my head around. So what I’ve done is I’ve looked at the annual change in heat content of the upper ocean (0-2000m). Then I’ve calculated the global forcing (in watts per square metre, written here as “W/m2”) that would be necessary to move that much heat into or out of the ocean. Figure 1 gives the results, where heat going into the ocean is shown as a positive forcing, and heat coming out as a negative forcing.
 Figure 1. Annual heat into/out of the ocean, in units of watts per square metre.
I found several things to be interesting about the energy that’s gone into or come out of the ocean on an annual basis.
The first one is how small the average value of the forcing actually is. On average, little energy is going into the ocean, only two-tenths of a watt per square metre. In a world where the 24/7 average downwelling energy is about half a kilowatt per square metre, that’s tiny, lost in the noise. Nor does it portend much heating “in the pipeline”, whatever that may mean.
The second is that neither the average forcing, nor the trend in that forcing, are significantly different from zero. It’s somewhat of a surprise.
The third is that in addition to the mean not being significantly different from zero, only a few of the individual years have a forcing that is distinguishable from zero.
Those were a surprise because with all of the hollering about Trenberth’s missing heat and the Levitus ocean data, I’d expected to find that we could tell something from the Levitus’s numbers.
But unfortunately, there’s still way too much uncertainty to even tell if either the mean or the trend of the energy going into the ocean are different from zero … kinda limits our options when it comes to drawing conclusions.
w.
DATA: Ocean temperature figures are from NOAA, my spreadsheet is here.
w: here’s an explanation more in the language you’ve used.
you’ve shown there is a small trend in the annual forcing, that isn’t statistically significant at the 2-sigma level (but is at some lower level).
but even an unchanging forcing, i.e. a constant forcing, means the ocean is warming — some number of W/m2 is going into the ocean on a constant basis. more joules every second.
that *heats* the ocean, until the forcing=0.
a zero *forcing* keeps the ocean at a constant temperature (i.e. constant OHC), not a constant forcing.
you haven’t understood what you’re really calculating. this is a wrong post all around.
Willis Eschenbach says, June 19, 2013 at 3:57 pm:
“Neither the solar flux, nor the downwelling longwave radiation (DLR) from the atmosphere, nor the upwelling longwave radiation (ULR) from the surface, is a flow of heat. They are all flows of energy. Heat, on the other hand, is a NET energy flow.”
Eh, have you even read my posts? Where do I say anything to the contrary? That’s my whole point. There is no NET flow of IR, as you call it, to the surface from the atmosphere. Hence, there is no HEAT, as I call it, going from the atmosphere to the surface. The NET radiative energy goes from the surface to the atmosphere. There is no IR from the atmosphere that can increase the internal energy of the surface, because on average more always goes the other way. The posited 390 UP and 324 DOWN fluxes are part of the same exchange and the spontaneous flow of NET energy (‘heat’) that results is going UP. That’s my whole point.
If we agree on this, which we appear to do, there is no quarrel.
The solar flux, however, is clearly a heat flux. It warms the Earth. It brings the surface a NET contribution of energy – heat. It is most important to separate between systems when looking at heat flows. There’s the ‘exchange’ between Sun and Earth’s surface. That is +168 W/m^2. Radiative HEAT coming IN (of course there is such a thing, that is the thing, that’s the thing that’s actually measured/detected, not the inferred individual fluxes). Then there’s the ‘exchange’ between Earth’s surface and atmosphere/space. That is (324-390=) -66 W/m^2. Radiative HEAT going OUT. (Of which 26 go to the atmosphere and 40 go directly to space.) Then you have that other heat loss flux from the surface which is the convective one (conduction/convection + evaporation). Convective HEAT going OUT. This is -102 W/m^2 on average. It all goes to the atmosphere.
(-66-102=) -168 W/m^2 of total HEAT escapes the surface. Balancing the incoming from the Sun.
This is the heat budget of the Earth’s surface. It is balanced. 168 in, 168 out.
Well Ximinyr,
I am pretty sure that if the ocean heat content has an average effect of increasing the averaged temperature of the ocean by less than a .1 degree C over the course of 60+ years; for most of that time we were taking a very small number of measurements; and those measurements were taken had a greater uncertainty than .1 degree C than this is logically not significant.
If you have to take a measurement such as the oceans temperature and turn it into energy and then graph it so it looks huge and significant your not doing anyone any favors. Particularly if the data it is based on is not statistically significant.
David Riser: i am told that ARGO sensors can measure temperature to ~0.01 C.
it does not matter if you are talking about heat gain or temperature — they are proportional. the oceans have a huge volume, so a small temperature change means a lot of heat change.
what do you think is the change in avg ocean temperature from a glacial to interglacial period?
Kristian says:
June 19, 2013 at 9:21 pm
Yes, thanks, Kristian, I have read them, and I’d be glad to help you out. Here is exactly what you said to the contrary:
There is no such thing as a “heat flux”. You claimed the solar radiation was a “heat flux” but DLR wasn’t, which is wrongity-wrongity-wrong.
And it is certainly “to the contrary” of my statement above.
Q. E. D.
In any case, why would solar and DLR be different in their ability to transfer energy? They’re both EMR, just different frequencies. You think only light can heat things, but DLR can’t? How do you think a microwave oven works, or an infra-red heater? All kinds of electromagnetic radiation can transfer energy, and can add that energy to things that they strike.
You went on to say:
That’s because there is no such thing (except apparently in your imagination) as a a flow of “radiative heat”. You think the sun puts out “radiative heat”, but DLR doesn’t … and as many folks have said, that’s way, way wrong. It’s reflective of your very weak grasp of the underlying concepts.
There’s an old saying. When one man calls you a horse, laugh it off. If two men call you a horse, think it over.
But if three men call you a horse … buy a saddle.
At this point a number of folks, more than three, have told you that your claimed understanding of physics is poor. I agree completely, your misunderstanding is profound. So at this point, you have two options:
1. Admit you are wrong, even if just to yourself, and go and learn some more, or
2. Continue with your absurd and futile, although somewhat funny, attempt to convince us that you really do understand this physics thingie, yes sirree you do, and if we only knew it, your physics-fu is so awesomely strong …
Your choice.
Me, I’m noted among climate bloggers because I admit publicly when I’m wrong. It’s not easy, and I hate doing it, but it’s the only way for me to learn and for science to advance. Falsifying someone’s scientific ideas and theories and claims is at the heart of science, even when it’s my own claims and ideas that get falsified.
Best regards,
w.
The variation in figure 1 is again totally implausible.
There is a mean of 0.2 W/m2 representing the oceans heat uptake due to total forcing of about 1.6 W/m2 since 1955
(IPCC at about 2.4 today, about 0.8 in 1950).
http://i81.photobucket.com/albums/j237/hausfath/ScreenShot2012-12-13at43419PM_zps4a925dbf.png
Every upside variation has to be associated with a reduction in cloud cover.
The effect of a 3% decrease in cloud cover is believed to represent a forcing of 1-1.5 Wm-2 (Rossow and Cairns, 1995, Svensmark has similar numbers).
Observed cloud cover changes amount to only a few percent over a year. Therefore cloud reduction forcing has at maximum been about the size of the total forcing.
Any yearly variation in figure 1 exceeding about 0.2 W/m2 is then not plausible.
Larger variation must then be a measurement error. Such errors may level out during long term measurements similar to very noisy sea level data.
But this does not apply to the largest error in 2003-2005 due to equipment change to ARGO. This false step increase in ocean heat content will not be corrected by future ARGO data.
The AGW paradigm of the ocean is ludicrously simplistic. It treats the oceans as a passive puddle. Only external “forcing” (what a deeply ignorant word) can change its temperature and heat content. However the oceans own internal dynamics with oscillations on century and millenial scales drive heat and temperature changes in the upper ocean, bearing in mind the overwhelming majority of climatic heat content being in the ocean. Measured temperature trends in the upper ocean allow very little if anything to be concluded about in-out heat budget.
I love this graph. It is easy to understand, and it shows how little change there really has been.
Ximinyr says:
June 19, 2013 at 7:04 pm
you are calculating the trend of d(OHC)/dt, not the trend of OHC
—————————
Yes, because Willis was talking about d(OHC)/dt, What is your point ???
The trend in OHC is approx. equal to the mean, also given in figure 1. Its all there…
Ximinyr says
David Riser: i am told that ARGO sensors can measure temperature to ~0.01 C.
Actually ARGO sensors are not that accurate nor are they the same type or design of sensor across the fleet. Nor is the accuracy of other ocean temperature sampling methods prior to ARGO that accurate. for a interesting read on the issue:
http://earthobservatory.nasa.gov/Features/OceanCooling/page1.php
To go from Cooling to Heating based on the accuracy of your measurements is precisely what Willis is talking about.
Ximinyr says:
June 19, 2013 at 8:33 pm
Man, that’s just too precious. Why waste time on math, it’s so hard after all ,,, just look at the graph and declare victory, anyone can do it!
Hilarious … however, thank you for identifying the dataset you are using (pentadal global 0-2000 heat content).
For those who, unlike Ximinyr, want to actually do the math before declaring victory, here’s how it works out.
Mr. X is right that Excel makes it look like there is definitely a significant trend in the pentadal. The slope and error of the trend is given by the LINEST function as 0.43e+22 joules per year with an error of only 0.02e+22 joules per year. What’s not to like? So he declares that the autocorrelation adjustment is un-necessary. But he doesn’t realize the power of autocorrelation.
The problem is, the pentadal dataset is made out of 54 years of overlapping 5-year averages! So of course, the autocorrelation is horrendous. For the detrended dataset it’s 0.86.
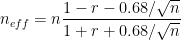
Remember that the Nychka equation is:
Plugging in the “n” of 54 and the autocorrelation of 0.86 gives us an effective “n” of one lone solitary data point … not enough to do anything with. Which is why annual overlapping five-year centered averages aren’t all that useful.
The problem doesn’t go away with annual data, however, but it’s better. As I pointed out above, the p-value of that trend can at least be calculated, and it’s 0.08. Not significant, roughly one chance in ten that it’s a false positive.
And that is why you can’t just shine on the autocorrelation adjustment, particularly for “pentadal” data.
It is also why Mr. X is wrong when he claims that you can determine significance by looking at a graph … sorry. As some folks know, I am an enthusiastic supporter of the use of the Mark I eyeball. But determining significance from looking at the graph? That’s not even theoretically possible.
w.
Well actually I should say ARGO are typically calibrated to .001C however none of the manufacturers will say exactly how accurate they are in the operating environment of an ARGO float for a wide variety of reasons. ARGO claims .005C yet they have to quality check the data and there are frequently issues with them. The Ocean Cooling page goes into a lot of detail on some issues they have had but really the record before ARGO was so bad that when ARGO came online it showed cooling…. So they had to correct the record…..So they do Quality changes to their data….. So I am saying that there accuracy leaves a lot to be desired…
Why bother to entertain the change in subject? The climate scientists said temperature was going up and would continue to rise. Hockey stick anyone. They did not say heat content would rise like a hockey stick. Temperature and heat are two different things. If they want to discuss ocean heat then say fine first lets discuss land and atmosphere heat rise from 1900. Anthony’s graph show no rapid rise in land heat content.
Manfred says:
June 19, 2013 at 10:16 pm
Manfred, thanks, sorry I haven’t replied to your interesting point. Onwards.
Mmmm … I’ve grown careful about words like “every” and “all”. There’s at least three ways to increase the amount of heat in the ocean.
1. Increase the energy input.
2. Decrease the losses.
3. Increase the residence time.
So whatever your statement was intended to prove, it hasn’t.
Again, mmm … and again, there are more ways to increase the energy input than to decrease the cloud cover. One main one, which functions as a major thermal control mechanism in the tropics where most of the energy enters, is to vary not the amount of clouds but their timing. A one-hour delay in the average onset time of the tropical clouds leads to about 60 W/m2 of additional incoming energy. On a 24/7 basis, that comes down 2.5 W/m2 increase in forcing.
No, larger variations can easily be due to rearrangements of the clouds, and alterations in their time of onset and disappearance.
Part of the problem is that you are looking at the average effects of clouds. But take a typical tropical day. Clouds during the day have a strong cooling effect, hundreds of watts per square metre.
Clouds in the night have a weaker effect, which is in the opposite direction, a warming effect.
So if we have twelve hours of clouds, the average cloud cover is the same whether the clouds are there in the day or the night. But the thermal effect is totally different, by hundreds of watts/m2. My point is that although the average cloud cover doesn’t vary much … that doesn’t mean much.
As a result, I find your argument unconvincing. Small, un-noticed shifts in cloud onset time make a very large difference in downwelling radiation. And because the normal onset time of the tropical cloud cover is just before local noon, the sun is at the optimum position to deliver energy deep into the ocean.
Finally, you have to consider the size of the energy flows. The 24/7 average total downwelling radiation over the tropical ocean is well over half a kilowatt per square metre. What you may not have considered is that basically all of that energy passes into the ocean during the day, and then about the same amount is lost from the ocean overnight. If that were not so, if the huge amount of heat absorbed by the ocean every day were not lost every night, the ocean would quickly boil away.
That 600 W/m2 is the amount of energy that is being first absorbed by the ocean, and then lost by the ocean through radiation, conduction to the atmosphere, and evaporation on a 24 hour basis.
Given that huge daily throughput of energy coursing into and out of the ocean, I see no reason that annual variations in the amount of energy that stays in the oceans could vary by ± 3 W/m2. That’s only about a half a percent of the energy flowing through the ocean, I can see that much variation no problem …
Like you, I mistrust the big jump in the data early this century. It just doesn’t look right to me, a weak argument I know, but it’s tricky to build one dataset from different kinds of records. However, as I’ve pointed out, it’s the best we have.
Finally, let me point out the large error margins in the values of the forcings. I suspect that some of the “unphysical” jumps in the amount of energy in the ocean are just a consequence of the large error bars.
Best regards,
w.
Willis,
Another good post, and good responses to other commenters. Many thanks.
David Riser says:
June 19, 2013 at 10:51 pm
Thanks, David. You are correct that they are not the same type or design of sensor across the fleet.
However, their claimed accuracy is better than 0.01. In a study of 6 Argo floats pulled from the water and tested, they say:
As Satchel Paige said, it’s not what you don’t know that hurts you. It’s what you do know that ain’t so …
w.
Matthew R Marler says:
June 20, 2013 at 12:06 am
Thanks, Matt, always good to hear from you.
w.
Willis Eschenbach says:
June 19, 2013 at 11:54 pm
…Mmmm … I’ve grown careful about words like “every” and “all”. There’s at least three ways to increase the amount of heat in the ocean.
1. Increase the energy input.
2. Decrease the losses.
3. Increase the residence time.
Again, mmm … and again, there are more ways to increase the energy input than to decrease the cloud cover. One main one, which functions as a major thermal control mechanism in the tropics where most of the energy enters, is to vary not the amount of clouds but their timing. A one-hour delay in the average onset time of the tropical clouds leads to about 60 W/m2 of additional incoming energy. On a 24/7 basis, that comes down 2.5 W/m2 increase in forcing.
No, larger variations can easily be due to rearrangements of the clouds, and alterations in their time of onset and disappearance.
Part of the problem is that you are looking at the average effects of clouds. But take a typical tropical day. Clouds during the day have a strong cooling effect, hundreds of watts per square metre.
Clouds in the night have a weaker effect, which is in the opposite direction, a warming effect.
So if we have twelve hours of clouds, the average cloud cover is the same whether the clouds are there in the day or the night. But the thermal effect is totally different, by hundreds of watts/m2. My point is that although the average cloud cover doesn’t vary much … that doesn’t mean much.
—————————————————–
Agree, there are such rearrangements and timing chances etc, but to what extent for a whole year and globally ?
And even if, the peaks are too large to be explained by any such mechanism:
4% reduced cloud cover corresponds approximately to the IPCC average 1955-today forcing and this correponds to a heat uptake of 0.2 W/m2
But there are yearly heat uptake values of 2.3 W/m2 in the dataset. Subtract 0.2 due to “global warming” and 2.1 W/m2 remain to be explained !
2.1 W/m2 heat uptake not forcing..This would then correspond to a cloud cover reduction of 42% (or an alternative rearrangement) globally and for a whole year.
Willis Eschenbach says, June 19, 2013 at 10:08 pm:
Yes, always the same old bluster without substance when entering this subject: “You don’t know physics! Your ideas are deeply flawed! Go read a textbook and learn something! All physicists disagree with you!” And so on and so forth.
And that’s that.
Could you rather than rambling please address what I asked from Bart upthread?
“What is ‘heat’ to you? Does it fly around in every direction? Show me how my definition of ‘heat’ goes against the agreed upon physical definition. Show me how the atmosphere is a source of heat for the surface, how it transfers heat downwards.”
I have no problem admitting when I’m wrong, Willis. I am not wrong on this one.
I will however concede one point. I shouldn’t have quoted that whole paragraph of yours when claiming my argument didn’t oppose it. I was actually referring only to the last line: “Heat, on the other hand, is a NET energy flow.”
How does what I’ve written above go against this notion?
You mix up individual and opposing energy fluxes in an exchange between two systems and the ‘net’ flux between them, the heat transfer. Only heat transfer transfers … heat (increase in internal energy for the cool system, decrease in internal energy for the warm system).
There is nothing novel in my definition of heat, Willis. Heat is energy transferred from a hot to a cold system. This transfer (the ‘net’ flow of energy) only goes one way. Pertaining to the radiative interaction between Earth’s surface and Earth’s atmosphere, the transfer goes UP and only up.
You can look this up anywhere. This is not a warped idea om mine.
What happens when you introduce the upwelling and downwelling IR fluxes between surface and atmosphere in the energy budget diagrams, is that you confuse people’s perception of what is actually physically going on. You give the impression that the atmospheric flux is equivalent to the solar flux. It is not. The inferred 324 flux is not an independent, extra flux of energy coming down to the surface, like the solar flux. The 324 W/m^2 down could not increase the internal energy of the surface, and therefore could not heat it, because on average it would always be opposed by a larger flux going up (the equally inferred 390 W/m^2 flux). The 324 is the LESSER PART of an assumed continuous IR exchange between the two systems, the result of which is an upward radiative heat flux of 66 W/m^2. (Well, since you’re seemingly so against the term ‘heat flux’, then use the term ‘net energy flux’ instead.) You cannot include the one and exclude the other. They are two sides of the same coin (exchange process).
In what way is this wrong, Willis?
Manfred says:
June 20, 2013 at 12:34 am
Good question. I see the change in ocean heat content in large part as a direct result of one of the ways that the climate regulate the temperature, through the timing of the onset of tropical clouds. So I would suspect that it would vary quite a bit. You could think of it as your gas pedal when you have cruise control on in your car. The amount of fuel energy going to the car engine varies depending on the slope you are driving up.
In the same way, the system varies the amount of energy entering the system by varying the timing, amount, and color of the clouds. These are specific changes in specific areas of the world, and will perhaps not show up in global averages. But they are controlling the input of energy as well as the throughput of energy.
As I said above, leave the amount of cloud cover exactly the same in the tropics, but push it back by one hour. During the day you get increased sun into the ocean. During the night, you get reduced losses from the ocean. These total more than 3 W/m2 on a 24/7 basis.
I think you mean “4.2%” rather than 42%, but as I said, cloud cover variations are not the only possibility.
Another obvious example is a shift in currents. These are occurring constantly at many temporal and spatial scales. For example, consider the huge oceanic heat loss that occurs during an El Nino/La Nina pump cycle. Vast quantities of heat are removed from the tropics as warm water and transported to the poles, where they rapidly lose energy through the usual means.
I’ve never calculated the total amount of heat flow of one of these El Nino/La Nina pump cycles, it’s on my to-do list. I would not be surprised, however, if it added up to a watt per square metre or so.
Or consider the currents that hit the continental shores and upwell. They bring billions of tonnes of cold water up from well below 2000 m, and often to the surface. Remember we’re only looking at 45% of the ocean volume, the upper layers. So any intrusion of water from the deeper layers alters the heat content of the upper 2000m of the ocean. Note also that what goes up must come down. So when a current hits a coast and upwells, bringing water from the deeps up to the 2000m level, somewhere an equivalent amount of water (of unknown heat content) is sinking from the 0-2000m level and going back into the deeps.
Note that this is a way that the 0-2000m OHC can increase and decrease, with absolutely no change on the surface. It could all happen underwater, with nothing to do with clouds or evaporation or anything.
Speaking of evaporation, that brings me to wind. Evaporation varies linearly wind speed. The globe loses on the order of 80 W/m2 from evaporation on a 24/7 average basis to evaporation.
This means that a 5% change in average wind speed means a change of 4 W/m2 in evaporative heat loss. From memory global average wind speed is about 7.6 knots, so if it went to 7.2 knots, that alone would give you your 4 W/m2 increase in ocean heat content
So yes, I can think of lots of ways that the ocean can vary its heat content that don’t involve changes in average cloud cover, and one that doesn’t involve the surface at all. You’ve excluded lots of possibilities.
Having said that, I think that some of the large annual excursions are merely a function of the large error bars in the data.
For example, given the known errors, in only nine of the 58 years was the annual change in OHC larger than the error bars of the OHC of two years involved. In other words, we can’t say anything about those annual changes in OHC at all, because the two succeeding OHC values are not statistically different from each other.
Best regards,
w.
Kristian says:
June 20, 2013 at 1:11 am
Nonsense. I have quoted your words exactly. You denied saying it, and asked where you have said the contrary. I quoted those words to you. I’ve been very, very specific about the exact nature of your misunderstanding.
As a result, your handwaving tirade above is laughable. Sorry, but I’ve been most detailed from the start.
Sure, be glad to. Heat is the net of all of the energy flows into and out of a body. It is unidirectional, and always goes from hot to cold. It is a concept, not a physical flow, so it can’t “fly around” anywhere.
You, on the other hand, talk of impossibilities like this:
Now, that totally goes against the agreed upon physical definition. There is no such thing as a “radiative heat flux”. There are only radiative flows of energy, not of heat. The radiative energy flows in both directs between two objects like say the atmosphere and the surface.
The NET of these two energy flows to and from a given body is called heat.
So it is NOT TRUE under the agreed upon physical definition that solar energy is a “heat flux”, or that DLR is not a “heat flux”. Not only is it not true, it doesn’t mean anything. In the agreed upon physical definition, all electromagnetic radiation is a flow of energy, not a flow of heat. Solar radiation is not a “heat flux” as you wrongly claim, because there is no such thing. It is an energy flux.
Heat is the net of the gains and the losses of all of the energy fluxes that affect the body. It’s not a separate flow of some kind.
And certainly, your claim that solar radiation is a “heat flux” and longwave electromagnetic radiation is not a “heat flux” makes no sense at all.
This is because in terms of radiant energy exchange, “heat” doesn’t really exist. It’s a concept, not an actual flow of something.
By that I mean that the reality is that the surface of the earth radiates upwards at about 400 W/m2, and that the downwelling radiation from the atmosphere is about 325 W/m2. This means that the heat flow is upwards from the surface to the atmosphere, and is about 75 W/m2.
But that doesn’t mean that there is some physical upwards flow of 75 W/m2. There is no such flow of 75 W/m2. Heat is a concept, a way to understand reality. When I say heat doesn’t exist, I mean heat is not a physical flow of radiation somewhere. It’s merely the net of the actual physical flows, which are the flows of energy.
Heat loss is a number calculated by taking the sum of all the energy flowing into a body, and subtracting the flows of energy out of that same body. If the outflow exceeds the inflow, we say the body is losing heat. In the earth’s case, the surface is losing heat at the rate of 75 W/m2.
Note that the surface would lose heat much faster without the back radiation from the atmosphere. If the greenhouse gases (water vapor and co2) weren’t there, the heat loss would be 400 W/m2 instead of 75W/m2, and the surface would be much, much colder.
w.
Willis Eschenbach says, June 20, 2013 at 2:03 am:
“Heat is the net energy flow. It is unidirectional, and always goes from hot to cold.”
Thanks. That’s all I’m saying. Still you seem to be arguing that the inferred downward atmospheric radiative flux is somehow capable of heating the surface/ocean (like the solar flux) to a higher temperature than what the Sun could manage on its own. Even if we appear to agree that the ‘net’ radiative flux (the heat) between surface and atmosphere always on average goes up, the surface/the ocean radiatively loses ‘net energy’ (heat) to the atmosphere. Go figure.
How does heat loss make warmer?
Willis Eschenbach says:
June 19, 2013 at 10:57 am
Eric H. says:
June 19, 2013 at 6:38 am
Thanks Willis,
Some of my own ponderings: 1) If it cannot be shown that CO2 is heating the ocean then CAGW is done as a theory. 2) LWIR is only capable of penetrating water at a depth of millimeters and the amount of heat transfer rate change from an increase in CO2s LWIR is dwarfed by the amount of LWIR from clouds. 3) SWR can penetrate the ocean to a depth of 30 meters (if my memory serves) and changes in cloudiness and/or solar activity would have a much greater impact to OHC than LWIR from all sources. Is this correct?
Not really, or at least that’s not all there is to it. Once it strikes the ocean, long-wave infra-red (LWIR) is converted from radiant energy to thermal energy, so it adds energy to the ocean. See my post Radiating The Ocean for a “full and frank” discussion of the issues.
w.
Thanks Willis and Ian for your responses but I am not trying to argue that LWIR cannot heat the ocean my question is one of effectiveness which I apologize if this was lost in my post. The point I was trying to make is that changes in solar output and/or cloudiness are better explanations for an increase in OHC than CO2 due to a greater ability of solar and clouds to raise ocean temperatures. If clouds and solar cannot be ruled out then CO2 cannot logically be the cause. If CO2 can’t be shown to be the cause of increased OHC then CO2 cannot be the driver of climate change…
What I appear to have wrong was my thought that SWR was a greater forcing than LWIR which I incorrectly thought was due to penetration:
“So if the DLR isn’t heating the ocean, with heat gains of only the solar 170 w/m2 and losses of 390 w/m2 … then why isn’t the ocean an ice-cube?”
Again, thanks for the info, Eric
From Kristian on June 20, 2013 at 1:11 am:
An object can be heated to where the wavelength distribution peak for the energy emitted is strongly in the ultraviolet, the predominant emissions amounts are UV. Significant UV emissions come from the Sun, but also arc welding, and the rarefied gas inside a fluorescent tube yields little but UV.
The UV travels and strikes a fluorescing surface, resulting in the production of visible light. The UV wavelength energy transferred from the hotter object to the cooler object (surface) that is transformed to visible light, is heat?
Kristian, in addition to my comments above, let me return to this image.

The upper panel represents the two-way flows of money (or radiative energy).
The lower panel represents the net of the two flows, which is called profit/loss (or heat gain/loss).
As I said, both ways of looking at the transaction are valid, and present true information. And there is no contradiction between them.
But there is one very important difference.
The upper panel is a description of the physical reality. In that panel, I give you $100, and you give me $75. That’s what really happened. Same with the flows of radiative energy. They are real and physically measurable.
The lower panel is conceptual only. There was never a time when I gave you $25. I gave you $100, not $25. Heat, like profit, is a concept only, a way to gain understanding of a transaction.
I’m trying to get across that the energy flows are real, but heat is not. It’s a way to understand or simplify the situation, and a very valuable way to do that. But it’s not a real flow.
As a result, there’s no solar “heat flux” striking the earth as you claim. Nor are there some types of radiation that contain heat (solar) and some kinds that don’t contain heat (DLR) as you claim. Heat isn’t contained in any kind of radiation. Heat is a concept, not a physical flow of anything.
w.