Guest Post by Willis Eschenbach
According to the current climate paradigm, if the forcing (total downwelling energy) increases, a combination of two things happens. Some of the additional incoming energy (forcing) goes into heating the surface, and some goes into heating the ocean. Lately there’s been much furor about what the Levitus ocean data says about how much energy has gone into heating the ocean, from the surface down to 2000 metres depth. I discussed some of these issues in The Layers of Meaning in Levitus.
I find this furor somewhat curious, in that the trends and variations in the heat content of the global 0-2000 metre layer of the ocean are so small. The size is disguised by the use of units of 10^22 joules of energy … not an easy one to wrap my head around. So what I’ve done is I’ve looked at the annual change in heat content of the upper ocean (0-2000m). Then I’ve calculated the global forcing (in watts per square metre, written here as “W/m2”) that would be necessary to move that much heat into or out of the ocean. Figure 1 gives the results, where heat going into the ocean is shown as a positive forcing, and heat coming out as a negative forcing.
 Figure 1. Annual heat into/out of the ocean, in units of watts per square metre.
I found several things to be interesting about the energy that’s gone into or come out of the ocean on an annual basis.
The first one is how small the average value of the forcing actually is. On average, little energy is going into the ocean, only two-tenths of a watt per square metre. In a world where the 24/7 average downwelling energy is about half a kilowatt per square metre, that’s tiny, lost in the noise. Nor does it portend much heating “in the pipeline”, whatever that may mean.
The second is that neither the average forcing, nor the trend in that forcing, are significantly different from zero. It’s somewhat of a surprise.
The third is that in addition to the mean not being significantly different from zero, only a few of the individual years have a forcing that is distinguishable from zero.
Those were a surprise because with all of the hollering about Trenberth’s missing heat and the Levitus ocean data, I’d expected to find that we could tell something from the Levitus’s numbers.
But unfortunately, there’s still way too much uncertainty to even tell if either the mean or the trend of the energy going into the ocean are different from zero … kinda limits our options when it comes to drawing conclusions.
w.
DATA: Ocean temperature figures are from NOAA, my spreadsheet is here.
Willis,
Really appreciate looking at this from average power density rather than total joules to gain proper perspective.
Performing a simple numerical integration using the “trapezoidal rule” on the data from your spreadsheet yields 0.21W/m^2 averaged over the 57 year period.
Doesn’t seem like much to be worried about relative to the earth’s average solar insolation and known negative feedback mechanisms i.e. thunderstorms.
Reducing this by a factor of 37.5, as indicated by Bob Tisdale’s update, yields an average 0.0057W/m^2 averaged over the 57 year period.
Not going to worry over this one bit
jai mitchell says:
June 19, 2013 at 10:43 am
“Jeff Norman
when you said,
The interesting (bizarre) part of their argument requires that the energy flux at the surface has to be orders of magnitude higher in the areas where there is downwelling.
————
This isn’t really true at all, in the tropics where the heat is absorbed by the ocean only a very small change in the mixing/efficiency of heat energy transported into the deeper waters would produce the measured warming in this article.
maybe about 1.2% increased absorption in the tropics would do it. See the following graphic.”
You do know that the downwelling of CO2 rich cold water happens near the poles, right?
http://en.wikipedia.org/wiki/File:Thermohaline_Circulation_2.png
Eric H. says:
June 19, 2013 at 6:38 am
Not really, or at least that’s not all there is to it. Once it strikes the ocean, long-wave infra-red (LWIR) is converted from radiant energy to thermal energy, so it adds energy to the ocean. See my post Radiating The Ocean for a “full and frank” discussion of the issues.
w.
DirkH
Yes, I know about the Meridional Overturning Circulation. what is it you are trying to say? That the normal amount of ocean convective heat transport determines the only way that heat energy can be transferred into the deeper oceans?
You do realize that the only way the “CO2 rich” water sinks is because it gets colder (and has a higher salinity) Which means that the absorbed heat from the tropics is released into the atmosphere.
This is why Europe stays warmer than Montana and the Dakotas even though they are at the same latitude.
The point is a very small amount of surface mixing and transport of the 40 Watts per meter squared energy absorption that occurs in the oceans from -30 to +30 latitude is needed to completely hide the global warming signal
AND
This is exactly what happens during a negative PDO (and La Nina)
richard verney
The reason the oceans don’t freeze is because water that gets colder gets denser and sinks. Then warmer water takes its place. That is why the surface of a pond freezes but you can still ice fish 🙂
During the day coelacanths rest in caves as much as 5°C warmer than ambient water. This suggests that their physiology is still adapted to some extent to the Devonian surface temperature at which their vestigal lung evolved, while for survival these slow, energy efficient swimmers feed in cold, deep water. But the question arises, why are these caves warm? Possible contributing factors include: 1) ground heat, which would produce some 70mW/m^2 on much of the cave surface; 2) communal coelacanth body heat; 3) relict heat from occasional episodes of warm saline water flowing from the Red Sea or Persian Gulf.
At any rate there certainly exist mechanisms for transporting surface heat downward, including both tide turbulence at all depths and downwelling warm saline water. –AGF
It is worth re reading Willis’ previous post on Levitus.
It is also worth noting the comment made by Manfred (see his post of May 10, 2013 at 7:46 pm). It is so important that I set it out again in full:
“Just to show how implausible the 1 E23 Joules increase during the approx. 2 years around 2003 is:
Global ocean surface is 361 E12 m2.
2 years have 63 E6 seconds.
That means average heat uptake of oceans must have been
1E23 Watt *s / (361 E12 m2 * 63 E6 s)
= 4.4 W /m2 in the 2 years around 2003.
Compare this with with the IPCC AR4 estimate of ocean heat uptake of 0.2 W/m2.
There is no way that oceans took up as much heat in 2 years around 2003 as in all other years between 1970-2010 combined (see figure 2).”
Retired Engineer John says, June 19, 2013 at 9:55 am:
“Energy is the ability to do work, whether it is to move an object or to heat an object. Radiated energy becomes heat, electrical energy (solar cells) or chemical energy (photosynthesis) when it is absorbed.”
Er. No, John. Energy does not ‘become’ heat upon absorption. This is such a basic concept that I simply can’t fathom why educated people have such a hard time grasping it but instead keep on mixing it up.
‘Heat’ is called ‘heat’ for a reason. ‘Heat’ heats.
Heat is energy transferred from a hotter to a colder system. So that the hotter system heats the colder system. Heat only ever spontaneously moves in this SINGLE direction. Cold cannot heat hot. That’s all you ever need to know.
The direction of movement of a block being pushed forward by a strong force will not be reversed if applying a weaker force pushing up from the opposite side. All that happens is a slowing down of the block’s forward acceleration. F-> is reduced because ma-> is reduced. There is less ‘work’ done per unit of time.
Just like heat transfer. Put a less cool object than before in front of the warm object and Q-> is reduced because (Th^2 – Tc^2) is reduced. The direction of the energy transfer, however, is not reversed. There is still no ‘heat’ going from the cool object to the warmer. Not at all. And remember, only energy in the form of ‘heat’ heats (disregarding ‘work’, which also only goes one way). The opposing object will have to be, surprise, surprise … warmer than the warm object in order to be able to accomplish that.
As soon as people stop considering all energy to be heat and hence that heat can travel in all directions only more in some than in others (it can’t and it doesn’t), this whole bizarre notion that ‘DLR heats the oceans’ will dissolve at once. ONLY the Sun heats the oceans from above. Why? Because the Sun is hotter than the Earth’s surface and can thus function as a heat source (a ‘hot reservoir’). A revolutionary idea, don’t you think?
Anthony
“Makes me wonder how Murphy finds such a large trend in OHC, but Levitus does not find any trend in forcing.”
I’m sure both Anthony and Willis know very well that once you have put the water boiler on you don’t need a “trend in forcing” to get the water boiling.
Spencer produced the same graph two years ago btw.
Kristian says: June 19, 2013 at 11:43 am
Kristian, get yourself a good physics textbook and read it.
This is probably a dopey comment. But I’m far from convinced anyone really knows much about temperature or heat in the oceans. ARGO hasn’t been going long enough and there aren’t enough of them.
And the people beating the scare drums are proven incompetent liars.
But what about heat coming up from the core?
Doesn’t that matter? There was a paper earlier this year suggesting a core temperature of 6,000ºC. Instead of 5,000ºC aassumed previously by everyone except Al Gore. Doesn’t this make a difference? What about all those pesky vents?
Not sure about ocean temperatures 2,000 m deep (or much more). Don’t think it is all that hot.
1,000 m down a coal mine is bloody hot.
Just a thought.
There are three ways to account for a global energy imbalance (at the ToA). Either 1) there is more coming IN, 2) there is less going OUT, or both, or 3) something happened at some point (or across a stretch of time) where the cooling mechanisms of the Earth system all of a sudden fell way behind the solar warming mechanism, without the solar necessarily in itself increasing. After such a threshold being crossed, the cooling mechanisms would have to start playing catch-up. In the meantime, until balance after some time, depending on the original gap, became restored, there would be global warming (a net global accumulation of energy).
Well, global OLR has increased rather than decreased over at least the last three decades of observed global warming. That’s Earth strengthening its cooling to space while still warming. That’s an impossible combination if the atmosphere were to be the cause of the warming. You cannot create a positive energy imbalance by increasing the heat loss and keep the heat gain steady. Either you increase the heat gain or you reduce the heat loss.
The only way the atmosphere could induce warming is by restricting or limiting the cooling (assuming absorbed solar flux to be pretty much constant). Increased cooling during warming points to a (lagged) Earth system response to solar input, not to the atmosphere being the cause of the warming.
This has a lot to do with the variation in cloud cover above the tropical oceans. This to a large extent governs how much solar heat is absorbed by the Earth system. Heat gain. The ENSO process is the main controller of this variance. However, it also has a lot to do with tropical pressure gradients –> tropical mean wind stress across the ocean surface –> mean release of latent heat through evaporation from the tropical oceans. Heat loss.
Something clearly happened pressurewise in the Pacific Ocean in the mid 70s:
http://i1172.photobucket.com/albums/r565/Keyell/SOIvslatentampwind_zps8dcdab36.png
Is the latent heat flux forced to play catch-up from 1978/79 (upon the completion of the Great Pacific Climate Shift) onwards …?
2 conclusions
1. If there is more heat going into the deep ocean, the body of water to be heated is much larger than previously thought, requiring less surface warming and a lower sensitivity.
2. As temperature increases in deep ocean are only of the order of hundredths of a degree since 1750, that heat can never recombine to generate a warming of say additonal 1 degree on the surface once deep water upwells. Entropy cannot be reduced.
Therefore heat going into deep ocean is not much different from going back to space.
Retired Engineer John says, June 19, 2013 at 12:21 pm:
“Kristian, get yourself a good physics textbook and read it.”
I don’t have to, John. I’m not the one not getting (or simply misrepresenting) what the basic thermodynamic concept of ‘heat’ is and means.
Great post and excellent observation, unexpected oddities are a fecund source of new discovery. So the thermal budget associated with measured ocean temperature changes is small and insignificant? Reflecting on this, the word that comes to me is thermocline. When I was studying oceanography at Uni back in the early 80’s, the thermocline was presented as a central feature and impassible obstacle in ocean heat dynamics. There is surface vertical mixing above it, and deep circulation below it, but not much exchange across this sharp thermal barrier.
but like so much historic established research this understanding of the thermocline has been brushed aside by “climate science”. Now we are told that large amounts of peccatogenic heat can fly down in practically real time from the atmosphere to 2000m ocean depths without any thought of obstruction by the thermocline.
However, Willis’ finding of only small heat changes measured in the oceans suggests that the thermocline might indeed be a real barrier, and that thermal budget above it and maybe below it also is something of a zero sum game. Are SSTs hot? This is from stratification meaning that deeper down it remains colder. Vice versa when above-thermocline mixing causes cooler SSTs. So Willis’ data may point to a damping and stabilising role of the thermocline.
This combined with the gigantic heat capacity of the oceans may mean one has to look to century and millenial timescales to notice the oceans’ thermal dynamics.
The PRIMARY role of the physical sciences is to notice the countless procession of things we can’t simply quantify. Failing to understand this is the Achilles heel of modern sciences and the “Enlightenment” mentality in all fields. Modern science ever portends a grasp of reality, just around that corner if not sooner.
This is the fallacy of the assumption of knowledge without proof. Add to that the fallacy of “not knowing” as a failure.
serious error in the trend calculation here. i find
0.23 plus-or-minus 0.02 W/m2 (2-sigma)
which is easily statistically significant.
REPLY: Stan, show your work. Just saying there is an error with out showing how/why is meaningless – Anthony
the work is easy — just use excel to calculate the data’s slope and its uncertainty. for 0-700 meters it is
0.265 plusmn 0.020 *10^22 J/yr
then divide by the area of the ocean (361.8 M sq-km)
Kristian says:
June 19, 2013 at 12:42 pm
“I’m not the one not getting (or simply misrepresenting) what the basic thermodynamic concept of ‘heat’ is and means.”
Um, yes you are. I am the third or fourth person to call you out on it. I’m pretty sure we are all non-warmists. You are not helping us. You are making long posts which thereby become representative to onlookers, and paint us all in a bad light. Please stop.
Ximinyr says: “the work is easy — just use excel to calculate the data’s slope and its uncertainty. for 0-700 meters it is…”
But Willis presented data for depths of 0-2000 meters
Regards
Bob Tisdale says:
June 19, 2013 at 9:11 am
“http://i42.tinypic.com/347d1xl.jpg”
Good graph.
Info like that plot tends not to be posted in a location many readers would see but should be. That shows the claimed actual temperature variation in Kelvin, amounting to a few thousandths of a degree over the years and decades, not converted to another metric hiding how tiny it is. To place much stock in trusting such, one would have to believe that temperature over that volume of ocean is both measured with 0.001K level accuracy and so reliably reported, at the same time even something with far more potential independent verification, reported U.S. surface temperature history, has 0.3+K variation.*
*
http://www.giss.nasa.gov/research/briefs/hansen_07/fig1x.gif
…is very contradictory to
http://data.giss.nasa.gov/gistemp/graphs_v3/Fig.D.gif
…as the former shows the 5-year mean of U.S. surface temperature was 0.4 degrees Celsius colder during the local high in the 1980s than during the high in the 1930s, but the latter had those two times under 0.1 degrees Celsius apart in the same 5-year mean.
Contradiction is further illustrated about two-thirds of the way down in http://s9.postimg.org/3whiqcrov/climate.gif which enlarges on click, with lines drawn to be more blatant.
The most useful thing about the deep ocean is that because it deep and massive its very hard to measure anything down there and there ‘could be’ lots of things there , indeed perhaps more is know about the moon than the deep oceans so our knowledge is not good .
Which for the AGW faithful means that lots of things can be ‘claimed’ via modelling to be true about it because these claims cannot be disproved . Now in normal science that would mean your theory is at best only a ‘theory ‘ But in ‘special’ Trenberth science strong belief in the models is all you need has definitive proof .
Bart says, June 19, 2013 at 2:13 pm:
“Um, yes you are. I am the third or fourth person to call you out on it.”
Calling me out on what, Bart? You’re calling but you’re not showing anything.
What is ‘heat’ to you, Bart? Does it fly around in every direction? Show me how my definition of ‘heat’ goes against the physical definition. Show me how the atmosphere is a source of heat for the surface, how it transfers heat downwards. Do that instead of submitting meaningsless, unsubstantiated “Um, yes you are” comments …
Bart says to Kristian:
“Please stop.”
Yes, Kristian. Please stop. Stop before Bart starts drowning in his own drivel of cognitive dissonance.
Ximinyr says:
June 19, 2013 at 1:19 pm
Ximinyr says:
June 19, 2013 at 1:27 pm
No, it’s not “easy”, and you do need to show your work rather than just say “the work is easy”. Easy work in climate science is often the hardest.
It’s hard to say because you haven’t shown your work, but I suspect you have forgotten to adjust for autocorrelation. The autocorrelation of the 0-2000 metre layer temperatures is very high, so that reduces the significance of any trend, as I pointed out above.
I use the method of Nychka (pdf), if you are interested in doing it yourself. See in particular Section 4.4.4.
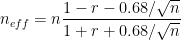
It calculates an “effective N”, which is the number of data points you effectively have.
where “n” is the number of data points, and “r” is the lag-1 autocorrelation of the detrended series.
For the Levitus dataset, n = 58. But because of the very high autocorrelation (detrended autocorrelation = 0.78), if you plug those numbers into the formula you get an effective n of only four data points …
Of course, this affects the “degrees of freedom” for calculating the significance of the trend. And that, in turn, gives the trend of the ocean heat content of the 0-2000m layer a p-value of 0.08, meaning it is not statistically significant.
Please remember this lesson the next time someone asks you to show your work, and you get your back up and say it’s “easy”. You’re right, we’re only asking in order to find flaws in it … and the name of that process is “science”.
All the best,
w.