The Guardian has a new blog called Climate Consensus – The 97%. The two primary authors are to be Dana Nuccitelli, a regular contributor at SkepticalScience, and John Abraham, Associate Professor at the University of St. Thomas.
Dana Nuccitelli’s first post at his new blog at The Guardian is titled “Why is Reuters puzzled by global warming’s acceleration?” His article is subtitled, “‘Climate scientists struggle to explain warming slowdown,’ said Reuters. But warming is speeding up, and scientists can explain it.” Nuccitelli’s first post at The Guardian is reminiscent of his posts at SkepticalScience—that is, it’s misleading and full of misinformation.
Data contradict the points Dana Nuccitelli is trying to make. In this post, we’ll briefly discuss ocean heat content data, how Mother Nature—not manmade greenhouse gases—creates warm water during La Niña events, how she releases that naturally created warm water during El Niño events and redistributes it around the oceans afterwards, and we’ll discuss Dana Nuccitelli’s misleading animation called “The Escalator”. Data explains how and why the vast majority of global warming occurred naturally…when it warmed.
OCEAN HEAT CONTENT
Nuccitelli begins his post with a picture from space of the Pacific Ocean with the caption:
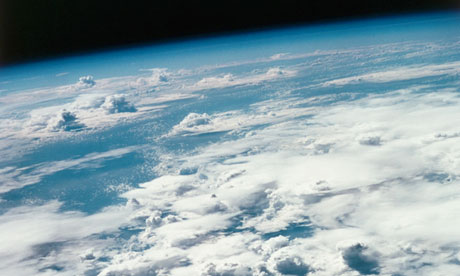
Oceans, such as the Pacific pictured here from space, are absorbing much of the warming the planet is currently experiencing. NASA/ Roger Ressmeyer/ Corbis
Then the first sentence of his post reads:
The rate of heat building up on Earth over the past decade is equivalent to detonating about 4 Hiroshima atomic bombs per second.
Based on Nuccitelli’s opening illustration and statement, we should expect the ocean heat content of the Pacific Ocean to be showing a monumental amount of warming over the past 10 years. But, as shown in Figure 1, the ocean heat content data for the Pacific Ocean from pole to pole (90S-90N, 120E-80W) shows cooling. Right from the get go, data disagrees with Nuccitelli’s representations.

Figure 1
The NODC’s Ocean Heat Content data used in Figure 1 (and in the other ocean heat content graphs in this post) is the only regularly updated dataset of its kind that’s available to the public on a gridded basis through the KNMI Climate Explorer. There, users can select the coordinates of the data they desire. The NODC’s ocean heat content data represents the change in the heat stored in the oceans to depths of 700 meters or about 2300 feet.
The article in The Guardian also fails to describe all of the problems associated with ocean heat content data. Before the ARGO floats were deployed starting in the early 2000s, the temperature observations at depth were so sparse that the data has to be taken with more than a grain of salt, especially when dealing with the data below 700 meters. And the ARGO-era ocean heat content data has been adjusted so many times it’s difficult to keep track of all of them. Many of the problems with ocean heat content data were described in the blog post Is Ocean Heat Content Data All It’s Stacked Up to Be? It’s a long post, I’ll grant you that, but if you’re interested in ocean heat content data, it’s worth a read. Bottom line: even with all of the adjustments to the ARGO-era that added warming to the ocean heat content data, the Pacific data shows cooling over the past 10 years—contrary to what Dana Nuccitelli implied with his opening statement and illustration.
HOW LA NIÑAS CREATE WARM WATER IN THE TROPICAL PACIFIC
Nuccitelli continues:
We often hear from the media that the (surface air) warming has slowed or paused over the past 15 years. This isn’t a puzzle; climate scientists are well aware of several contributing factors, as a recent Reuters article – “Climate scientists struggle to explain warming slowdown” – eventually discussed. The accelerated warming of the oceans is likely the main contributor.
During years with La Niña events, more heat is transferred to the oceans, and surface temperatures are relatively cool as a result. The opposite is true during El Niño years. During the 1990s, there were more El Niño than La Niña events, which resulted in more surface air warming. One of the strongest El Niño events of the century happened in 1998, which not coincidentally was 15 years ago.
Dana fails to explain that Mother Nature, not greenhouse gases, creates ocean heat in the tropical Pacific–where El Niño and La Niña events take place. During La Niña events, the trade winds in the tropical Pacific are stronger. The stronger trade winds reduce cloud cover, which, in turn, allows more sunlight (also known as penetrating solar radiation because it penetrates into the oceans) to warm it. That’s why the long-term warming of the ocean heat content for the tropical Pacific was plainly caused by the 3-year La Niña events of 1954-57, 1973-76 and 1998-01, and during the freakish 1995/96 La Niña. Keep in mind that the 1995/96 La Nina provided the fuel for the 1997/98 El Niño, which was discussed by Nuccitelli. See Figure 2.

Figure 2
To further illustrate the role of La Niñas in the warming of the tropical Pacific, Figure 3, the ocean heat content there would have cooled since the 1950s without the 1973-76 and 1995/96 La Niña events.

Figure 3
Back to Nuccitelli’s statement:
During years with La Niña events, more heat is transferred to the oceans, and surface temperatures are relatively cool as a result. The opposite is true during El Niño years. During the 1990s, there were more El Niño than La Niña events, which resulted in more surface air warming.
That discussion is also misleading for other reasons. Sea surface temperatures (not ocean heat content) in the tropical Pacific cool in response to La Niña events because more cool waters than normal are being upwelled from below the surface of the eastern equatorial Pacific. Marine air temperatures and lower troposphere temperatures cool in response because the tropical Pacific is releasing less heat than normal through evaporation as a result of the cooler surface waters. (That cooler upwelled water is then warmed by the La Niña-caused additional sunlight as it travels from east to west across the tropical Pacific, and it collects in an area east of Indonesia called the west Pacific Warm Pool, where it warms the ocean heat content of the tropical Pacific.)
Note: The sea surface temperature data presented in this post is NOAA’s best: the Optimum Interpolation Sea Surface Temperature data, version 2, also known as Reynolds OI.v2. It’s a combination of observations from satellites, buoys and ship inlets. As noted in the link:
The optimum interpolation (OI) sea surface temperature (SST) analysis is produced weekly on a one-degree grid. The analysis uses in situ and satellite SST’s plus SST’s simulated by sea-ice cover. Before the analysis is computed, the satellite data is adjusted for biases using the method of Reynolds (1988) and Reynolds and Marsico (1993).
EL NIÑO EVENTS
An El Niño event releases that La Niña-created warm water from below the surface of the west Pacific Warm Pool, and an El Niño spreads that warm water eastward across the eastern tropical Pacific. There was so much warm water released by the 1997/98 El Niño that the sea surface temperatures for the entire East Pacific Ocean (from pole to pole or the coordinates of 90S-90N, 180-80W) temporarily warmed 0.5 to 0.6 deg C. See Figure 4. The East Pacific Ocean with those coordinates represents about 33% of the surface of the global oceans, so that was a monumental amount of naturally created warm water that was released by the 1997/98 El Niño. Notice also that the East Pacific sea surface temperature data hasn’t warmed over the 31 years of that dataset, based on the linear trend.

Figure 4
All of that naturally created warm water that’s now on the surface doesn’t simply disappear after a strong El Niño. Ocean currents redistribute that leftover warm water to adjoining ocean basins (which prevents the sea surface temperatures for remote areas, like the North Atlantic, from cooling proportionally during the trailing La Niña). The leftover warm water (and its counteracting effects on the trailing La Niña) is why the sea surface temperatures for the Atlantic, Indian and West Pacific Oceans warmed in a very obvious upward step of about 0.19 deg C, Figure 5, in response to the 1997/98 El Niño. Note that there was also a strong upward shift in response to the 1986/87/88 El Niño and a smaller step in response to the 2009/10 El Niño.

Figure 5
Without those El Niño events, the sea surface temperatures for the Atlantic, Indian and West Pacific Oceans would not have warmed since the early 1980s.
Nuccitelli was right with his statement, “During the 1990s, there were more El Niño than La Niña events, which resulted in more surface air warming.” But he failed to advise his readers:
1. that land surface air temperatures represent only 30% of the global surface temperature record,
2. that sea surface temperature data represent the other 70%,
3. that the satellite-era sea surface temperature data indicate sea surface temperatures warmed naturally in response to the naturally created warm water released from below the surface of the tropical Pacific during strong El Niños, and
4. that the warming of land surface air temperatures is primarily a response to the warming of sea surface temperatures.
For more information, including a discussion of the natural warming of ocean heat content data, refer to my illustrated essay “The Manmade Global Warming Challenge” [42MB]. For even more information, there’s more detail in my ebook Who Turned on the Heat? which was introduced in the blog post here. It’s available in pdf form here for US$8.00.
THE ESCALATOR
Nuccitelli goes on to write:
Reuters didn’t connect the dots between these two articles, telling us one week that oceans help explain the surface warming slowdown, and the next week claiming the slowdown is puzzling climate scientists. However, these ‘slowdowns’ happen on a regular basis. You can find one every 5 to 10 years in the surface temperature data, as illustrated in a graphic I created nicknamed ‘The Escalator‘.
The escalator is included here as Animation 1.
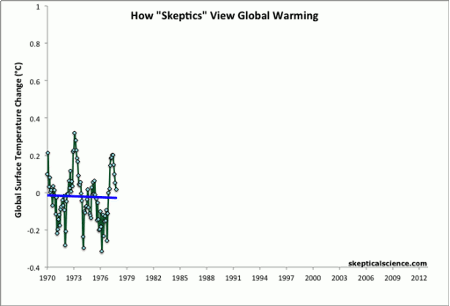
Animation 1
The caption for “The Escalator” reads:
Average of NASA GISS, NOAA NCDC, and HadCRUT4 monthly global surface temperature anomalies from January 1970 through November 2012 (green) with linear trends applied to the timeframes Jan ’70 – Oct ’77, Apr ’77 – Dec ’86, Sep ’87 – Nov ’96, Jun ’97 – Dec ’02, and Nov ’02 – Nov ’12.
Let’s drop back to what Nuccitelli wrote earlier:
One of the strongest El Niño events of the century happened in 1998, which not coincidentally was 15 years ago.
When people say ‘no warming in 15 years’, they’re cherry picking the timeframe to begin in an abnormally hot year.
“The Escalator” by definition is an exercise in cherry picking. Let’s illustrate, with the same data used by Nuccitelli, how global surface temperatures actually warmed without cherry picking the time periods. We’ll simply highlight 3 naturally occurring events, and use them as start and end years for shorter-term data illustrations.
Figure 6 shows the global land surface air temperature plus sea surface temperature anomalies (average of GISS LOTI, HADCRUT4 and NCDC datasets, like The Escalator) before, during and after the 1997/98 El Niño. The data highlighted in red are for the official El Niño months of the 1997/98 El Niño from NOAA’s Oceanic NINO Index. There was little warming during the years leading up to the 1997/98 El Niño and in the years following it. I’ve included period-average temperatures in blue to help highlight that fact. The dip in 1991 and rebound in 1994 is associated with the explosive volcanic eruption of Mount Pinatubo. That cooling is a response to the decrease in penetrating solar radiation caused by the “shading” effects of aerosols spewed into the stratosphere by the explosive volcano—not from a decrease in manmade greenhouse gases. That aside, the vast majority of the warming during the period of March 1988 to February 2013 was caused by the monumental amount of naturally created warm water released from below the surface of the tropical Pacific by the 1997/98 El Niño and redistributed on the sea surface after it–warm water that was created during the 1995/96 La Niña.

Figure 6
You’re probably wondering why I started the graph in Figure 6 at March 1988. That’s the first month after NOAA’s official months for the 1986/87/88 El Niño. If we look at the global surface temperature anomalies from March 1977 to April 1997 (the month before the 1997/98 El Niño), Figure 7, we can see that the 1986/87/88 El Niño caused a similar upward shift in global surface temperatures. The upward steps in Figures 6 and 7 are blatantly obvious when we break the data down into logical shorter time periods before and after the strong El Niño events. (Note: There was also a very strong El Niño in 1982/83, but the eruption of El Chichon in 1982 counteracted the impact on global surface temperatures of all of the warm water it released.)

Figure 7
Now for the period before the 1986/87/88 El Niño: See Figure 8. I’ve started the graph 10 years before The Escalator to show how “flat” global temperatures were leading up to the upward step in global temperatures in 1976. That step is associated with the Pacific Climate Shift, when the sea surface temperatures of the East Pacific ocean suddenly shifted upwards. There are numerous peer-reviewed papers that attempt to explain that natural warming, many with different causes and effects. That shift coincides with the end of the 1973-76 La Niña, which created, as shown Figure 2, the initial warm water used by the trailing El Niño events until the 1995/96 La Niña. Regardless of the cause, there was an obvious upward shift in global surface temperatures in 1976. I’ve highlighted in red the official months of the 1976/77 El Niño as a proxy for the climate shift. The upward step is pretty tough to miss. And again, I’ve used period average temperatures (in blue) before and after the 1976 climate shift to help illustrate its impact on global surface temperatures and to show how “flat” global temperatures were before and after that shift.

Figure 8
Now, if we merge all of the data from Figures 6 through 8, we have a more realistic view on how, when and why global surface temperatures warmed—a more realistic escalator. See Figure 9. There was no cherry picking involved, just a little common sense to highlight the primary causes of global warming since 1960.

Figure 9
CLOSING
Ocean heat content data for the Pacific Ocean contradicts Dana Nuccitelli’s opening statement and illustration. The ocean heat content data for the tropical Pacific show that Mother Nature is responsible for the fuel for El Niño events. Ocean Heat Content data and satellite-era sea surface temperature data also indicate the oceans warmed naturally, but you have to understand that ENSO works as a recharge-discharge oscillator (with La Niña as the recharge mode and El Niño as the discharge mode) to see Mother Nature’s handiwork. And as illustrated, Dana Nuccitelli’s Escalator is simply another way for global warming enthusiasts to hide how global temperatures actually warmed since 1976. In short, data contradicts Dana Nuccitelli’s first post at The Guardian’s new blog.
Feel free to furnish a link to this post at Dana Nuccitelli’s new home at The Guardian. The more the merrier. Unlike SkepticalScience, I don’t believe The Guardian has a track record of deleting comments that disagree with the hypothesis of human-induced global warming. And if Nuccitelli’s posts at The Guardian are similar to his posts at SkepticalScience, he’ll be presenting “The Escalator” again and again, so you can link this post to his future uses of The Escalator at The Guardian, too. And don’t forget the YouTube video On the SkepticalScience Video “Global Warming over the Last 16 Years” when he links that video from SkepticalScience.
In the days of Outhouses” the guardian” would not be consigned to the hook! ( one must be most careful )
Sasha asks “Why is anyone bothered with what the Guardian has to say about AGW. There is a pattern to their coverage and you can see this after any significant press or online article which comprehenively trashes the Global Warming myth.”
Because unfortunately, The Guardian is still the broadsheet of choice of many if not most opinion formers in the UK (and even worldwide). It’s read by other journalists, politicians of the left and centre, policy makers for all but the Tory party and UKIP, by people active in local politics. And above all, it’s the paper of choice for by far the majority of left-leaning teachers at both school and University /College level. This is why The Guardian is so dangerous; it continues to have an influence far above the level its readership % would justify.
Moreover the people who read the Guardian affect to despise The Telegraph and above all the Daily Mail – you can read posts denigrating those papers in every comment thread on The Guardian. Its readers meanwhile are active in the comments threads on every environmental column and on other papers’ websites etc etc – they are eco-warriors of the most rabid kind to a man, and woman.
That Nuccitelli has been given a blog there only serves to underline how averse to the truth their editor, management and readership is. And their moderators ensure the gospel of CAGW is not questioned.
PS to the above: I think letters to the editor calling attention to this post, with a pithy quote, would do more good than posting on the blog comment thread, where comments will quickly be deleted.
Bob: this is what I advise you to do.
TLM says: “So why don’t the oceans as a whole cool down after an El Nino?”
The sea surface temperature anomalies for the East Pacific show cooling if they’re adjusted for volcanic aerosols:
http://bobtisdale.files.wordpress.com/2013/04/03-east-pac.png
That graph is from my most recent sea surface temperature update:
http://bobtisdale.wordpress.com/2013/04/08/march-2013-sea-surface-temperature-sst-anomaly-update/
And the sea surface temperatures for the South Atlantic, Indian and West Pacific Oceans also cool between the major El Niño events, so much so that that subset would also show cooling without the strong El Niños:
http://oi47.tinypic.com/24zgfgk.jpg
That leaves the North Atlantic, but it has another mode of natural variability called the Atlantic Multidecadal Oscillation…
http://i36.tinypic.com/2liy2a0.jpg
…which is why it doesn’t cool between the strong El Niños.
That was explained in the essay linked in the post, which you appear to have overlooked:
http://bobtisdale.files.wordpress.com/2013/01/the-manmade-global-warming-challenge.pdf
TLM says: “Could it be that increased levels of greenhouse gases in the atmosphere are slowing down the escape of the LWR emitted by the seas (heat) meaning that the energy gained during a La Nina does not have time to escape the atmosphere before then next El Nino kicks in and bumps temperatures up a notch?”
As shown in the above linked essay, there is nothing in the ocean heat content data or satellite-era sea surface temperature data to indicate that manmade greenhouse gases have had any impact on the warming of the global oceans. If you’d like to carry your argument further, please provide links to the climate model-based peer-reviewed studies that explain:
1. Why the sea surface temperatures of the East Pacific haven’t warmed in 31 years.
2. Why the seas surface temperatures of the Atlantic, Indian and West Pacific Oceans only warmed during the strong El Niño events of 1986/87/88, 1997/98 and 2009/10.
3. Why the warming of the ocean heat content data for the tropical Pacific is dependent on the 1973-76 and 1995/96 La Niña events, and without those La Niñas the ocean heat content for tropical Pacific would cool.
4. Why the warming of the ocean heat content of the North Pacific (north of the tropics) is dependent on a 2-year climate shift (1989-90), and without that climate shift, the ocean heat content for the North Pacific would cool.
I’ll save you some time looking. There are no studies that explain why sea surface temperatures and ocean heat content actually warmed as they did.
You later corrected: “…energy gained during a La Nina does not have time to escape during and after an El Nino before the next La Nina kicks in and starts to recharge the ocean heat content?”
First, the vast majority of the warm water created by a La Niña and that fuels an El Niño is below the surface and the oceans release heat at the surface. Second, the La Niñas in question occur immediately after El Niños and are responses to them. ENSO basics. The 1973-76 La Niña trailed the 1972/73 El Niño. The 1995/96 La Niña trailed the 1994/95 El Niño. And the 1998-01 La Niña trailed the 1997/98 El Niño.
Regards
I doubt that Dana’s blog will have any impact other than giving inhabitants of the Guardian blogosphere a warm glow as they nod agreement. Seeking to influence Government policy in the UK by blogging is a waste of time, and I suspect that this is the case everywhere.
The only chance of having any influence through Newspapers is to get an article or a letter published. The Guardian will not publish anything that challenges their Green/LibDem agenda, and people such as the Campaign Manager for Friends of the Earth and their ilk have free range of the ‘letters’ page.
The Times, however, will publish letters representing a range of opinions. They have for example published a number of my letters in the last year that criticise our current, ‘green’, energy policy (search ‘James Snook’ on the internet edition). I can only hope that these have had a small, but cumulative, effect on our policy makers, because we despartely need to change direction if we are to keep our lights on and our energy costs sensible.
@Barry Woods – thanks for the link. I found the discussion at the Guardian to be very lively, and unusually polite. I gather that is due, to what you pointed out, about their moderation policy.
Bob, the Guardian lets comments appear first and later the moderators play catch up and remove all of the undesired opinions.
As a regular commenter at the Guardian I can assure you that comments can be quite heavily “censored”. However, partly this is because a certain amount of the ability to have posts deleted is delegated to the other commenters. If there is a comment you dislike and it in any way infringes, even if ever so slightly, the “rules”…then you can report it and it will be deleted.
I know this because I have managed (purely as an experiment) to have completely uncontroversial posts deleted because they contained some very mild “personal abuse” or are somewhat “off-topic”.
Of course, as the majority of commenters on any weather/climate/global warming thread at the Grun are unremitting alarmists and militant with it….this very much makes the matter of keeping a post up if you differ pretty darned difficult.
A Climate scare Bob exposed by Climate scientist Bob. Well done Dr. Tisdale!
@Luca – “I used to read the Guardian, I used to think it was an excellent newspaper. I wrong was I?”
It was a good paper in the last century, although even then it was holier than thou. And the scriptwriters of “Yes, Prime Minister” caught that very well in the episode entitled “A Conflict of Interest”:
Hacker: Don’t tell me about the press, I know exactly who reads the papers: the Daily Mirror is read by people who think they run the country; the Guardian is read by people who think they ought to run the country; the Times is read by people who actually do run the country; the Daily Mail is read by the wives of the people who run the country; the Financial Times is read by people who own the country; the Morning Star is read by people who think the country ought to be run by another country; and the The Daily Telegraph is read by people who think it is.
Sir Humphrey: Prime Minister, what about the people who read The Sun?
Bernard: Sun readers don’t care who runs the country, as long as she’s got big tits.
First of all I think it is great that these two chaps are publishing in the Guardian. The Guardian is an insane asylum for the ultra left and ultra green ( which is pretty much the same ). Just reading the articles and comments is an education as to how irrational people can be. Imagine a bunch of hipsters that actually have political opinions based on their own concept of how society should be and that’s it.
Secondly Bob Tisdale has totally deconstructed the nonsense these two are trying to peddle. The air was warming because of CO2 , now the sea is warming and the air isn’t! I mean c’mon guys what happened, did somebody tell the ocean it was missing out and so it woke up and stole the heat from the air? What comes next, a retaliatory strike by the newly peeved air?
The only space where this kind of mendacious bullshit could get airtime is the Guardian. 25000 copies get sold each day and the losses are in the $millions every month. The only thing keeping them alive is the BBC feeding them ad revenue and a couple of deep pocketed philanthropists who seem to think the world needs a lefty newspaper that hates America and Britain for some obscure reasons.
Bob, one day we will build a statue of you holding back the tide of oceanic stupidity. Well done.
Olaus Petri says: “Well done Dr. Tisdale!”
Thanks for the kind words and the degree…but I do not have a doctorate.
Thanks, Bob. I always enjoy your observations.
Truth is the only answer to misinformation. Over and over and over, speak the truth.
Cost of PC: USD 500
Cost of being a guest author at Grauniad: strong stomach
Making a fool of itself in the first claim: priceless.
I can’t figure out how the starting point of the red line of the “escalator” was chosen.
The end point seems to be the latest possible data point, but the starting point is not the first data point, January 1970. Neither is it zero.
Anyone?
The ridiculous alarmist meme that the missing heat is in the seas was resurrected a couple months ago. No new data was presented. It is beyond me that The Climateers wish to play that card again.
I once ask an alarmist how the heat managed to make it to the oceans. His answer was thermodynamics. So, I then asked how the heat would get back out of the oceans. He had no response.
That is the problem with those who claim the heat is going into the oceans. If that were really the case then that is where it would stay. Burning every last bit of fossil fuels would only warm the oceans a couple of tenths of a degree. There can be no dangerous warming if the oceans absorb all the excess heat.
I fiddled around to put those 4 Hiroshima bombs into some kind of perspective. Based on the final figures I seem to have done it right.
A Hiroshima bomb (16KT) is 7.8E+13 joules.
10 years worth of Dana’s 4 Hiroshima bombs per second is
10 x 365.25 x 24 x 3600 x 4 = 125,280,000 Hiroshima bombs.
Surface area of ocean is 3.6×10^8km2 which gives us,
1 Hiroshima bomb for each 2.9km2 of ocean surface.
If each Hiroshima bomb (energy contained within) warmed up only the top 10 metres of water…
volume of water = 84,100,000 m3
mass of water = 84,100,000,000,000 grams
1 joule warms up 1g of water by 0.24 C.
We have 0.927 joules per gram (7.8E+13 joules in the Hiroshima Bomb)
= 0.22 C
What about average depth? (if the Hiroshima bomb heated up all the water under it with depth as average for ocean)
Average depth is 3,682 metres (wikipedia).
Repeating calculation above with 3,682m instead of 10m
30,965,620,000,000,000 grams of water
0.0025 joules for each gram
= 0.0006 C warmer
Love to see those error bars Dana!
Did this too…
Wikipedia:
“total solar irradiance of 1.366 kW/m2, the total power of sunlight striking Earth’s atmosphere is estimated at 174 PW”.
TSI is hitting us with 2231 Hiroshima bombs every second. So by Dana’s reckoning 0.18 percent (4/2231) of the TSI has been absorbed into the oceans over the past 10-15 years. As seen above that actually isn’t so much.
I was doing okay commenting for a while but now they’re busy deleting my comments saying I violated their ‘community standards’ or something. I looked up “SkS” in the dictionary and there was a picture of one sided debate!
I don’t see how this post disproves Dana’s point. You are explaining the steps up in temperature as regime shifts, but where is the explanation for the lack of cooling shifts in recent decades? I don’t necessarily think Dana is correct either, but I think this post simply redefines fluctuations, instead of proving why they are purely natural with little or no manmade component.
I agree that the “escalator” is misleading, but showing temperatures with El Ninos or La Ninas removed is just as bad. You’re really just describing what the steps are, without saying much at all about any long-term trend.
Hi
New here so I thought I would repeat what I wrote at Cif on the Graun in response to Nuccitelli’s so called science. Not trying to be a smarty pants but in my view it all boils down to simple science/thermodynamics. If Nuccitelli’s argument cannot be explained in these terms it is just nonsense. Someone tell me if what I have posted on Cif is wide of the mark. I would be grateful for comments. See below:
—————————————————
Pete_L
25 April 2013 5:32pm
This whole argument about the lost heat being found in the ocean depths is pure nonsense to anyone with any grounding in fluids, thermodynamics or especially heat transfer. Co2 causing the atmosphere to warm, fine, but no the real life measurements show otherwise and the excuse is that the heat is to be found in the ocean. A bit like holding a blow torch or a heater in the middle of the room and arguing that the air temp will not increase. Instead the bath tub of water in the corner will show a temperature increase at depth instead. So in essence Nuccitelli is saying that CO2 heats the atmosphere but as no one has measured the expected temperature increase due to this CO2 then the missing heat has magically been transferred to the deep oceans.
Wow just wow. Nuccitelli has discovered a fourth magical means of heat transfer. Up to now we have had
Convection
Conduction
Radiation
What shall we call Nuccitelli’s new magical means? Can someone please enlighten me as to the thermodynamics or applied physics of this new process?
Love
PL
—————————————————
Regards
Pete L.
Well Mr. Tisdale, maybe that explains the clarity. 🙂 The Bagdad Bobs of Climate portentology sure have a special degree of understanding.
The title is a big give away of what it is about. Consensus is always the worst pace to start and the starting paragraph was just nonsense, using what happened in Hiroshima, that is just so wrong. So we are destroying a small city every 4 seconds?
To counter the deceptive SkS ‘escalator’ chart, here is a WFT chart showing global temperatures going over a hump.
Who knows what will happen in future? But one thing is certain: looking at the past 150 years, there isn’t much to worry about.
The global warming scare is over tiny natural fluctuations, which are completely normal, and always present. There is still no testable scientific evidence showing that human activity has any effect outside of specific, concentrated urban locations. No ‘fingerprint’ of AGW exists.
Bob,
I am afraid it is you who misleads and misinforms here by quoting very selectively from Dana’s blog. Why O Why do you use a few select quotes and then try to make your point, but do not -by ignoring many relevant paragraphs- give a fair description of the blog piece that includes references to published research (Nuccitelli et al 2012; Balmaseda et al 2013; Guemas et al 2013). Show us what is wrong with those publications instead and why Dana is wrong that El Nino / La Nina influence relative energy uptake by the oceans and the atmosphere? From your piece it actually appears you agree???
If I understand your theory correctly, it gets warmer after each El Nino. Why is the extra heat not discarded? How many El Ninos does it take to get unbearable warming? Will the polar bears then die? Is global action required to prevent the occurrence of more El Ninos?
Oh wait! The extra energy for the El Ninos is acquired during La Nina phases according to you. Maybe we should outlaw those La Ninas! How is the extra energy accumulated during the La Ninas? I see you mention less clouds. Do you have a reference that explains to me the mechanism for less clouds during La Ninas and the amount of extra energy put into the earth system as a result?