Over at The Conversation Andrew Glikson asks Fact check: has global warming paused? citing an old Skeptical Science favorite graph, and that’s the problem; it’s old data. He writes:
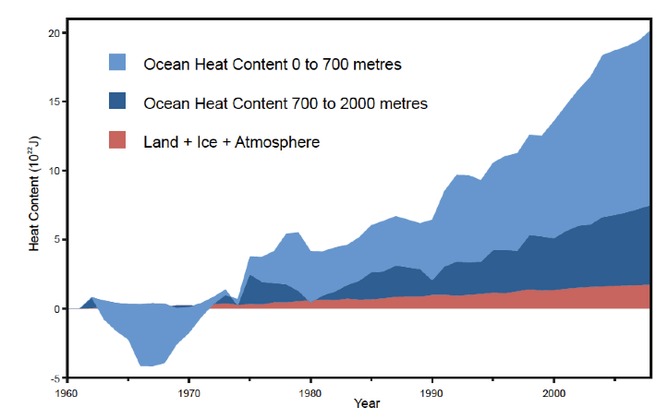
As some 90% of the global heat rise is trapped in the oceans (since 1950, more than 20×1022 joules), the ocean heat level reflects global warming more accurately than land and atmosphere warming. The heat content of the ocean has risen since about 2000 by about 4×10²² joules.
…
To summarise, claims that warming has paused over the last 16 years (1997-2012) take no account of ocean heating.
Hmmm, if “…ocean heat level reflects global warming more accurately than land and atmosphere warming…” I wonder what he and the SkS team will have to say about this graph from NOAA Pacific Marine Environment Laboratory (PMEL) using more up to date data from the ARGO buoy system?
Sure looks like a pause to me, especially after steep rises in OHC from 1997-2003. Note the highlighted period in yellow:

From PMEL at http://oceans.pmel.noaa.gov/
The plot shows the 18-year trend in 0-700 m Ocean Heat Content Anomaly (OHCA) estimated from in situ data according to Lyman et al. 2010. The error bars include uncertainties from baseline climatology, mapping method, sampling, and XBT bias correction.
Historical data are from XBTs, CTDs, moorings, and other sources. Additional displays of the upper OHCA are available in the Plots section.
As Dr. Sheldon Cooper would say: “Bazinga!“
h/t to Dr. Roger Pielke Sr. for the PMEL graph.
UPDATE: See the above graph converted to temperature anomaly in this post.
“XBT bias correction” means they assume a “random + constant offset” measurement error model. This model ignores systematic measurement error and is certainly incomplete. Floating buoys have never been field-calibrated. No one knows the magnitude or distribution of the actual errors or the size of the accuracy confidence intervals.
Apart from all that, Graeme Stephens, et al.’s recent paper on the global energy balance puts the net surface budget to be 0.6(+/-)17 W/m^2. Given that uncertainty, how can anyone say that ocean heat content has increased?
Stephens, et al., wrote, “This [17 W/m^2] uncertainty is an order of magnitude larger than the changes to the net surface fluxes associated with increasing greenhouse gases in the atmosphere (Fig. 2b). The uncertainty is also approximately an order of magnitude larger than the current estimates of the net surface energy imbalance of 0.6 ±0.4 Wm^−2 inferred from the rise in OHC [ocean heat content].”
As usual, climate stories depend on neglected error for their impact.
Phobos,
as Bere’nyi Pe’ter (Sorry about the apostrophes, not able to copy paste).
0.075K in half a century, is quite remarkably small amount. That looks like a number that could be due to a lot of sources. Maybe we need to measure another 50 years, before even bothering with making a comment about it.
After all, most solution proposed regarding global warming (Yup, stick with the original!) are all draconian government measures, that only a self serving totalitarian could like.
Most interesting. So, while atmospheric CO2 has been steadily increasing by 2ppm/Yr, not only have lower tropospheric temperatures been flat for 17 years, but upper ocean temps have also been relatively flat for 9 or 10 years.
So where’s the heat hiding this time?
Less energy entering the oceans whilst the jets remain more meridional with more global clouds.
Berényi Péter so how much extra energy would 0.075 K put into the atmosphere? Or how would this amount of energy contribute to global warming?
Anthony wrote: “REPLY: and again, it isn’t statistically significant in the scheme of things, much like that 0.7C in the atmosphere isn’t statistically significant against daily diurnal variation or seasons.”
So you think the daily temperature change in your backyard is more significant than the change of an ice age (~7 C)?
REPLY: Every time I read a sentence that starts with So…. I know its going to be a personal slam. Don’t put words in my mouth, Mr. Anonymous Coward. Your claim simply isn’t statistically significant, as other commenters also point out. – Anthony
Frank K. says: “Hi Phobos – Are the computer codes that perform the data processing summarized in the graphs available? I’d like to have a look at them. Thanks in advance.”
The NOAA OHC site gives the source for its graphs. Have you written those authors to ask them?
Once again Bill Illis hits the nail on the head, this time with the first graph that starts at zero (apologies if I missed an earlier one). If you really believe you have found a trend, go ahead and show a truncated graph that best makes your point, but if you want me to believe you, show me the same data nearby with the axis starting at zero.
Minor nit, the name is Glikson, not Glickson.
REPLY: Fixed, thanks. -A
Phobos says about heat accumulation . . .
OK, doing some quick math, perhaps others would like to check:
The top 700 meters of oceans is (rounded off) 2300 feet. At 70% of the earth’s surface, the volume is 1.263 E19 cubic feet (the ‘E’ is exponent – 1.263 x 10 to the 19th . .).
Sea water is about 29 kilograms per cubic foot – so the top 700m of ocean is about
3.6627 E20 kilograms.
It takes 4186 joules to heat 1Kg of water 1 degree C. Therefore the energy needed to warm the top 700 m of ocean 1 degree C is 1.533 E24 Joules.
Since a Watt is a joule/sec, and over 10 years (86400 seconds per day, x 365 days per year, x 10 years) 45 terawatts is 1.419 E22 Joules.
Dividing number of joules added to the ocean over 1o years (1.419E22) by the number of joules required to raise the ocean 1 degree C (1.533 E24) give a whopping 0.01 degrees C that the oceans have warmed.
Wow, that seems too low. Maybe I’m off by a factor of 10 ( . or not . .?) I don’t have time to check now. BUT 0.01 or even 0.1 degree C of temperature increase of JUST THE TOP 700 meters of ocean is awfully small . . .
. . seems to me like Phobos is trying give a false impression by noting how many terawatts the ocean was absorbing over 10 years. . . .
. .oops, didn’t finish the last sentence:
. . seems to me like Phobos is trying give a false impression by noting how many terawatts the ocean was absorbing over 10 years as IF IT WERE REALLY HEATING UP THE OCEAN. . .
I don’t understand. How does the ocean gain 10x the heat conternt accumulated in the air from the greenhouse effect? Especially when between 1960 and 1970 the ocean lost heat that didn’t appear in the atmosphere.
From ’97 to 2003: by warmist models, is this the “correct”, CO2 rate? Or is it a correct+natural rate, so the “actual” trend from ’97 is a split between 2003 and 2013?
A range of Scenarios leads you to the ballpark; observations tell you where the ball is heading. By now we should have at least one of the Scenarios deleted, wouldn’t you think? Unless you admit that the science is not settled, and the outcome, not certain.
It is weird how the warmist can be both definite and vague at the same time. Perhaps like the murder suspect who says he is definite he didn’t do the crime, but is vague about what he was doing during the time.
Anthony wrote: “REPLY: Your claim simply isn’t statistically significant.”
The math is actually pretty simple; the OLS linear trend is positive and statistically different from zero. That’s what a warming trend is.
REPLY: But in the larger scheme of things, still it is statistically insignificant, though I’m sure you’ll find it impossible to let go of that fact. For example total energy flux received by Earth by solar is 1730 petawatts, of which 30% is reflected by Earth’s Albedo, so figure 1038 petawatts of flux incident on Earth’s surface or 1,038,000 terawatts
Compare your retained 240 terawatts to that and you get a value that while it “is” technically greater than zero at 0.00023, it isn’t distinguishable from zero in the larger scheme of things. I’m sorry, your argument just isn’t something to get all that concerned about, unless of course you are a religious zealot where “any” change is not good and “must” be our fault.
See the new post by Willis where he converts to temperature anomaly, it is below the measurement precision (noise level) of the instrumentation. But, you can be afraid of it it you want. We are here for comfort and support of your fears. – Anthony
Martin C,
Thanks for that. You’re right, Phobos is trying mighty hard to give a false impression. I suspect he’s a regular at SkS, and he’s been running back and forth, collecting talking points.
His problem is people like you. Good job.
The more data that becomes available, the more obvious it is that CO2 is a completely insignificant player. There is absolutely no difference between global warming a century ago, when CO2 was much lower, and global warming from 1980 – 1997. Ockham’s Razor says that the simplest explanation is probably the best explanation: global warming is a natural recovery from the Little Ice Age.
Martin C said: “…give a whopping 0.01 degrees C that the oceans have warmed.”
Your number is basically correct for the top 0-700 m (I get 0.014 C in 10 years). The volume is huge, as you note, so the added heat is huge. If all that heat were added to the atmosphere instead, the warming would be roughly 1000 times larger, or 14 C.
We are dealing with large systems here; the ocean is a *huge* heat reservoir. That heat has consequences.
D.B. Stealey says: “Ockham’s Razor says that the simplest explanation is probably the best explanation: global warming is a natural recovery from the Little Ice Age.”
That’s a misunderstanding of basic thermodynamics. Thermodynamic systems don’t “recover” — they aren’t like a spring with a restoring force — temperature changes only if heat is added or subtracted from the system. Given the observed temperature changes, the question is, what is the source of that heat? Changes in solar irradiance don’t seem nearly enough to do so.
REPLY: Gosh, static state thinking. The Earth is a dynamic system, it changes its heat budget over time in response to a multitude of things (which is why we have cold years and warm years globally). It is not a static state system. Change clouds for example, just 2% and you have your answer…and that is just one variable. But please go ahead and try to argue that that Earth’s albedo or any other of its myriad of climatic variables have remained constant since the little ice age, and that couldn’t possibly affect solar insolation at the surface, TOA emission, etc. No for phantom folks like yourself, there’s no other answer but the mighty CO2 control knob, which is a factor, but just one knob in a whole dashboard full. – Anthony
Phobos says:
“That heat has consequences.”
Apparently not.
Phobos says: “Thermodynamic systems don’t “recover” — they aren’t like a spring with a restoring force — temperature changes only if heat is added or subtracted from the system.”
Phobos doesn’t understand. Prof Richard Lindzen explaina:
By the way, the ten-year trend for 0-700 m OHC is still a statistically significant 45 terawatts.
That is about 1/10 the internal heat flow from the Earth. Sure that this is not indicative of increased volcanic activity?
Phobos says:
February 25, 2013 at 3:31 pm
“The NOAA OHC site gives the source for its graphs. Have you written those authors to ask them?”
No I haven’t. But I figured the source code(s) for processing the data should be available via links at the page. Do you work for NOAA? Could you ask them on our behalf? I think it would be very instructive to see the data processing codes. Thanks.
Floating buoys have never been field-calibrated. No one knows the magnitude or distribution of the actual errors or the size of the accuracy confidence intervals.
Nor do we know what biases free floating buoys introduce. Although IMO they introduce a warming bias, because drift will be from cold upwelling areas to warm downwelling areas, which explains the measured warming down to 2000 meters. All Argo has shown is ocean downwelling areas are warmer at depth than other areas of the ocean. Hardly a surprise.
We can say for certain is that the Argo buoys are not measuring the same ocean locations.
Werner Brozec 1.47pm says:
“So heat presumably got lower down without affecting the surface. Is that correct? And am I to be worried if the deeper ocean went up from 3.0 C to 3.2 C?”
Yes you should be worried. 90% or so of the ocean volume is below 3C. Water is at its densest at 4C. So if the ocean warms even by 1C there should be a corresponding drop in Sea Level.
I might be wrong as this flies in the face of what I have read elsewhere but it seems logical to me.
Phobos says: “Given the observed temperature changes, the question is, what is the source of that heat? Changes in solar irradiance don’t seem nearly enough to do so.”
Start here, Phobos: http://science.nasa.gov/science-news/science-at-nasa/2013/08jan_sunclimate/
The old “TSI does not vary much” meme will get you laughed out of here.
denniswingo says: “That is about 1/10 the internal heat flow from the Earth.”
No – heat flow from the Earth’s interior is about 47 terawatts
http://www.solid-earth.net/1/5/2010/se-1-5-2010.pdf
and constant over these time scales.
@frank K: NOAA’s OHC site says the results come from Levitus et al. They would be your contact for questions, code, etc.