
Image Credit: Jo Nova – David Lappi – GISP2
Your help is needed in building the new WUWT Paleoclimate Reference Page. Below I’ve posted all of the credible 3rd party paleoclimate graphs I’ve compiled thus far, but I am sure there are lots more. As such, please post links to any credible paleoclimate data sources below or in comments of the WUWT Paleoclimate Reference Page and we will review them for inclusion. Also, your thoughts on the provenance of the graphs included thus far, links to the papers they are based upon, and appropriate titles for each graph would be most appreciated.
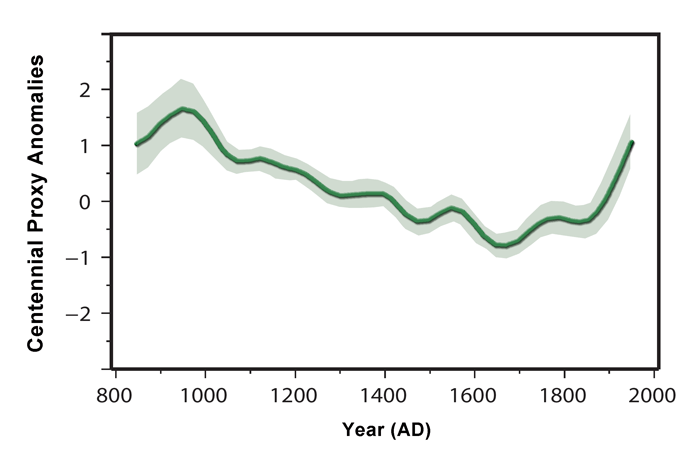
In terms of additional graphs for potential inclusion, I struggled with shorter term reconstructions, as many of them are still a matter of controversy. As such, please post any pertinent information, including any credible graphs illustrating the last few millennia and the Medieval Warming Period. For reference, there are an array of less than ideal options available on the bottom of this NOAA NCDC page. From a cursory review, I found the summary for Overpeck et. al 1997 to be enlightening, e.g.;
“Together, they indicate that the Arctic has warmed up to 1.5°C since 1850 – the coolest interval of the Arctic “Little Ice Age.” Much of the recent Arctic warming took place between 1850 and 1920, most likely due to natural processes”
However, after Overpeck the “Team” went to work, i.e. Briffa et al., 1998, Jones et al., 1998, Mann et al., 1998, Pollack et al., 1998, Jones et al., 1998, Mann et al., 1999, Mann et al., 2000, Briffa et al., 2001, Esper et al., 2002 and Jones and Mann 2004, and paleoclimatology became a quite a sordid science. The IPCC’s 2007 contribution in AR4 section 6.6.1.1, brought things to a new low when they appear to have pasted a thick black HadCRUT2 line onto some kindergartner’s art project…:

Anyway, it is also interesting to note that the NOAA NCDC site doesn’t seem to include any reconstructions after 2006, while there has been much valuable paleoclimate research conducted since then, e.g.:
Ljungqvist, F. C., Krusic, P. J., Brattström, G., and Sundqvist, H. S (2012).: Northern Hemisphere temperature patterns in the last 12 centuries, Clim. Past, 8, 227-249, doi:10.5194/cp-8-227-2012, 2012. See JoNova, CO2Science and Abstract at Clim-Past.
Christiansen, B. and Ljungqvist F. C. (2012). The extra-tropical Northern Hemisphere temperature in the last two millennia: reconstructions of low-frequency variability. Climate of the Past JoNova 1, JoNova 2, Abstract at Clim-Past
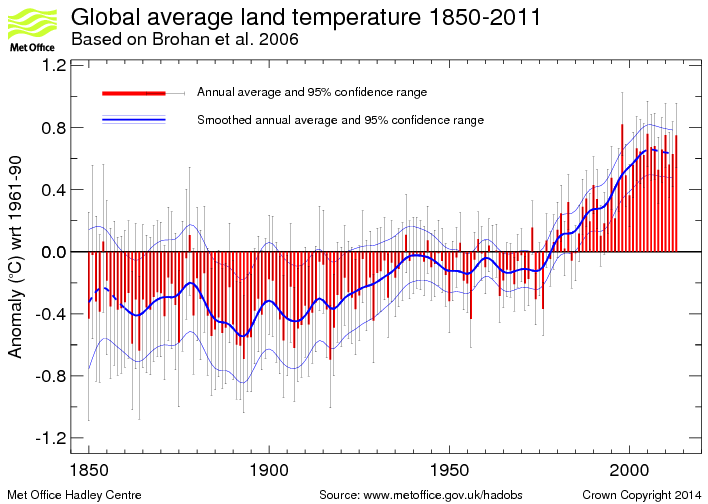
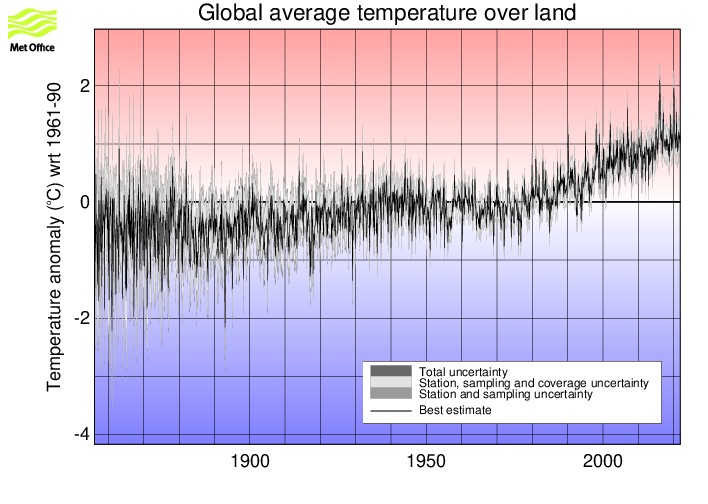
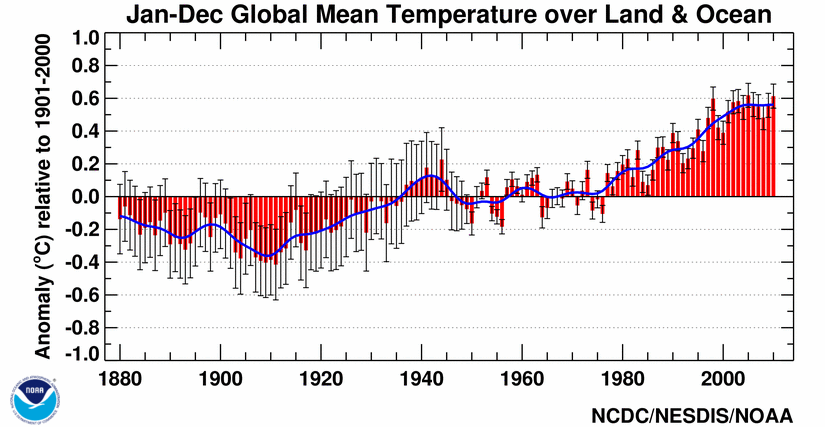
JoNova has a good article on some of these more recent reconstructions. Also, in addition to reconstructions, we have temperature records from the Met Office 1 and 2, as well as NOAA, but these surface temperature records are burdened with issues of questionable siting, changes in siting, changes in equipment, changes in the number of measurement locations, modeling to fill in gaps in measurement locations, corrections to account for missing, erroneous or biased measurements, and the urban heat island effect.
With that for background, the following are the graphs currently included in the WUWT Paleoclimate Reference Page:
600 Years Arctic Temperature

1,100 Years Ljungqvist et al

1,100 Years Ljungqvist et al

1,100 Years Kirkby 2007

2,000 Years – J. Esper et al.

2,000 Years Christiansen

2,000 Years Christiansen

10,000 Years GISP2 Ice Core
11,000 years GISP2 Temperature Since 10700 BP with CO2 from EPICA DomeC

120,000 Years

140,000 Years Antarctic/Vostok

150,000 years Taylor Dome -Ross, Antarctica E. J. Steig, et al 1999:

400,000 Years Antarctica/Vostok

450,000 Years Temperature Anomaly

750,000 Years Rate of Change of Ice Volume and June 65N Insolation

800,000 Years Orbital and Millennial Antarctic Climate Variability

800,000 Years Orbital and Millennial Antarctic Climate Variability

1,000,000 Years

5,500,000 Years Antarctica/Vostok Temperature

5,500,000 Years Antarctica/Vostok Temperature – Reversed

[Which version of the above two graphs do you prefer?}
65,000,000 Years

540,000,000 Years

543,000,000 Years Area of Continents Flooded, Concentration of CO2 and Temperature Fluctuations

600,000,000 Years – C. R. Scotese and R. A. Berner

(Please note that WUWT cannot vouch for the accuracy of the data/graphics within this article, nor influence the format or form of any of the graphics, as they are all linked from third party sources and WUWT is simply an aggregator. You can view each graphic at its source by simply clicking on it.)
Please post your thoughts, recommendations, graphs, links, research, suggested graph titles, etc., for the WUWT Paleoclimate Reference Page in comments. Thanks JTF
Discover more from Watts Up With That?
Subscribe to get the latest posts sent to your email.
Great Page says:
February 23, 2013 at 3:37 pm
Agree both points.
General knowledge is that we have been on top of warm trend for a long time, when drop towards glacial period is question. Does look like sooner rather than later by trend of trends.
Graph: from past on left to present on right. Standard in business and anything that you wish to use graph for projections into future (the principal use of any analysis is to help prepare for what is to come).
The first two commenters –
Great Page says:
February 23, 2013 at 3:37 pm
On the charts out to 400,000 years and beyond, it looks like we have overstayed our welcome at the present warm period. Personally prefer present date to right on x-axis and all of the temp versus C deg charts in sequence.
GreatAnarch says:
February 23, 2013 at 3:40 pm
Absolutely invaluable. I have been looking for something like this. Just a pity there is no consistency in time direction. Time advancing to the left seems the majority choice so that is my answer to the Antarctica/Vostok Temperature question.
– raisee a presentaitonal query.
Now – Left – or Right.
I have no prfernce, but would like it to be consistent.
Please.
Thanks a shed-load!
Auto
Dear folks:
I hope that the O16/18 ratios and borehole temps reconstructions are NOT being confused with the VERY STRAIGHT FORWARD ice temperature measurements made by the Norwiegien group (can never spell that right and my checker isn’t working…sorry..ok, the guys that eat Lutfisk and chew snoose..) which work on the principle that given a semi-infinite flat sheet, with two boundary conditions, i.e., bottom (ROCK), presumed rather FIXED thermally and the TOP, presumed varying…the record of the varience is “stored” by the ice temperature at various levels. Obviously some smearing and averaging, but all in all a very good record. I believe I saw them clearly illustrating the “medievil warm period” in this work.
@ur momisugly polistra February 23, 2013 at 5:00 pm
From your link:
http://www.polistrasmill.blogspot.com/2013/02/missed-best-name.html
It states that the calamity mongers missed the name “Qailertetang” for their blessed winter storm “Q”.
What? That’s like getting them to try and pronounce “Eyjafjallajökull.” I imagine that their eyes just glossed over when they saw it… though the sounds are easier to cope with. (that umlaut is scary looking ya know.)
I see two points of interest in the first plot above:
1. The amount of “noise” on the basic intergalacial signal – the Minoan Warm has effectively provided a “double top”. How does this compare with previous intergalacials plotted to the same scale for time?
2. The CO2 plot isn’t superimposed. On small (time) scale plots of previous intergalacials, the CO2 appears to have followed temperature down with a lag of 70-100 years or so. This doesn’t seem to have happened after the most recent intergalacial peak. Comparison with the CO2 behaviour at previous intergalacials at the same scale might confirm or otherwise that the behaviour really is different. If it is, then it might be an indication of a step change (such as has ocurred before – e.g. the step change in intergalacial peak, temperature 6 peaks back as compared with last five peaks) with the intriguing possibility that recent CO2 growth is natural, rather than man-made (a change of behaviour say 7,000 years ago seems unlikely to be anthropogenic, since the humanoid population was so low).
Summary and responses to questions on what to do with disputed, questionable and falsified graphs:
davidmhoffer says:February 23, 2013 at 9:10 pm
If you put it at the bottom, you’ll just get accused of trying to hide it. I suggest putting it at the top with a big bold “what they tell you” title (or similar) followed by “what they don’t tell you” (or similar) section.
That would allow you to go so far as to put a few words about where to look to raise questions about entries in the first one. For example, put the graph from Briffa’s hockey stick paper in the top section, and the graph from his most recent paper in the bottom section.
But there are some graphs, e.g. Mann’s hockey stick which have been falsified, thus it is unacceptable to give it the same prominence as graphs that have no been falsified. We will just have to come up with an evaluation process and classification system such that it is transparent, fair and factual.
A. Crowe says: February 23, 2013 at 9:40 pm
If you put a separate section you’d have to say who disputes them and on what grounds.
Agree, any disputes and associated classifications will need to be well documented in a link log to who disputes the data/graph, on what grounds, any supporting evidence/papers and our comments assessing the credibility of the dispute and graph.
It would leave you wide open to criticism if, for example, you said a graph constructed by X using Y’s data was good, but Y’s own construction/interpretation was ‘suspect’ unless you gave a very good reason.
This is especially the case given that virtually all the base data is from climate scientists, even though a number of the charts above look to have been re-interpreted by different skeptics. For example, older data being up-dated/replaced after new findings would be a valid reason; or refutations/rebuttals that have been shown to stand up in the literature (with no counter-rebuttals).
I am wide open to criticism, it is core to maintaining good science. If people disagree with the disputes and classifications they can do so in comments. We can evaluate their arguments and if they have merit, add them to the graphs or change the classifications.
Just saying it was disputed on a skeptic blog somewhere would have less validity in the eyes of the general public. (Though you might get away with it here I suppose.)
I am not sure what that means. If I post something erroneous on these pages a line of both warmist and skeptic scientists, bloggers and trolls will post comments and articles pointing out the error. That’s the beauty of the internet, blogging and crowdsourcing.
I guess it depends on why you are collecting the material in the first place.
I have been working for a few years to help build WUWT’s Reference Pages, it is my effort to keep the Global Warming debate centered around the facts. As such, I am collecting this material so that people can see the facts and make up their own minds.
Mike Jonas says: February 24, 2013 at 1:22 am
JTF – re your two questions. The first one is difficult. No matter what you do (leave them out, stick them at the bottom, put the criticism next to them, post them without comment, etc, etc), you can be criticised. I would certainly try to be unbiased so that graphs are judged only on quality, not on whether the story they tell tallies with “sceptic” thinking. Perhaps I would deal with them in three ways:
1. If it seems to be genuine, post it, even if it conflicts with other graphs. Let’s face it, most of the paleo graphs are from a single location so of course there will be discrepancies between the graphs. Perhaps an explanatory note to that effect at the start of the page would help.
2. If you feel it is really low quality or has been manipulated, leave it out. But unlike those who adjust temperature records in secret, document it. eg, provide a separate (linked) page with links to rejected graphs plus reasons.
3. If you just can’t decide between 1 and 2, put it in with a comment and/or a link to criticism
My suspicion is that as you get into the swing of it, there won’t be much in category 3.
I think this is a reasonable classification system, i.e.:
“Disputed” there’s some question about it, but nothing substantive enough to exclude it from the rest of the data. We add links and possibly a brief explanation to the graph.
“Questionable/Falsified” there’s enough valid criticism to exclude it from the rest of the data. I think I will create a “Questionable/Falsified” graphs section at the bottom of the page, similar to what we do when sea ice graphs are temporary broken due to satellite issues or otherwise. For these graphs we would add links, a more involved explanation to the graph and the reason that it was excluded from the rest of the credible graphs.
“Indeterminate” we don’t yet know enough about a graph to give it a classification. This is where most of the Team’s graphs stand for me at present, because, aside from Mann’s graph, I have not read much on the data and methods utilized by the others and any associated disputes. As such, in order to accurately classify these graphs, I am planning to post a second crowdsourcing thread in the coming weeks that will show all of the Disputed and Indeterminate graphs and we can see how many of them end up getting classified as “Questionable/Falsified”.
John Whitman says: February 24, 2013 at 8:28 am
I would suggest to include all graphs including ones created and/or endorsed by proponents of the IPCC’s assessment of alarming / dangerous AGW.
Show no favor as to inclusion of formally published graphs.
If you do that then i think it would be necessary to indicate which of the WUWT reference page graphs the IPCC used to support their alarming / dangerous assessments.
If the above approach is taken then there could be no case made that you/WUWT aren’t being balanced in an open objective way.
Do you think what I’ve outlined above is a reasonably balanced, open and objective way of addressing disputed graphs?
Hate to be so picky when you do such great work, but noted the use of plural verb with singular noun in second paragraph: “For reference, there are an array of less than ideal options…”
Correct should be: …there is an array of…
George
ustthefactswuwt says: February 24, 2013 at 11:10 am
“the Alley chart here;
http://www.ncdc.noaa.gov/paleo/pubs/alley2000/alley2000.html
also seems to infer that present is 2000.”
How?
The only reference to 2000 that I can see is in the title, which seems to simply refer to the date of the paper (R.B.Alley 2000). In fact, it’s even used in the link alley2000 – I doubt if that’s a reference to the “present” datum.
JTF – I like your suggested classification system.
polistra says:
February 23, 2013 at 5:00 pm
“In the archeology department: While playing around with the Weather Channel’s dumb storm names, I bumped into evidence that the Eskimos remember one of those MUCH warmer times…. which means, of course, that the Eskimos and their food sources SURVIVED those much warmer times.”
Seems to me they were describing a larger vessel breaking ice.
justthefactswuwt says:
February 24, 2013 at 10:32 am
Werner, do you think you can create a graph similar to the two below
It would not be a problem to create such things, but you no doubt have heard of “down the up escalator” or something like that. In that case, they use many short periods where it goes down, but none of the periods is over 15 years. With your two graphs, the final line is only 10 years so you are inviting criticism of cherry picking short periods. For these people, even 15 years is too short, but at least we can argue that NOAA considers 15 years as nothing to sneeze at. GISS still goes up for the last 15 years, but Hadcrut3 goes flat for almost 16 years so I would rather just work with Hadcrut3.
Is this what you wanted? Or do you want the breaks from one line to the next removed?
http://www.woodfortrees.org/plot/hadcrut3gl/from:1957/scale:0.5/offset:-0.2/plot/esrl-co2/from:1957/normalise/scale:0.5/offset:0.2/plot/hadcrut3gl/from:1958/to:1976/trend/scale:0.5/offset:-0.2/plot/hadcrut3gl/from:1976/to:1997.25/trend/scale:0.5/offset:-0.2/plot/hadcrut3gl/from:1997.25/trend/scale:0.5/offset:-0.2
If with so many graphs there’d be a risk of losing overview, I’d suggest sub-sections on (1) solar-climatic coupling and (2) records suggesting the related ocean lag times (sun -> atmosphere).
Nick Stokes
In your linked article that goes to Science Direct it actually says 1950 in the abstract.
tonyb
Nick, dont expect any correction. It’s clear from the text and the data and the standards of the science that it is 1950. Its clear the chart maker made a mistake. Correcting it should be easy. But.. go figure.
Phil. says: February 24, 2013 at 8:48 am
Alley used 1950 as ‘present’ in his 2000 paper, you are confusing the date of the paper with the date of the data! As I said before the Lappi graph is mislabeled. The data is freely available so why not plot it yourself with the correct axis label?
Nick Stokes says: February 24, 2013 at 2:29 pm
The only reference to 2000 that I can see is in the title, which seems to simply refer to the date of the paper (R.B.Alley 2000). In fact, it’s even used in the link alley2000 – I doubt if that’s a reference to the “present” datum.
climatereason says: February 24, 2013 at 4:04 pm
In your linked article that goes to Science Direct it actually says 1950 in the abstract.
Based upon Alley’s own Figure 1;
http://ars.els-cdn.com/content/image/1-s2.0-S0277379199000621-gr1.gif
from his 2000 paper;
http://www.sciencedirect.com/science/article/pii/S0277379199000621
the “Age (thousand years before 1950)”, thus Lappi’s x axis label “Years Before Present (2000 AD)”;
http://jonova.s3.amazonaws.com/graphs/lappi/gisp-last-10000-new.png
appears inaccurate. I will include Lappi’s graph in the subsequent crowdsourcing thread to review and classify disputed graphs, and we should try to get Lappi to correct his graph, but in the interim, I am going to add a classification warming flag to Lappi’s graph, e.g.:
Disputed Graph Note that the x axis label, “Years Before Present (2000 AD)”, should read Years Before Present (1950 AD).
Please let me know if this is a reasonable note to address a dispute. I am also still unclear as to why the data appears to begin 0.0951409 (thousand years before present), while Alley’s Figure 1 says “Age (thousand years before 1950)”, can anyone explain?
I found this buried deep in the bowels of Wikipedia. Its not associated with any relevant pages I know of. (File:Past 740 kyrs Dome-Concordia ice core temperature reconstructions.png)
http://en.wikipedia.org/wiki/File:0Master_Past_740000yrs_temperatures_CO2_icecore_Dome_C_150dpi.png
It is not easy to see why CET should be a proxy for global temperatures. Surely, it is an artefact of the temperature of the North Atlantic (presuming that the UK receives predominantly Westerlies)
Less so than Armagh.
It would be expected that
the Arrnagh data would follow the central England
variation closely, however, there are distinct differ-
ences. From Fig. 8, we note the following: (i) The
amplitude of the variation in temperature at Armagh
is slightly greater than that of the central England
series. (ii) The general behaviour of the variation from
1860 to the present is similar, with peaks and troughs
at roughly similar times, with the exception of the last
minimum, which occurred in the late 1960s in central
England, but did not reach its minimum at Armagh
until the late 1970s.
The reason for the later minimum in the 1970s is that essentially the same clean air act was only introduced in N Ireland 8 years after the mainland.
Philip Bradley,
The value of the CET temperature record is in showing the long term warming trend since the LIA. It corresponds well with other locations, which also show the natural recovery trend since the LIA.
The long term trend is the same — about 0.35º/century — no matter whether CO2 was low or high.
Werner Brozek says: February 24, 2013 at 3:38 pm

It would not be a problem to create such things, but you no doubt have heard of “down the up escalator” or something like that. In that case, they use many short periods where it goes down, but none of the periods is over 15 years. With your two graphs, the final line is only 10 years so you are inviting criticism of cherry picking short periods. For these people, even 15 years is too short, but at least we can argue that NOAA considers 15 years as nothing to sneeze at. GISS still goes up for the last 15 years, but Hadcrut3 goes flat for almost 16 years so I would rather just work with Hadcrut3.
Is this what you wanted? Or do you want the breaks from one line to the next removed?
http://www.woodfortrees.org/plot/hadcrut3gl/from:1957/scale:0.5/offset:-0.2/plot/esrl-co2/from:1957/normalise/scale:0.5/offset:0.2/plot/hadcrut3gl/from:1958/to:1976/trend/scale:0.5/offset:-0.2/plot/hadcrut3gl/from:1976/to:1997.25/trend/scale:0.5/offset:-0.2/plot/hadcrut3gl/from:1997.25/trend/scale:0.5/offset:-0.2
That looks pretty good, i.e.:
I might remove the first two trend lines and only show the last trend line for the period to present with no warming. Also, adding in more data sets, e.g. GISS, as well as possibly some of the satellite data sets, might help to show the general agreement among them and divergence from the CO2 trend.
Mike Jonas says: February 24, 2013 at 1:22 am
re the second question: I would put a fairly prominent standard statement near each R-to-L graph, eg. “Time in this graph runs Right to Left”.
But those are just my suggestions. it’s your page.
Day Hay says: February 24, 2013 at 10:07 am
Please add big “YOU ARE HERE” arrows with the associated 100 year teeny time bar for folks on Slashdot, Reddit, and the MSM.
I will play around with this when I have time and provide a few options for the next crowdsourcing thread.
Mike Jonas says: February 24, 2013 at 1:22 am
But those are just my suggestions. it’s your page.
It’s really “our” page, as everyone who comments and contributes is a developer. Thank you for your thoughts JTF
So, what best correlates with that little red uptick in the first graph?
– – – – – – – – – –
justthefactswuwt,
I had to think more about the purpose of the WUWT Paleoclimate Reference Page to answer your question.
If one of the primary goals of the WUWT Paleoclimate Reference Page is to present the literature in a more balanced way than the IPCC’s way then merely presenting a representative literature (both endorsed by the IPC and not) of paleoclimate should be enough without going into disputed issues. I would say just indicate if a piece of literature was used in the IPCC.
If we decide that it is also a primary goal of the WUWT Paleoclimate Reference Page to catalogue the disputes surrounding each piece of literature (whether endorsed by the IPCC or not) the disputes about disputes will be prolific to say the least, : ) , but that is bread and butter at WUWT. Maybe one option for a reasonable approach for each disputed piece of literature is that you could just link to a representative blog post discussing it; the link being a relatively balanced presentation of a dispute. A disclaimer can be made that it is just a representative link to the disputed issues; then more links can be added over time.
To answer your specific question, I think that your proposed outline of addressing disputes is reasonable.
Again, cheers to you for your leadership efforts.
John
Also, adding in more data sets, e.g. GISS, as well as possibly some of the satellite data sets, might help to show the general agreement among them and divergence from the CO2 trend.
Here is the same with Hadsst2
http://www.woodfortrees.org/plot/hadsst2gl/from:1957/scale:0.5/offset:-0.2/plot/esrl-co2/from:1957/normalise/scale:0.5/offset:0.2/plot/hadsst2gl/from:1958/to:1976/trend/scale:0.5/offset:-0.2/plot/hadsst2gl/from:1976/to:1997.25/trend/scale:0.5/offset:-0.2/plot/hadsst2gl/from:1997.25/trend/scale:0.5/offset:-0.2
Here is GISS
http://www.woodfortrees.org/plot/gistemp/from:1957/scale:0.5/offset:-0.2/plot/esrl-co2/from:1957/normalise/scale:0.5/offset:0.2/plot/gistemp/from:1958/to:1976/trend/scale:0.5/offset:-0.2/plot/gistemp/from:1976/to:2001.2/trend/scale:0.5/offset:-0.2/plot/gistemp/from:2001.2/trend/scale:0.5/offset:-0.2
Here is the same with RSS, except it starts at 1979
http://www.woodfortrees.org/plot/rss/from:1979/scale:0.5/offset:-0.2/plot/esrl-co2/from:1979/normalise/scale:0.5/offset:0.2/plot/rss/from:1979/to:1997/trend/scale:0.5/offset:-0.2/plot/rss/from:1997/trend/scale:0.5/offset:-0.2
Here is Hadcrut4
http://www.woodfortrees.org/plot/hadcrut4gl/from:1957/scale:0.5/offset:-0.2/plot/esrl-co2/from:1957/normalise/scale:0.5/offset:0.2/plot/hadcrut4gl/from:1958/to:1976/trend/scale:0.5/offset:-0.2/plot/hadcrut4gl/from:1976/to:2000.8/trend/scale:0.5/offset:-0.2/plot/hadcrut4gl/from:2000.8/trend/scale:0.5/offset:-0.2
At the moment, UAH cannot be used as the flat part is only 4 years, 7 months. However all it would take is a couple of low months to push it back to 12 years.
pochas says: February 24, 2013 at 6:11 am
This has nothing to do with paleoclimate but if you have any traction with what goes into the WUWT reference pages I would like to have ready access to this Ryan Maue graphic, perhaps in the Atmosphere page, and on several different scales. It shows dynamic tropopause potential temperatures which should be related to surface temperatures, and I’d like to know more about how they are related (they seem always higher than surface temperatures). It would be great do have RM do a guest posting. Thanks for anything you can do.
http://climaterealists.com/attachments/ftp/Tweet%20Feed%20442.jpg
I certainly have a bit of “traction with what goes into the WUWT reference pages”, but I am not sure where Ryan stores that graphic these days. When he supported the Florida State University (FSU) Center for Ocean-Atmosphere Prediction Studies (COAPS) their website was great. But since he joined Weatherbell;
http://models.weatherbell.com/
COAPS weather page evaporated and only certain graphics are available on Ryan’s website Policlimate;
http://policlimate.com/tropical/
and I do not believe any of the tropopause are included. You could check with Ryan, sign up for Weatherbell or try another source, e.g.:
MIT has Tropopause Temps
http://wind.mit.edu/~reanal/pv.html
and University of Washington has Theta, Potential Vorticity and Pressure:
http://www.atmos.washington.edu/~hakim/tropo/index.psp?page=trop_theta&hem=
ColdOldMan says: February 23, 2013 at 6:11 pm
I’m not sure whether these would be usable but each image is linked to the source material (I think that applies to them all).
http://pages.science-skeptical.de/MWP/MedievalWarmPeriod1024x768.html
That is a great collection of graphs and really well laid out geographically, everyone should take a look at that. I am realizing that it will be quite a challenge to determine which graphs to include and exclude.