We’re Expecting: Will it be a Boy, a Girl, or ENSO-Neutral in 2013?
There was lots of interest in the short-lived El Niño conditions in 2012. Recently, they very quickly transformed into the present weak La Niña conditions. NINO3.4 sea surface temperature anomalies are right at NOAA’s -0.5 threshold for La Niña conditions. I’ve received some questions about them over the past few weeks, and Steven Goddard has a recent post about it here. There are many bloggers who study El Nino-Southern Oscillation, using many different variables, so the intent of this post is to get a discussion started about what the future will bring for El Niño-Southern Oscillation (ENSO) in 2013.
It appears the sea surface temperatures in the eastern equatorial Pacific might continue to cool below the present NINO3.4 values of -0.52 deg C shown in Figure 1. The graph is from my recent post Annual Sea Surface Temperature (SST) Anomaly Update for 2012. The Reynolds OI.v2 data is available through the NOAA NOMADS website.

Figure 1
The reason I say that is there’s lots of cool subsurface water along the equatorial Pacific, a result of the last upwelling (cool) Kelvin wave. See Figure 2, which is a gif animation from NOAA here. (You may have to click-start the animation.) As you’ll note, at present, there’s are some warm subsurface waters awaiting the next downwelling (warm) Kelvin wave, and they would warm surface temperatures in the equatorial Pacific if and when work their way to the east.
Figure 2
Refer also to the Hovmoller diagram, Figure 3, from the most recent NOAA ENSO update. See page 16 there.

Figure 3
How long will the existing La Niña conditions last? Australia’s BOM is projecting ENSO neutral conditions through July 2013, while NOAA is being more cautious and limiting their ENSO-neutral projection only through boreal spring (though the models they present show the ENSO-neutral conditions extending into the summer). Refer to the most recent updates from BOM here and NOAA here.
HOWEVER
There’s an off-equatorial pool of warm water in the northwestern tropical Pacific that shows up in the NODC ocean heat content data, Figure 4. The map was created at the KNMI Climate Explorer.

Figure 4
It also appears in the AVISO sea level anomalies for Dec 2012, Figure 5.

Figure 5
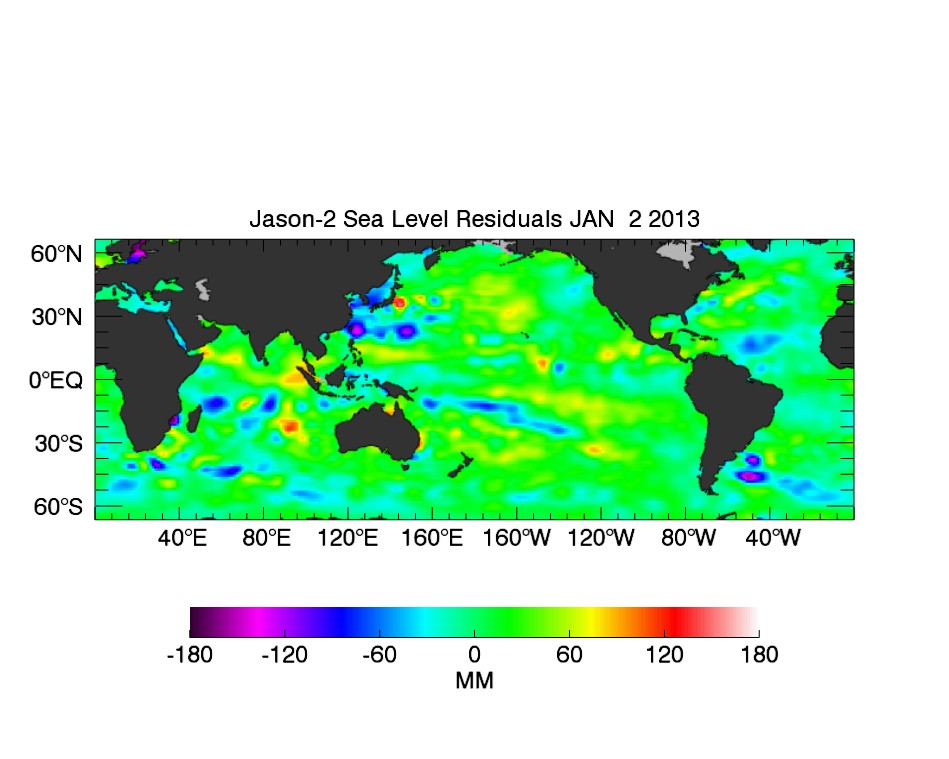
And it shows up in the JPL sea level anomalies, Figure 6, but it’s not as pronounced .

Figure 6
If that pool heads north or works its way into the Indian Ocean, then it won’t be involved in the next downwelling (warm) Kelvin wave to scoot across the equator in the Pacific, but if it migrates south, it could help to strengthen the next one and bring us back to El Niño conditions again in 2013.
Those were great big ifs.
INTERESTED IN LEARNING MORE ABOUT THE EL NIÑO AND LA NIÑA AND THEIR LONG-TERM EFFECTS ON GLOBAL SEA SURFACE TEMPERATURES?
Why should you be interested? Sea surface temperature records indicate El Niño and La Niña events are responsible for the warming of global sea surface temperature anomalies over the past 30 years and ocean heat content since 1955, not manmade greenhouse gases. I’ve searched sea surface temperature records and ocean heat content data for more than 4 years (more than 3 years for the ocean heat content data), and I can find no evidence of an anthropogenic greenhouse gas signal. That is, the warming of the global oceans has been caused by Mother Nature, not anthropogenic greenhouse gases.
I’ve recently published my e-book (pdf) about the phenomena called El Niño and La Niña. It’s titled Who Turned on the Heat? with the subtitle The Unsuspected Global Warming Culprit, El Niño Southern Oscillation. It is intended for persons (with or without technical backgrounds) interested in learning about El Niño and La Niña events and in understanding the natural causes of the warming of our global oceans for the past 31 years. Because land surface air temperatures simply exaggerate the natural warming of the global oceans over annual and multidecadal time periods, the vast majority of the warming taking place on land is natural as well. The book is the product of years of research of the satellite-era sea surface temperature data that’s available to the public via the internet. It presents how the data accounts for its warming—and there are no indications the warming was caused by manmade greenhouse gases. None at all.
Who Turned on the Heat? was introduced in the blog post Everything You Every Wanted to Know about El Niño and La Niña… …Well Just about Everything. The Updated Free Preview includes the Table of Contents; the Introduction; the beginning of Section 1, with the cartoon-like illustrations; the discussion About the Cover; and the Closing.
Please buy a copy. Credit/Debit Card through PayPal. You do NOT need to open a PayPal account. Simply scroll down to the “Don’t Have a PayPal Account” purchase option. It’s only US$8.00.
Tasty but dangerously dry mid-high 50s right now for Albuquerque NM! Meanwhile the rest of the US including Florida of all places is going through continual abnormal cold! It gets crazier, climatologists are predicitng high 60s-mid 70s for Feburary here in Albuquerque as well! This winter heatwave feels like a classic La Nina pattern to me. Actually I think december 2012 there was less snow for New Mexico then the previous few La Nina winters! I love to go and hike with with just a Tshirt and jeans but I know the mega-fires are destined this spring and summer and the 2013 fire season will surpass 2012 as the worst in New Mexico history! Farms and some regions’ drinking water will also drastically be effective! I don’t care if its rain or snow New Mexico needs moisture soon!
Correction, I’ve heard the predicted temps for Feb will be in the upper 60s, there may be a few days towards March that reach the 70s but the average will be high 60s for Feb.