We’re Expecting: Will it be a Boy, a Girl, or ENSO-Neutral in 2013?
There was lots of interest in the short-lived El Niño conditions in 2012. Recently, they very quickly transformed into the present weak La Niña conditions. NINO3.4 sea surface temperature anomalies are right at NOAA’s -0.5 threshold for La Niña conditions. I’ve received some questions about them over the past few weeks, and Steven Goddard has a recent post about it here. There are many bloggers who study El Nino-Southern Oscillation, using many different variables, so the intent of this post is to get a discussion started about what the future will bring for El Niño-Southern Oscillation (ENSO) in 2013.
It appears the sea surface temperatures in the eastern equatorial Pacific might continue to cool below the present NINO3.4 values of -0.52 deg C shown in Figure 1. The graph is from my recent post Annual Sea Surface Temperature (SST) Anomaly Update for 2012. The Reynolds OI.v2 data is available through the NOAA NOMADS website.

Figure 1
The reason I say that is there’s lots of cool subsurface water along the equatorial Pacific, a result of the last upwelling (cool) Kelvin wave. See Figure 2, which is a gif animation from NOAA here. (You may have to click-start the animation.) As you’ll note, at present, there’s are some warm subsurface waters awaiting the next downwelling (warm) Kelvin wave, and they would warm surface temperatures in the equatorial Pacific if and when work their way to the east.
Figure 2
Refer also to the Hovmoller diagram, Figure 3, from the most recent NOAA ENSO update. See page 16 there.

Figure 3
How long will the existing La Niña conditions last? Australia’s BOM is projecting ENSO neutral conditions through July 2013, while NOAA is being more cautious and limiting their ENSO-neutral projection only through boreal spring (though the models they present show the ENSO-neutral conditions extending into the summer). Refer to the most recent updates from BOM here and NOAA here.
HOWEVER
There’s an off-equatorial pool of warm water in the northwestern tropical Pacific that shows up in the NODC ocean heat content data, Figure 4. The map was created at the KNMI Climate Explorer.

Figure 4
It also appears in the AVISO sea level anomalies for Dec 2012, Figure 5.

Figure 5
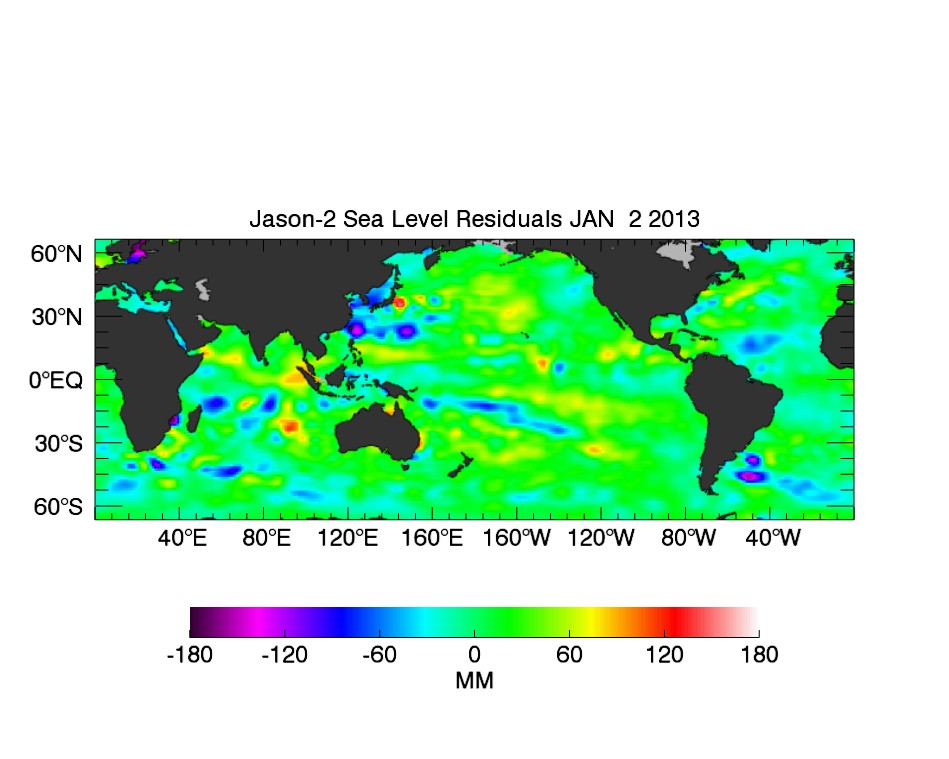
And it shows up in the JPL sea level anomalies, Figure 6, but it’s not as pronounced .

Figure 6
If that pool heads north or works its way into the Indian Ocean, then it won’t be involved in the next downwelling (warm) Kelvin wave to scoot across the equator in the Pacific, but if it migrates south, it could help to strengthen the next one and bring us back to El Niño conditions again in 2013.
Those were great big ifs.
INTERESTED IN LEARNING MORE ABOUT THE EL NIÑO AND LA NIÑA AND THEIR LONG-TERM EFFECTS ON GLOBAL SEA SURFACE TEMPERATURES?
Why should you be interested? Sea surface temperature records indicate El Niño and La Niña events are responsible for the warming of global sea surface temperature anomalies over the past 30 years and ocean heat content since 1955, not manmade greenhouse gases. I’ve searched sea surface temperature records and ocean heat content data for more than 4 years (more than 3 years for the ocean heat content data), and I can find no evidence of an anthropogenic greenhouse gas signal. That is, the warming of the global oceans has been caused by Mother Nature, not anthropogenic greenhouse gases.
I’ve recently published my e-book (pdf) about the phenomena called El Niño and La Niña. It’s titled Who Turned on the Heat? with the subtitle The Unsuspected Global Warming Culprit, El Niño Southern Oscillation. It is intended for persons (with or without technical backgrounds) interested in learning about El Niño and La Niña events and in understanding the natural causes of the warming of our global oceans for the past 31 years. Because land surface air temperatures simply exaggerate the natural warming of the global oceans over annual and multidecadal time periods, the vast majority of the warming taking place on land is natural as well. The book is the product of years of research of the satellite-era sea surface temperature data that’s available to the public via the internet. It presents how the data accounts for its warming—and there are no indications the warming was caused by manmade greenhouse gases. None at all.
Who Turned on the Heat? was introduced in the blog post Everything You Every Wanted to Know about El Niño and La Niña… …Well Just about Everything. The Updated Free Preview includes the Table of Contents; the Introduction; the beginning of Section 1, with the cartoon-like illustrations; the discussion About the Cover; and the Closing.
Please buy a copy. Credit/Debit Card through PayPal. You do NOT need to open a PayPal account. Simply scroll down to the “Don’t Have a PayPal Account” purchase option. It’s only US$8.00.
In my untrained opinion, looks like 2013 will be a moderate to strong El Niño year. Unfortunately, as it may help it to be a warmer than normal earthly temp. That is the last thing I want to hear.
Has anyone else noticed that for months now we have had no more sea level graphs from NOAA? They say that they are doing a recalculation but it is taking a very long time to complete.
JOE says
The energy comes from solar input (plus a little geothermal).
Henry says
true. But I would even make that a little more specific. Because the spectrum of water shows absorbency in the UV and IR regions, it is specifically these types of radiation that heat the water, causing the oceans to act as store room of energy. It is the slight variation in UV that causes a big variation in the amount of energy being slammed into the big oceans, due to back radiation by ozone and others. Hence we are now cooling whilst ozone and HxOx and NxOx are increasing at the TOA.
In the amination its remarkable how the east Pacific warmth completely dissipated.
At the end we have cool east Pacific and in the west Pacific, significant warmth just subsurface. If this western warmth popped up to the surface we would have the perfect scenario for a STRONG LA NINA – big east-west temperature gradient to drive the trades and further increase cold eastern upwelling.
Strong La Nina – that’s my guess FWIW. Those habitually waiting for el Ninot will go on waiting …
phlogiston says: “In the amination its remarkable how the east Pacific warmth completely dissipated.”
As the upwelling (cool) Kelvin wave makes its way across the equator, it can displace the remaining warm water, shifting it away from the equator, so that it no longer appears in that animation. You can watch the warm and cool anomalies shifting, spreading out in waves, away from the equator in the following animation. Unfortunately, the Kelvin waves don’t show up that well.
http://i54.tinypic.com/eu4pzq.jpg
It’s from my last ARGO-era OHC update:
http://bobtisdale.wordpress.com/2011/03/25/argo-era-nodc-ocean-heat-content-data-0-700-meters-through-december-2010/
jim Steele, thanks for all of the references. It’ll be a while until I get get to them and read them. Lots of blogging on my plate right now. Thanks again, they should make for interesting reading.
John Whitman says: “Do you consider the ENSO (and its related) phenomena as a variable natural cyclic subsystem within a larger system?”
It surely is not a system independent of the rest of the other coupled ocean-atmosphere processes. Unfortunately, we only have a few years (a decade) of reasonable temperature and salinity measurements at depth (ARGO) so we know very little about subsurface “weather” throughout the Pacific and the adjoining oceans. We also have very little sea surface temperature data at high latitudes in the South Pacific and also in the Southern Ocean before the satellite era. We have no idea if there is a cycle in the sea surface temperatures of the Southern Ocean and what its influence might be on the variations in the frequency, magnitude and “skewness” of ENSO—with skewness referring to the tendency toward El Nino or La Nina during multidecadal periods. There are too many early unknowns , which is why I study aftereffects—what the data presents.
The SOI is also some sort of measure that goes with ENSO. This measure is very close to zero. It is my understanding that it gets to be very positivie during a La Nina, and very negative during an El Nino. Is it used to try and decide what is happening?
As an aside, people dont seem to be familiar with where the expression El Nino originates. In a Catholic country, like Peru where the name originated, EL Nino is the Christ child, because the first signs tend to be felt at Christmas. The first signs were all of impending disaster; the Humboldt current moves some 200 miles west, and the inshore anchovy fishery collapses. EL Nino ought to bring gifts, not disaster. La Nina has no such meaning, and is merely the opposite of El Nino.
Given the fact that global temperatures are not rising at the rate predicted by the models, obviously CO2 is not the main driver of climate. The warming caused by CO2 will ride on top of temperature caused by the more dominate climate mechanisms. There is no physical evidence that the extra warming will be amplified. In fact, given the overwhelming force of the other mechanisms, it is reasonable to assume these mechanisms will continue to act in a manner to moderate global temperatures.
– – – – – – –
Bob Tisdale,
Thank you for your reply.
You mentioned “subsurface ‘weather’ throughout the Pacific and the adjoining oceans”. A useful expression. I had not thought about the ocean in quite that way.
John
Jim Cripwell says: EL Nino ought to bring gifts, not disaster. La Nina has no such meaning, and is merely the opposite of El Nino.
An El Nino Christmas gift makes for a nice story but it brings disaster for the fishermen. Indeed the Peruvians noticed a stream of warm water flowing down from Ecuador each winter. However when the warm stream was extreme it shuts down upwelling. The whole ocean food chain depends on upwelling to bring nutrients that always sink into the dark depths back up into the sunlit zones. El Nino’s warm waters create a “thermal lid” that inhibits nutrients from reaching the surface. I suspect the momentum of the wave of eastward warm water would also promote downwelling as it is trapped against the coast. The seabird populations collapse during an El NIno as upwelling slows, affecting the whole food chain. The warm phase of the PDO also inhibits upwelling. Anchovies boom during cool PDO’s and wane during warm PDO’s while the sardines do the opposite. Steinbeck’s Cannery Row was bout the sardine collapse from the regime shift to the cool PDO in the 1940’s. The earliest documented extreme El Niño occurred in the 1890’s when the flood of warm ocean water carried crocodiles from Ecuador down the coast to Peru and heavy rains turned the Peruvian deserts into grasslands. El NIno brings rains to Peru but droughts to southeast Asia and conversely La NIna brings drought to Peru but rains to Asia. It is a climate see-saw that robs Peter to pay Paul. Francisco Chavez from Monterey BAy Aquarium has written much about the effects of El Nino and La Nina on his native Peru. If you are interested in the biological gifts of ENSO and PDO cycles start with Chavez,. F., et al., (2011) Marine Primary Production in Relation to Climate Variability and Change. Annual Review of Marine Science, vol. 3, p. 227–260.
Bill Illis says: January 17, 2013 at 4:16 pm
=====================================
This has been an informative thread. Bill Illis shares insights into the natural processes involved in ENSO. I am intrigued by the role of cold water currents and upwelling, and how these contribute to ENSO.
Bill, as it stands now ENSO is a puzzle, in that the ultimate cause of the oscillation is not understood. Possibly, the key to understanding ENSO is the cold water currents and upwelling, and the variation of this factor over time. How do you see this?
@Steven Mosher says:
January 17, 2013 at 12:38 pm
You’ve said many time that “El Nino” is responsible for the ocean warming. What I haven’t understood from your discussion is where the energy is coming from?
#############
it comes from the only sources it can. Solar input and amplification via GHGs.
The ocean cycles cannot add to or subtract from the energy balance. They dont cause global warming. they are the way that warming is expressed. They are not the cause of long term trends.
+++++++++++++++++++
Mosher: Again the broken record. You never ever explain yourself… just make unsubstantiated claims.
The basic idea is that La Nina occurs when the westward winds blow more warm surface waters to the west. This exposes more cool waters. Cool waters produce fewer clouds. More sun energy therefore warms the cooler water. This is where the heat comes from… it’s the sun having more direct influence on the cool water rather than allowing it to radiate back into space. If cool water is made less cool, it has more heat. More heat not from GHGs.
Steve: Could you try being more open minded here? Your well spoken nature could make you an important person in the quest to help people learn critical thinking skills. But you waste yourself on an ideology instead.
mpainter says:
January 18, 2013 at 9:18 am
————-
My estimate from this summer about where Nino 3.4 would be right now is +1.0C. Instead, it is -0.5C and I’m only 3 for 6 in long-term guestimates. Shorter-term one can get closer, but beyond
several months, its too unpredictable.
This is the July, 2012, prediction plumes from the ENSO models. Just as bad as me this year (and worse previously).
http://iri.columbia.edu/climate/ENSO/currentinfo/archive/201207/SST_table.gif
Generally, we can understand what is happening and how it is happening. Right now that is. But the Pacific ocean is deep and variable and couples with the atmosphere producing an additional enhancement (except this year, when the atmosphere completely decoupled with the ENSO and pushed it in the opposite direction) so we still don’t know enough about the ENSO. Maybe we never will.
But then, how is that different than the obstacles faced by a global warming climate model. Same deal IMO which is why I am a skeptic. We have to see what the climate is doing rather than forecast it because it is so complex and so much that we don’t know about is occuring every day.
phlogiston says
Strong La Nina – that’s my guess FWIW.
\
henry says
mine too/
It has been rather surprising to me to see how much energy was in our store, for so long,
but I think the store is empty now…
strong cooling is coming up,
mark my words,
http://blogs.24.com/henryp/2012/10/02/best-sine-wave-fit-for-the-drop-in-global-maximum-temperatures/
Bob Tisdale, what do you think of this comment: • The basin-wide equatorial
upper ocean (0-300 m) heat
content is greatest prior to and
during the early stages of a
Pacific warm (El Niño) episode
(compare top 2 panels) and least
prior to and during the early
stages of a cold (La Niña) episode.
from here:http://www.cpc.ncep.noaa.gov/products/analysis_monitoring/lanina/enso_evolution-status-fcsts-web.pdf
I did download your pdf. Have you thought about submitting it to an academic publishing house such as Springer? I would expect it to get a wider readership among graduate students that way.
Bob Tisdale: It surely is not a system independent of the rest of the other coupled ocean-atmosphere processes. Unfortunately, we only have a few years (a decade) of reasonable temperature and salinity measurements at depth (ARGO) so we know very little about subsurface “weather” throughout the Pacific and the adjoining oceans. We also have very little sea surface temperature data at high latitudes in the South Pacific and also in the Southern Ocean before the satellite era. We have no idea if there is a cycle in the sea surface temperatures of the Southern Ocean and what its influence might be on the variations in the frequency, magnitude and “skewness” of ENSO—with skewness referring to the tendency toward El Nino or La Nina during multidecadal periods. There are too many early unknowns , which is why I study aftereffects—what the data presents.
Is that equivalent to saying that the ENSO is a part of a larger oscillatory system but all the feedbacks and feedforwards (“couplings” etc) are poorly characterized because there are not enough data?
Ethically Civil: You’ve said many time that “El Nino” is responsible for the ocean warming. What I haven’t understood from your discussion is where the energy is coming from?
Steve Mosher:
#############
it comes from the only sources it can. Solar input and amplification via GHGs.
The ocean cycles cannot add to or subtract from the energy balance. They dont cause global warming. they are the way that warming is expressed. They are not the cause of long term trends.
Please notice that the last 3 of your 4 sentences there are irrelevant to the question, which was not about how ocean warming drives the climate, but is about where the energy for the warming of the oceans comes from. The energy to warm the oceans comes from the sun. However, the ocean cycles can add to or subtract from the atmospheric energy balance; they can cause warming of the global atmosphere, and they can be the cause of long-term trends in atmospheric temperatures.
“Amplification” by GHGs is a mysterious concept; allegedly what the GHGs do is slow the rate of cooling of the surface (via all that absorption and back radiation), which has acquired its warming from the sun. I argued in a previous post that the evidence is insufficient to rule out a role for GHGs in altering the amplitude of the ENSO over the long term. But here the reference to GHGs is gratuitous. The energy to warm the oceans comes from the sun.
Oh. I see everyone else has gone home.
Matthew R Marler says: “Oh. I see everyone else has gone home.”
Sorry about the delay in my reply. Off doing family stuff.
Matthew R Marler says: “Is that equivalent to saying that the ENSO is a part of a larger oscillatory system but all the feedbacks and feedforwards (“couplings” etc) are poorly characterized because there are not enough data?”
ENSO is the most significant short-term and decadal climate phenomenon on the planet. We have little idea about its feedbacks or if part of a larger oscillatory system.
Matthew R Marler says: “Have you thought about submitting it to an academic publishing house such as Springer?”
I’ve looked at the costs of hardcopy editions and I can’t see many people spending well above $100US for something they could buy in electronic format for less than $10.
Thanks for buying a copy.
I hope I’ve caught everyone’s questions.
Thanks, Anthony.
I also like the expression “subsurface weather” although “submarine weather” would catch the concept even better.
Bob Tisdale: I’ve looked at the costs of hardcopy editions and I can’t see many people spending well above $100US for something they could buy in electronic format for less than $10.
After downloading the pdf of another book, for free, I purchased the bound version for $80 plus tax. That’s cheaper than printing the pdf at home or Office Depot. I am reading that book now. How many like me there are I do not know, but I know a lot of us. Besides us, there are libraries. Springer, Chapman-Hall, Elsevier etc display their books at scientific conferences almost every week of the year internationally, and they mail out fliers to the professionals of many scientific societies. So I repeat my recommendation, tedious though I may be.
The ENSO 3.4 value is down again this week and the ENSO meter is into La Niña conditions again this week:
Opening http://nomad3.ncep.noaa.gov/cgi-bin/pdisp_sst.sh?ctlfile=oiv2.ctl&ptype=ts&var=ssta&level=1&op1=none&op2=none&day=22&month=dec&year=2012&fday=21&fmonth=jan&fyear=2013&lat0=-5&lat1=5&lon0=-170&lon1=-120&plotsize=800×600&title=&dir=
Found target /png/tmp/CTEST135876961513904.txt
Opening http://nomad3.ncep.noaa.gov//png/tmp/CTEST135876961513904.txt
Data file
data from 00Z22DEC2012 to 00Z21JAN2013
“———-”
-0.119068
-0.045533
-0.228761
-0.514692
-0.561866
Length of data file 102, most recent value: -0.561866
file_last -0.514692
anomaly -06
From the sudden drop two weeks ago, I wouldn’t have been surprised to see a warmer value this week, but from the SST images, that is looking like a nice wedge of cool water in the east. Like recessions, it’ll be a while before an official La Niña is declared.
Henry@Ric
Interestting news. Obviously we all knew it was coming. The Big Cold is on its way.