We’re Expecting: Will it be a Boy, a Girl, or ENSO-Neutral in 2013?
There was lots of interest in the short-lived El Niño conditions in 2012. Recently, they very quickly transformed into the present weak La Niña conditions. NINO3.4 sea surface temperature anomalies are right at NOAA’s -0.5 threshold for La Niña conditions. I’ve received some questions about them over the past few weeks, and Steven Goddard has a recent post about it here. There are many bloggers who study El Nino-Southern Oscillation, using many different variables, so the intent of this post is to get a discussion started about what the future will bring for El Niño-Southern Oscillation (ENSO) in 2013.
It appears the sea surface temperatures in the eastern equatorial Pacific might continue to cool below the present NINO3.4 values of -0.52 deg C shown in Figure 1. The graph is from my recent post Annual Sea Surface Temperature (SST) Anomaly Update for 2012. The Reynolds OI.v2 data is available through the NOAA NOMADS website.

Figure 1
The reason I say that is there’s lots of cool subsurface water along the equatorial Pacific, a result of the last upwelling (cool) Kelvin wave. See Figure 2, which is a gif animation from NOAA here. (You may have to click-start the animation.) As you’ll note, at present, there’s are some warm subsurface waters awaiting the next downwelling (warm) Kelvin wave, and they would warm surface temperatures in the equatorial Pacific if and when work their way to the east.
Figure 2
Refer also to the Hovmoller diagram, Figure 3, from the most recent NOAA ENSO update. See page 16 there.

Figure 3
How long will the existing La Niña conditions last? Australia’s BOM is projecting ENSO neutral conditions through July 2013, while NOAA is being more cautious and limiting their ENSO-neutral projection only through boreal spring (though the models they present show the ENSO-neutral conditions extending into the summer). Refer to the most recent updates from BOM here and NOAA here.
HOWEVER
There’s an off-equatorial pool of warm water in the northwestern tropical Pacific that shows up in the NODC ocean heat content data, Figure 4. The map was created at the KNMI Climate Explorer.

Figure 4
It also appears in the AVISO sea level anomalies for Dec 2012, Figure 5.

Figure 5
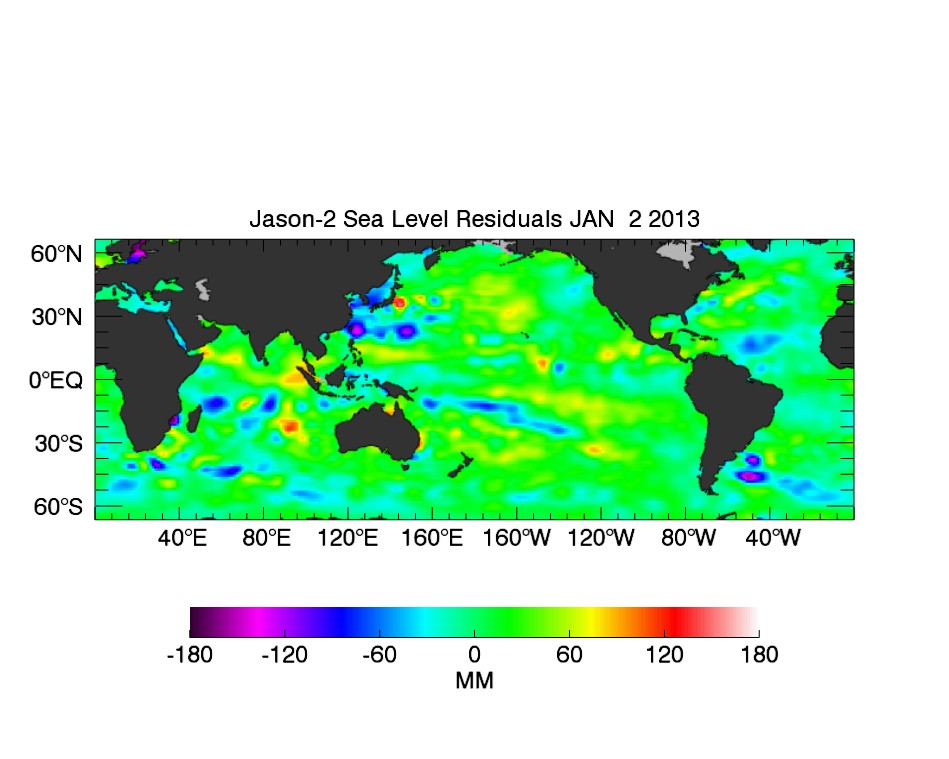
And it shows up in the JPL sea level anomalies, Figure 6, but it’s not as pronounced .

Figure 6
If that pool heads north or works its way into the Indian Ocean, then it won’t be involved in the next downwelling (warm) Kelvin wave to scoot across the equator in the Pacific, but if it migrates south, it could help to strengthen the next one and bring us back to El Niño conditions again in 2013.
Those were great big ifs.
INTERESTED IN LEARNING MORE ABOUT THE EL NIÑO AND LA NIÑA AND THEIR LONG-TERM EFFECTS ON GLOBAL SEA SURFACE TEMPERATURES?
Why should you be interested? Sea surface temperature records indicate El Niño and La Niña events are responsible for the warming of global sea surface temperature anomalies over the past 30 years and ocean heat content since 1955, not manmade greenhouse gases. I’ve searched sea surface temperature records and ocean heat content data for more than 4 years (more than 3 years for the ocean heat content data), and I can find no evidence of an anthropogenic greenhouse gas signal. That is, the warming of the global oceans has been caused by Mother Nature, not anthropogenic greenhouse gases.
I’ve recently published my e-book (pdf) about the phenomena called El Niño and La Niña. It’s titled Who Turned on the Heat? with the subtitle The Unsuspected Global Warming Culprit, El Niño Southern Oscillation. It is intended for persons (with or without technical backgrounds) interested in learning about El Niño and La Niña events and in understanding the natural causes of the warming of our global oceans for the past 31 years. Because land surface air temperatures simply exaggerate the natural warming of the global oceans over annual and multidecadal time periods, the vast majority of the warming taking place on land is natural as well. The book is the product of years of research of the satellite-era sea surface temperature data that’s available to the public via the internet. It presents how the data accounts for its warming—and there are no indications the warming was caused by manmade greenhouse gases. None at all.
Who Turned on the Heat? was introduced in the blog post Everything You Every Wanted to Know about El Niño and La Niña… …Well Just about Everything. The Updated Free Preview includes the Table of Contents; the Introduction; the beginning of Section 1, with the cartoon-like illustrations; the discussion About the Cover; and the Closing.
Please buy a copy. Credit/Debit Card through PayPal. You do NOT need to open a PayPal account. Simply scroll down to the “Don’t Have a PayPal Account” purchase option. It’s only US$8.00.
Well we know that NOAA/NASA will predict a super Nino, and consequently the warmest year ever.
And then will adjust the data to until they get it.
Shouldn’t this: “appears the sea surface temperatures in the eastern equatorial Pacific might continue to cool below the present NINO3.4 values of -0.52 deg C shown in Figure 1.”
Be more like this: “appears the sea surface temperature anomaly in the eastern equatorial Pacific might continue to cool below the present NINO3.4 values of -0.52 deg C shown in Figure 1.”
I say neutered in the stall-it will tip back and forth but mostly neutral-then back to nina….
That Indian Ocean warm poll will migrate north….
Just guessing however..
Dude looks like a lady!
There is an animation of 0-300 metre ocean heat content from the Godas system which shows the whole ocean and, in which, one can see there is much cool water flowing in from the north and south Pacific on the eastern side.
http://www.cpc.ncep.noaa.gov/products/GODAS/pent_gif/xy/movie.h300.gif
And the latest update of the equatorial cross-section shows there has been considerable cooling in the last week -5.0C are showing up which is as cold as this cross-section gets.
http://www.cpc.ncep.noaa.gov/products/GODAS/pent_gif/xz/pent.anom.xz.temp.0n.1.gif
A typical measure is the Temperature anomaly in the 0-300 metre equatorial Pacific from 180W to 100W which is down to -0.6C in the last week.
http://s7.postimage.org/uu6sw8rh7/EPUOTA_Jan10_2013.png
And this measure typically leads Nino 3.4 by 1 to 2 months so yeah we are heading down to La Nina territory.
http://s9.postimage.org/qsvrvo3i7/Nino_3_4_vs_EPUOTA_Dec12.png
Robert M: Yup, it should’ve read anomalies.
Bill Illis says: “There is an animation of 0-300 metre ocean heat content from the Godas system…”
Thanks for that link. Looks like the “leftovers” from the flash-in-the-pan El Nino are making their way into the East Indian Ocean.
Michael Mann has talked about global warming leading to La Nina like conditions, yielding more droughts. He also concluded that it meant climate models vastly overstate warming.
You’ve said many time that “El Nino” is responsible for the ocean warming. What I haven’t understood from your discussion is where the energy is coming from? Clearly the “enhanced” greenhouse effect doesn’t correlate to the ocean temperature (“It’s a travesty!”), but just having hot and cold water sloshing back and forth across the ocean can’t increase the total energy of the system… so that’s where you lose me.
No snark intended, I just like that particular bit of ignorance eliminated.
EC
“bit of ignorance” meaning *my* ignorance, not Bob’s. 🙂
Hi Bob, and thanks for all your postings about ENSO. It must be quite a reward for you to see the mainstream climatologists one by one blaim ENSO for being more than just a yearly variation (read: noise). I’ve read your book, and i’ve learned a lot from that and from Kristians norwegian interpretation of your work.
Have you read his “Warming by the Sun or by the Atmosphere …?”?
http://klimaforskning.com/forum/index.php/topic,1148.0.html
I bet La Nina, if Hansen has forecast El Nino again.
We’re Expecting: Will it be a Boy, a Girl, or ENSO-Neutral in 2013?
Is this a ‘pregnant pause’?
MtK
The Pacific Decadal Oscillation represents an east west pattern of ocean heat that is not just driven by residual waters from previous El Nino and La NIna events but the PDO in turns alters the Walker Circulation in ways that encourages one cycle over the other. The current cool phase of the PDO encourages more La Nina events. However weakening trade winds will allow more El Ninos. Declining solar activity reduces the Hadley circulation and thus the trade winds allowing the warm pool to more readily slosh eastward in an EL NIno, as appears to be the case during the Little Ice Age. So we are in a situation where current ocean surface temperatures promote more La NInas but solar activity promotes more El NInos. I suspect we will see more back and forth conditions in contrast to the multiyear El Ninos of the 1980s and 90s. Also because the ocean stores more heat during a La NIna but the solar activity has waned, I would suspect a cooling warm pool and a smaller supply of heated water for future El Ninos. In contrast to Jim Hansen’s predicted super El Ninos I would predict smaller extremes. This also suggests there will be less of an east west temperature gradient and thus I would predict shorter intervals between El Nino and La NIna and more neutral events.
You’ve said many time that “El Nino” is responsible for the ocean warming. What I haven’t understood from your discussion is where the energy is coming from?
#############
it comes from the only sources it can. Solar input and amplification via GHGs.
The ocean cycles cannot add to or subtract from the energy balance. They dont cause global warming. they are the way that warming is expressed. They are not the cause of long term trends.
Ethically Civil says,
“You’ve said many time that “El Nino” is responsible for the ocean warming. What I haven’t understood from your discussion is where the energy is coming from? ”
I really recommend Bob’s book, $8, as it explains this very clearly. I am a layman and it is an excellent read which is easy to follow for me and therefore for most other people as well.
This sucks. Here in CA we are getting ready to utter the D word. I hate La Nina and hate negative PDO even more.
Here is a high resolution (1/4 deg) OI SST AVHRR map from Jan 14, rendered with WebGL. It does show a marked La Nina cool jet in the E Pacific.
Bill Illis, “one can see there is much cool water flowing in from the north and south Pacific on the eastern side.”
How do you tell from the gif that it is cool water from the poles and not increased upwelling from below? La Nina conditions increase the California and Humboldt currents and ekman pumping then increases upwelling of cooler water. However I agree that the increased currents would also deliver more cold water equatorward. So I suspect both dynamics but I can’t tell from your gif
Am I right to think that a third la-nina, is going to see a continuation of this past year’s drought? I’ve recently gotten the idea from somewhere, that multiple la-ninas have that effect.
Bill Illis, From where did you derive or obtain the graph of equatorial heat anomalies and to what depths do those anomalies represent ?
Ethically Civil says:
January 17, 2013 at 11:36 am where?”
The ocean from 30 N to 30 S is a big region. Clear sky allows solar energy to enter the water. No GHG amplification needed. Trade Winds move the warm water westward and so on . . .
For some reason I think 2013 will be El Nino year. Not very strong but a bit stronger than 2012.
La Nina should be renamed La Bruja
Steven Mosher says:
January 17, 2013 at 12:38 pm
You’ve said many time that “El Nino” is responsible for the ocean warming. What I haven’t understood from your discussion is where the energy is coming from?
#############
it comes from the only sources it can. Solar input and amplification via GHGs.
————————————————————————————————–
Not quite.
The energy comes from solar input (plus a little geothermal). For GHGs to “amplify” that input would require an additional source to supply the difference.or the spontaneous creation of energy from nowhere. I can’t imagine even Hansen wouldn’t suggest that GHGs can do THAT?