
Guest post by Alec Rawls
When he argues that a reduction in forcing will cause cooling Dana Nuccitelli is not actually talking about drinking. He is talking about the solar forcing of global temperature, but the drinking analogy is a handy way to understand where his argument goes off the rails.
Mr. Nuccitelli, who blogs for the consensus-approved Skeptical Science website, was writing about Henrik Svensmark’s GCR-cloud theory of indirect solar forcing, where Galactic Cosmic Rays are hypothesized to seed cloud formation. If Svensmark is right then a strong solar wind, by deflecting some GCR from reaching the earth, in-effect blows some of the clouds away, letting more sunlight through to warm the planet’s surface.
That can’t possibly explain late 20th century warming says Nuccitelli, because GCR deflection has been estimated (see the Krivova-Solanki graph above) to have peaked by 1980. The raw data suggests the actual GCR minimum was ten years later, but set that aside. Nuccitelli thinks it is the change in the level of forcing, not the level of forcing, that determines whether the climate system warms or cools:
So, if GCRs really do amplify the solar influence on global temperatures, since 1980 they are amplifying a cooling effect.
Cooling begins when a forcing passes its peak? Fail. Daily temperatures don’t start falling at noon. They continue rising until mid-afternoon. The hottest time of the year isn’t the first day of summer (the summer solstice, after which the days start getting shorter), the hottest time is mid-summer. To think cooling should start when forcing passes its peak is like thinking you can sober up by drinking just a little more slowly.
Here’s a tip for Dana to keep in mind on New Year’s eve: it is the level of alcohol forcing that matters. If you are drinking alcohol faster than you body is excreting it (not exactly the way the earth excretes heat, but similar enough), then your blood alcohol is rising. You are getting drunker, even if you have lowered the rate of your drinking! That’s right, putting a little less rum in your egg nog will not sober you up! Your increasing inebriation will just be a little less rapid, and it is the same for solar forcing.
When the peak level of forcing appears in the rearview mirror, the downward trend in the forcing that begins at that point does not cause cooling. It just causes warming to be a little less rapid. Only when the energy pouring into the climate system falls to the level of the energy escaping back out does the system stop warming. Empirically, that turns out to be mid-afternoon, mid-summer, and approximately the first decade of the 21st century.
Three blind mice
Dana Nuccitelli produced one of three widely cited rebuttals to my suggestion that a new sentence that was added to the Second Order Draft of AR5, a sentence that admits strong evidence for some substantial mechanism of solar amplification, is a “game changer.” That admission is on page 7-43 of the SOD:
Many empirical relationships have been reported between GCR or cosmogenic isotope archives and some aspects of the climate system … The forcing from changes in total solar irradiance alone does not seem to account for these observations, implying the existence of an amplifying mechanism such as the hypothesized GCR-cloud link.
That’s a game changer because the only solar forcing included in the IPCC computer models is the very slight variance in solar irradiance (also known as TSI, or “the solar constant”). If there are other solar forcings in play, working through variables that actually vary substantially as solar activity ramps up and down, that kills the report’s key finding (on page 8-4) that we can have “very high confidence that natural forcing is a small fraction of the anthropogenic forcing.”
The two most widely cited rebuttals, which I answered last week, were both by lead authors from the IPCC. Steven Sherwood, one of 15 lead authors of chapter 7, pretended that the admission of evidence for “an amplifying mechanism” was only about GCR-cloud. He then proceeded to claim that the evidence for GCR-cloud points to a weak mechanism, and used that as a grounds for dismissing the idea that any substantial solar forcing beyond TSI could be at work.
Doesn’t follow. The evidence for “an amplifying mechanism” (emphasis added) is entirely separate from the evidence for the GCR-cloud mechanism. The former is paleo evidence, where numerous studies of the geologic record have found strong correlations between solar activity and climate going back many thousands of years. The evidence for the GCR-cloud mechanism is from cloud-chamber experiments and ongoing observations of cloud micro-physics.
It doesn’t matter how unconvinced Sherwood is by the evidence for the GCR-cloud mechanism. That evidence does nothing to counter the paleo evidence, cited in the draft report, that some mechanism of enhanced solar forcing must be at work. By using his discontent with the GCR-cloud theory as an excuse to dismiss the paleo evidence, Sherwood is inverting the scientific method, and he is lying to the public about what the report says, making him a seriously bad guy.
Apparently weak minds think alike because Nuccitelli did the same thing Sherwood did, only a day earlier. Dana’s post only looks at the GCR-cloud mechanism and completely ignores the draft report’s admission of strong evidence for some mechanism of solar amplification. It is in the context of that more fundamental mistake that Nuccitelli goes on to completely misinterpret the evidence for the GCR-cloud mechanism itself, claiming that anything less than peak forcing causes cooling, arguing in-effect that he can sober up by drinking a little slower. Just tell that to the officer Dana. He won’t even need to give you a breathalyzer.
More evidence that weak minds think alike is the second semi-official rebuttal to my “game change” claim, issued by Joanna Haigh, a lead author of the IPCC’s third report. Haigh proceeds on the same dishonest pretence as Sherwood, telling NewScientist magazine that the new sentence in the draft report is only about GCR-cloud, which she then dismisses with the same drinking-game mistake that Dana makes, claiming that if climate were being driven by solar activity then the planet would have started cooling when solar activity was at its peak:
Haigh points out that the sun actually began dimming slightly in the mid-1980s, if we take an average over its 11-year cycle, so fewer GCRs should have been deflected from Earth and more Earth-cooling clouds should have formed. “If there were some way cosmic rays could be causing global climate change, it should have started getting colder after 1985.”
Sober up Joanna. Have a single shot instead of a double. Works every time.
Which theory has more trouble with flat 21st century temperatures?
It is amusing how Dana Nuccitelli, through sheer incompetence, was able to prefigure the highly credentialed malfeasance of both of these IPCC fraudsters. Still, Nuccitelli has to be credited with at least a bit of misfeasance of his own because he wasn’t satisfied with just assuring his gullible readers that cooling commences when forcing is at its peak. That only supplied an excuse for dismissing a solar explanation for late 20th century warming, leaving the conspicuous lack of 21st century warming still to be dealt with. Dana’s solution? Pretend that the flat 21st century temperature record militates against a solar driver of climate:
In fact, GCRs reaching Earth recently hit record high levels (Figure 4), yet temperatures are still way up.
Temperatures have merely flattened out, they haven’t gone down yet, and no Skeptical Science reader will ever learn that this is just what the discovered correlations between solar activity and climate predict. The strongest temperature response to a change in solar forcing is seen with a lag of about ten years (Usoskin et al. 2005), or one solar cycle (Solheim et al. 2012). The theory that is discomfited by flat 21st century temperatures is the CO2-warming theory, which predicts ever more rapidly increasing temperatures.
Dana might actually think that the flat 21st century temperature record causes trouble for the solar-warming theory but there is no way he can think it causes less trouble for the CO2-warming theory. For him to pretend that 21st century temperatures favor the CO2-warming theory is inexcusably dishonest, but as usual, the professionals are even worse. Note this little gem from the SOD (p. 7-44):
The lack of trend in the cosmic ray intensity over the last 50 years (Agee et al., 2012; McCracken and Beer, 2007) provides another strong argument against the hypothesis of a major contribution of cosmic rays to ongoing climate change.
That’s 15 IPCC lead authors all accepting the crackpot idea that you can only get drunk if your rate of drinking is going up. Steady exposure to the high 1950’s level of solar activity will keep you from warming, just as steady swilling of a high level of booze will keep you stone-cold sober. But where Dana only said that “temperatures are still way up” (implicitly acknowledging that they are no longer going up), the draft report here claims that temperatures are still going up (“ongoing climate change”).
Must be a Steven Sherwood sentence. He needs to look at page 10-3 of the SOD (emphasis added):
While the trend in global mean temperature since 1998 is not significantly different from zero, it is also consistent with natural variability superposed on the long-term anthropogenic warming trends projected by climate models.
Note that the “consistent with natural variability” part is a near call, after NOAA admitted in 2008 that 15 years of no warming would falsify current models. But yeah, let’s pretend it is the solar theory that has trouble with the lack of recent warming.
The Guardian, Andrew Sullivan, DeSmog, Romm etcetera, all pwned by Dana Nuccitelli’s error-filled AR5 post
The ensuing Skeptical Science newsletter bragged about how many eco-propagandists picked up on nutty Nuccitelli’s non-stop nonsense and the list is indeed impressive, a glaring testament to the total absence of due diligence on the part of these “journalists,” none of whom thought to question Dana’s advice on how to sober up quick. Here is the SkS tally of eco-scalps:
This was a very big week for SkS in the news. Dana’s IPCC Draft Report Leaked, Shows Global Warming is NOT Due to the Sun was re-posted and/or linked to by The Guardian, New York Times Green, New York Times Dot Earth, Huffington Post, Climate Progress, Mother Jones, Climate Crocks, Carbon Brief, Grist, Daily Beast, DeSmogBlog, Graham Readfearn, Der Spiegel, Maribo, Learn from Nature, Alternative Energy in the 21st Century, and Motherboard. It was also Tweeted by Michael Mann and Chris Mooney, among many others.
The only “consensus” journalist on this list who showed any integrity was Andrew Revkin, who had already written a post on my leak of the draft report. After updating that post with a link to Nuccitelli, Revkin updated again later with a link to the rebuttal that Jo Nova and I wrote about Seven Sherwood. Thanks Andrew, for being an actual journalist.
To put their “big week” in perspective the folks at Credulous Science reached high for sufficient words:
Winston Churchill once said: “A lie gets halfway around the world before the truth has a chance to get its pants on.” Not this time; we got the truth’s pants on in record time and nipped this myth in the bud before the contrarians were able to misinform the public.
The “truth” in their rendering is whatever patent falsehoods can be used to fool the ignorant into thinking they should fear CO2. No, nutty ones. You did not forge an exception to Churchill’s dictum. You provided a textbook example of it.
Dana is a poster child for those who feel a moral imperative to “believe the scientists”
For the last two years I have had a lot of fun exposing the large number of top climate scientists who claim that it is not the level of forcing that causes warming, but the trend in the forcing. They are all looking at the wrong derivative (one instead of zero).
Given the enormous pressure on the eco-left to accept what these government-funded climatologists are saying it is not surprising that someone like Dana Nuccitelli would swallow the idea that temperature really is driven by the trend in the forcing, and one super-wacky segment in Dana’s post indicates that he really is accepting that this is how physics works. If you leave a pot of water on a steady flame it won’t heat. If you want to heat the water you have to keep turning the flame up. The segment is titled, “Physical Reality Intrudes on Rawls”:
Rawls has argued to the contrary by claiming that the climate is still responding to the increase in solar activity from the early 20th century, and that GCRs are amplifying that solar warming from over 60 years ago. This argument is simply physically wrong. As Figure 2 illustrates, when solar activity rises, temperatures follow suit very soon thereafter. In fact, during the mid-20th century, solar activity and global surface temperatures both flattened out. Are we to believe that the planet suddenly began responding to the pre-1950 solar activity increase in 1975—2012, after not warming 1940—1975? The argument makes no physical sense.
Obviously I never said that late 20th century warming was caused by solar activity from the early 20th century and Dana does not give a citation for what argument of mine he is referring to but its easy to figure out. I have argued many times that if one combines the strong paleo correlations between solar activity and climate with the fact that solar activity was at what Ilya Usoskin calls “grand maximum” levels from 1920 to 2000 then it is certainly plausible that much of 20th century warming, including late 20th century warming, could have been caused by the sun. 80 years of a high level of enhanced solar forcing just might warm the place up a bit (and it only did warm a bit, about 0.8 °C over the century).
If I am attributing late 20th century warming to the high solar activity that persisted through 2000, why does Dana think I am attributing it to solar forcings from 60 years earlier? He must be fixed on the idea that only a change in the level of solar forcing can cause warming. That’s what all of these top scientists have been telling everyone and there was no rise in solar activity after 1950, hence any solar-caused warming would have to stem from the pre-1950 rise in solar activity.
But come on Dana. That is not what I am saying. That is what they are saying, and I have been trying my darnedest to expose it as a blatant misrepresentation. I’m not attributing late 20th century warming to the pre-1950 rise in solar activity. I’m attributing it to the fact that solar activity remained at close to the same high 1950’s level until 2000 (or 2003). It is the level of the forcing that causes warming, not the trend in the forcing.
I have to feel bad for Dana on this point. It isn’t his fault. He has been systematically duped by this parade of so-called scientists all telling him that a persistent high level of forcing can’t cause continued warming. Makes me want to put him on a milk carton. The poor guy isn’t just lost, he was kidnapped. Want a piece of candy little boy? Credulous Science indeed.
vukcevic says:
December 29, 2012 at 3:54 pm
As long as it is in the data, I am not really much concerned if you agree or not.
but since it is not in the data http://www.leif.org/research/Even-Odd-Dst.png
you are committing scientific fraud by claiming it is.
Leif accuses:
Leif: you are the KING selective evidence. Let’s reach back real far to 10 seconds ago. You claimed NO TREND. I point out several graphs that show very clear trend and you answer with others that show less trend, then you accuse ME of being selective! Man what a hypocrite.
And now I can’t even make a general statement, very well evidenced, that UV-shift is being found by a lot of studies to be an avenue of solar influence on climate, without you jumping on me for not digging some bit of counter evidence out of one of dozens of papers on the subject? There is TONS of counter evidence. ALL of this stuff is very formative. What is insane is for the IPCC to be making extravagant declarations of certainty about it all. I’m not claiming certainty about, but you seem to be. It can’t be X. It can’t be Y. Given the state of the evidence, GCR and UV most certainly are possible mechanisms.
At present I am only sure of one fact. In the morning the sun will rise, will I see it? Don’t know. If I am alive the chance of observation increases, but it is no guarantee. Things get in the way, they exist, between me and my external source of energy. All I know is if I can see the sun I am warmer than if I cannot. I know that walls, (I grow fruit) retain more warmth the longer they are exposed to the sun.
Have a look at a few charts courtesy of the UKMO, they are only the UK, but that is where I am:-
http://www.metoffice.gov.uk/climate/uk/actualmonthly/
Have a play, look at “UK Temperature” and “UK Sunshine Hours”.
Then figure out does an increase in sunshine hours lead to higher temperatures or do higher temperatures lead to more sunshine hours?
I do hope to see and feel the warmth of the sun tomorrow!
Alec Rawls says:
December 29, 2012 at 4:30 pm
you jumping on me for not digging some bit of counter evidence out of one of dozens of papers on the subject?
I’m pointing to a paper you just cited, not dozens of others.
I’m not claiming certainty about, but you seem to be. It can’t be X. It can’t be Y.
If the data does not support Z, it can’t be Z. Here, I spared you the work:
http://www.leif.org/research/Global-Temp-TSI-Since-1600.png
Remember that ‘TSI’ here just means any and all of the solar indicators that all vary very much the same.
Given the state of the evidence, GCR and UV most certainly are possible mechanisms
For an effect that doesn’t exist. Any mechanism will work.
lsvalgaard says:
December 29, 2012 at 4:17 pm
===============
Scientific fraud, seems a bit harsh.
Open data, may reveal mistakes.
As we try to make sense of a nonsensical data stream.
We’re hard-wired that way.
– Is Dr. Svalgaard as the premier solar scientist aware of spectral composition of the geomagnetic Aa index?
– Of course he is.
http://www.vukcevic.talktalk.net/HC.htm
– Does Aa index show Hale Cycle component?
– Of course it does
– How and where is Aa index measured?
– The Aa index data have been derived by two antipodal sites, originally Greenwich and Melbourne but now their nearest replacements. The daily values are formed from an average of the 8 three-hourly values.
– Is there any similarity between Aa index and the Earth’s magnetic field spectra?
– Yes, for periods above 14 years, spectra are very similar and both have Hale cycle component.
– Why is Dr. Svalgaard denying that the Hale cycle is perceptible on the Earth’s surface?
– You have to ask Dr. Svalgaard.
lsvalgaard says:
December 29, 2012 at 3:58 pm
I am not ‘rewriting’ the historical data. The whole sunspot community [some 60 experts on this] are doing this…..Our efforts to re-calibrate the SSN have met with some resistance already, primarily from people with vested interest in the status-quo [are you one of those?]
>>>>>>>>>>>>>>>>>>>>>>>>>>>
I am a Quality Engineer/Chemist who has great respect for data. I have been fired more than once for refusing to change data as directed by my boss.
From the Climategate e-mails we have seen what lengths the ‘Climate Science Community’ will go to to protect ‘The Cause’. Jo Nova, E.M. Smith, Digging-in-the-Clay and Anthony have documented the activities of the ‘Climate Science Community’ with regards to temperature.
Then there is the CO2 measurements. Again we see what was done by the ‘Climate Science Community’ to the historic data when Callender and Keeling tossed any data points they did not like. link The fact that Dr. Jaworowski, a World Class scientist was denied funding and fired makes it clear those who dissent are punished.
Here at WUWT we have seen the ridiculous lengths ‘scientists’ and universities will go in the pursuit of grant funding including a contrived paper that equates skeptics with real loony-tunes and finally a guy with a degree in PHYSICS (yeah Parncutt) calling for a law making climate skepticism punishable by death.
Now you want me to believe there are SIXTY solar scientists out there who are not bit with the Skeptical Science Syndrone bug??? And it just so happens that the ‘adjustments’ to the historical data they are making iron the sun’s variability flat so the IPCC can then point to your data and say SEE it ain’t the sun.
Yeah right.
Hi Leif Svalgaard, two more questions:
1. You have been discussing these issues for a long time. See here, for example, from 2008:
http://climateaudit.org/2008/01/30/svalgaard-3/
“When it was believed that TSI was significantly lower and that the solar magnetic field [HMF] was near zero during the MM, it might have been a good bet to say that there is a causal link between MM and LIA. Now, that there is a strong possibility that TSI and the HMF were not at those lows, we can only still believe that MM caused LIA if we postulate either 1) unknown other causes and/or 2) extreme sensitivity of climate to solar activity.”
I think you have changed your mind about the solar magnetic field during the Maunder Minimum (MM), what was wrong with the previous assumption ?
2. If the sun is not considered to be a primary climate driver, what may have caused the warm periods during the last 9000 years. Is there anything at all (except the solar amplification mechanism) in the IPCC report that could explain those fast recoveries from several episodes of little ice age like temperatures ?
http://www.scinexx.de/redaktion/focus/bild6/stalagmit3g.jpg
Gail Combs says: December 29, 2012 at 2:25 pm
“..It also convinces me we need a very though house cleaning by withdrawing all grant money…”
I often face statements that I am arguing that “all the world’s climate scientists must be involved in a huge conspiracy”.
When in fact (as you pointed out elsewhere) with the magnificent vision of carbon trading before them, all governments and financial institutions immediately recognize an opportunity to do what they do best, make money out of other peoples’ money going past.
And they know (re scientific research) that they get that which they fund, and so they fund the ‘science’ they want to see.
No conspiracies needed. Supply and demand at work…. (money, in this case).
Science funding and research grants are still needed …. we just need to be careful it is not part of a system that automatically points everything in the one direction.
And I don’t have an answer on how we do that!
Leif, is there a particular reason that the data here http://www.leif.org/research/Ap-1844-now.png starts in 1844? Why would a linear trend (of zero) from such an early starting point have any relevance to recent temperature changes (i.e. the past 40 years or even the past 100)?
vukcevic says:
December 29, 2012 at 5:39 pm
– Does Aa index show Hale Cycle component?
– Of course it does
As I explain in section 9 of http://www.leif.org/research/suipr699.pdf and in secion 5 of http://www.leif.org/research/Semiannual-Comment.pdf
there is a very weak 22-yr cycle in geomagnetic activity [discovered by Ed Chernosky in 1966] and which is reasonably well understood.
Except it is not a Hale cycle component as the period goes from solar max to solar max [thus not in phase with the sunspot cycle]. The weak variation can be found in geomagnetic storms as well http://www.leif.org/research/Plus-Minus.Dst.png
What is wrong with your assertion is, that this is a primary or dominant cycle. It is not, it is a hard to discover 2nd-order effect.
You started out by postulating that the Earth was causing the different shapes of the cosmic ray variation, then when that didn’t work, then you claimed CMEs showed a 22-yr cycle [which I showed you it didn’t]. You really have no idea what is going on.
Gail Combs says:
December 29, 2012 at 5:44 pm
And it just so happens that the ‘adjustments’ to the historical data they are making iron the sun’s variability flat so the IPCC can then point to your data and say SEE it ain’t the sun.
It would help if you would actually read the papers on this. It is not hard. The problem starts in the 1940s when Waldmeier began to count larger spots more than once [up to five times dpending on size]. He even writes so specifically. The effect of that is a 20% increase of the sunspot number. When we noticed that a few years back, we began to ALSO count each spot only once as was done before 1945. Even the current observers on which the modern sunspots are based participated in the counting and we and they have conclusively shown that the double [or more] counting of spots contaminates the sunspot number making all number later than 1945 too large by 20%. The simplest way to correct for this known contamination is to increase all the old numbers by 20%. Even you could figure that out, if you took the trouble: http://www.leif.org/research/Reconstruction%20of%20Sunspot%20Number.pdf
or simply count the spots on today’s drawing: http://www.specola.ch/drawings/2012/loc-d20121229.JPG and compare with what the observer has for each gropu [given at the upper right]. Tell us here how many spots you count.
Yeah right.
Yes, RIGHT!
Manfred says:
December 29, 2012 at 6:50 pm
I think you have changed your mind about the solar magnetic field during the Maunder Minimum (MM), what was wrong with the previous assumption ?
I don’t think so.
2. If the sun is not considered to be a primary climate driver, what may have caused the warm periods during the last 9000 years. Is there anything at all (except the solar amplification mechanism) in the IPCC report that could explain those fast recoveries from several episodes of little ice age like temperatures ?
If the Sun can have those random fluctuations, then why can’t the Earth’s climate?
eric1skeptic says:
December 29, 2012 at 7:26 pm
Leif, is there a particular reason that the data here http://www.leif.org/research/Ap-1844-now.png starts in 1844?
That is when the data with hourly [or better] resolution starts [there are some for a few years before, but we have not been able to dig them up yet].
Why would a linear trend (of zero) from such an early starting point have any relevance to recent temperature changes (i.e. the past 40 years or even the past 100)?
If there is no trend over 170 years but there is a trend in climate, the argument that the sun is responsible weakens.
vukcevic says:
December 29, 2012 at 5:39 pm
– Does Aa index show Hale Cycle component?
– Of course it does
As I explain in section 9 of http://www.leif.org/research/suipr699.pdf and in section 5 of http://www.leif.org/research/Semiannual-Comment.pdf
there is a very weak 22-yr cycle in geomagnetic activity [discovered by Ed Chernosky in 1966] which is reasonably well understood.
Except it is not a Hale cycle component as the period goes from solar max to solar max [thus not in phase with the sunspot cycle]. This weak variation can be found in geomagnetic storms as well http://www.leif.org/research/Plus-Minus-Dst.png
What is wrong with your assertion is, that this is a primary or dominant cycle. It is not, it is a hard to discover 2nd-order effect.
You started out by postulating that the Earth was causing the different shapes of the cosmic ray variation, then when that didn’t work, you claimed CMEs showed a 22-yr cycle [which I showed you it didn’t]. You really have no idea what is going on.
We can argue about Earth all day.. but other planets of our Solar system are exhibiting signs of climate changes as well. Mars ice caps, Jupiter’s southern stripe ect ect ect.. The evidence is there for all to see but only for those who do not refuse to see it. There is research out for years on the effects of solar events on our sister planets but the entire its not the sun crowd refuses to acknowledge any of it because it is completely inconvenient of the other planets to cause discord in their perfect little theory. . Its a consensus science now, such a shame. Heres a thought though, if you have to change the data from the past to fit your present theory.. YOU SUCK.
lsvalgaard says:
December 29, 2012 at 8:42 pm
Manfred says:
December 29, 2012 at 6:50 pm
I think you have changed your mind about the solar magnetic field during the Maunder Minimum (MM), what was wrong with the previous assumption ?
I don’t think so.
——————————————-
You didn’t think the heliospheric magnetic field strength was “near zero” during the Maunder Minimum. So is this still your opinion ?. How would you define “near zero” and what are your expectations for the AP index in case of a new MM ? Thanks.
http://www.leif.org/research/Heliospheric%20Magnetic%20Field%201835-2010.pdf
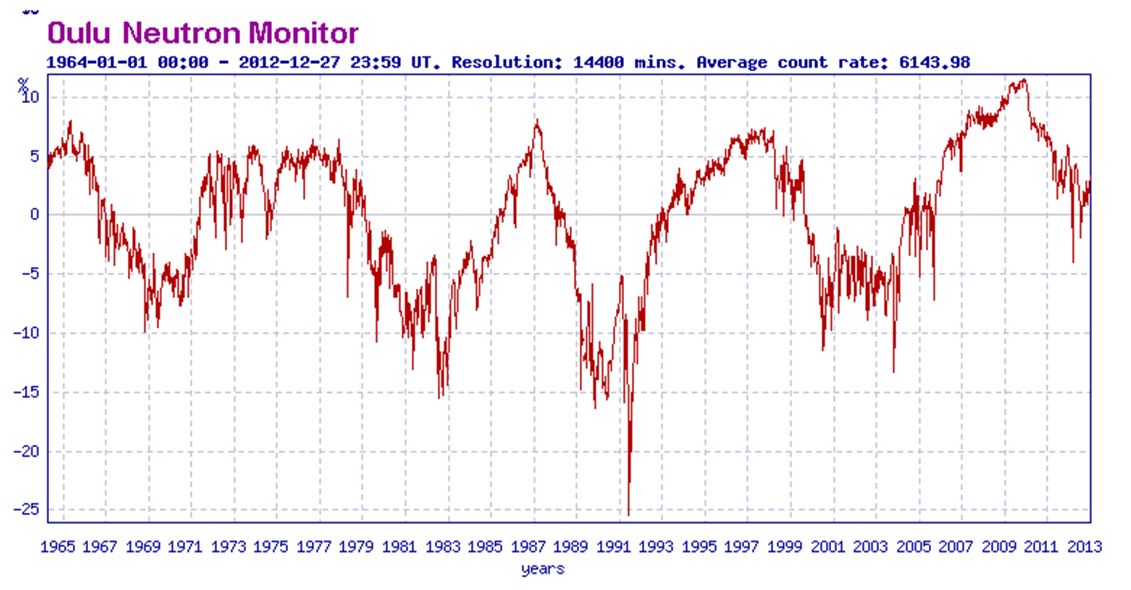
The one and only graph directly displayed in the article here is dishonest garbage of fudged data, on both false cosmic ray trends and on choosing the most heavily fudged temperature set around (Hansen’s). It is disappointing that a skeptic like Alec Rawls helps the CAGW propagandists in prominent visual presentation. Having passing comments in text, with buried links to other graphs not so prominently displayed, does not remotely make up for such, as maybe several percent at most of readers will click on them.
However, for anybody who wades through the sea of falsehoods and reads this who has not before (even though my deeply buried comment here will only lead a few, if any, to truth, for every hundred misled by the prominently displayed graph):
No sharp decline in solar deflection of cosmic rays started in the early 1980s, in contrast to the disgustingly false graph. On the contrary, solar cycle 22 (September 1986 to May 1996) averaged a neutron count rate of about 5992 as verifiable at [ref. 1] (link given at end of comment), which was essentially identical as an average to how the prior solar cycle 21 (June 1976 to September 1986) had an average neutron count rate of 5991 ([ref. 2]).
The big picture, including a major rise in solar activity for those cycles relative to weak solar cycle 20 (1964-1976) of the prior global cooling scare period, can be seen in http://s10.postimage.org/l9gokvp09/composite.jpg (click to enlarge).
Overall, the 20th century had much higher solar activity than the prior century, as may be particularly illustrated by using a metric exceptionally difficult to fudge into flatness: Shorter solar cycles tend to be more intense, and the average solar cycle length over 1901 to 1996 was 10.5 years, compared to the slower weaker cycles averaging 11.5 years each over the prior century from 1798 to 1901 ( ftp://ftp.ngdc.noaa.gov/STP/SOLAR_DATA/SUNSPOT_NUMBERS/docs/maxmin.new ).
Additional illustrations including cosmic ray trends versus clouds (including correlation with Forbush events) are in http://s13.postimage.org/ka0rmuwgn/gcrclouds.gif .
[ref. 1]
http://cosmicrays.oulu.fi/webform/query.cgi?startday=1&startmonth=09&startyear=1986&starttime=00%3A00&endday=1&endmonth=5&endyear=1996&endtime=23%3A30&resolution=Automatic+choice&picture=on
[ref. 2]
http://cosmicrays.oulu.fi/webform/query.cgi?startday=1&startmonth=06&startyear=1976&starttime=00%3A00&endday=1&endmonth=9&endyear=1986&endtime=23%3A30&resolution=Automatic+choice&picture=on
Dr. Svalgaard
– I wrote Hale cycle is a primary period in the Earth’s magnetic field.
-You wrote and implied that I said it is primary cycle in the Aa index, when you know I have not
There is a mismatch between of what you read and what you wrote, I even linked the graph showing exactly the relationship.
http://www.vukcevic.talktalk.net/HC.htm
you said: When you look at 100 years of data you find that there is no difference between even and odd cycles as far as the impact of CMEs is concerned
you said: but since it is not in the data you are committing scientific f… by claiming it is.
then after seeng above link you said: The weak variation can be found in geomagnetic storms as well
Hey, being accused of scientific misdeed (WUWT doesn’t like the f word) by someone changing data left, right and centre, it’s more sign of the weakness of your case. You first deny, than when confronted by the data, you haven’t managed to change as yet, you pull back a bit..
It is becoming not only tedious but a waste of time, when number of people have to point to you, that what they wrote and the interpretation you put on it, are very often two different things.
It appears that many other readers too, don’t take you your statements any more with full confidence, you once enjoyed, and that is really a pity.
The agenda that sun doesn’t affect climate, one way or the other, whatever the mechanism/s may be, is becoming less and less convincing.
I hate to say it, but this is the first GCR explanation I’ve really understood. Obviously if there is a lag (2.75 years – Lockwood) on solar effects, there must also be some lag on GCR. While there’s a slight statistical rise from 1991 to 2001, serious increase in GCR doesn’t start occurring until 2007. My thought is that even if the mechanism is not proven, the correlation between sunspots and temperature forcing is way too strong to be ignored.
The second prong of the agenda strategy to ignore solar forcing is the commonly reported mistake that the TSI was lowest in the second half of the 20th century, and that SC 23, being the lowest of the series did not immediately lead to cooling, thereby disproving that there is any solar effect on climate.
Leif writes “Except that the solar parameters that might influence the stratosphere have not shown any long-term trend the past 300 years. That is the key point.”
We only have a few years of SIM data Leif and that showed considerable variation. We simply dont know whether there is any trend in the variance or not. There’s not hiding from it, if the variation is real then its a potential game changer and could be the answer to “some solar influence” that the AR5 points at.
Meanwhile you categorically rule out the sun as a driver because of (lack of) TSI trends. I dont understand your reasoning. Or at least your certainty…
vukcevic says:
December 30, 2012 at 12:57 am
– I wrote Hale cycle is a primary period in the Earth’s magnetic field.
-You wrote and implied that I said it is primary cycle in the Aa index, when you know I have not
Here is what you wrote:
vukcevic says:
December 29, 2012 at 6:55 am
Climate’s Natural Variability is a direct consequence of the interaction between the Solar magnetic cycles and the geomagnetic input (backed by data from NOAA, SIDC and ETHZ).
– 21.3 years (Hale cycle) period is the primary component in the both solar and Earth magnetic variability
Now you are denying that the Aa index is related to solar magnetic cycles…
In a weak sense you are correct, as the weak 22-yr variation in the Aa index is a geometric effect related to the aspect of the Earth in the solar wind.
then after seeing above link you said: The weak variation can be found in geomagnetic storms as well
I said that back in 1978 and explained the physics that makes that happen. The plot was to show you how insignificant the 22-yr variation is.
It appears that many other readers too, don’t take you your statements any more with full confidence, you once enjoyed
Unlike you, I’m not fishing for approval.
pkatt says:
December 29, 2012 at 9:51 pm
Heres a thought though, if you have to change the data from the past to fit your present theory.. YOU SUCK.
Same comments as to Gail: take the trouble to look for yourself. Go count the spots on http://www.specola.ch/drawings/2012/loc-d20121229.JPG
Tell me how many you see. The official number is 20. If you don’t go and look and report here what you see, guess who sucks?
Manfred says:
December 30, 2012 at 12:41 am
You didn’t think the heliospheric magnetic field strength was “near zero” during the Maunder Minimum. So is this still your opinion ?. How would you define “near zero” and what are your expectations for the AP index in case of a new MM ?
I thought then and think now that the heliospheric magnetic field strength was about 4 nT [about the same as it was in 2009]. So for Ap, I would expect the same as for 2009: 4 [coincidence that it is 4 in both cases], for aa about 8 [aa is measured in nT, ap in units of 2 nT]. I consider those numbers good to about one unit, so can live with 3 nT. Since I don’t think the field was ‘near zero’, I don’t need to define ‘near zero’.
vukcevic says:
December 30, 2012 at 12:57 am
the data, you haven’t managed to change as yet
BTW, I have managed to changed the aa-index: it is now generally accept that aa is wrong before 1957 and must be corrected by adding 3 before that year, see Figures 13 and 14 of http://www.leif.org/research/2007JA012437.pdf
vukcevic (December 30, 2012 at 12:57 am) wrote:
“It is becoming not only tedious but a waste of time, when number of people have to point to you, that what they wrote and the interpretation you put on it, are very often two different things.
It appears that many other readers too, don’t take you your statements any more with full confidence, you once enjoyed, and that is really a pity.
The agenda that sun doesn’t affect climate, one way or the other, whatever the mechanism/s may be, is becoming less and less convincing.”
His credibility is toast vukcevic. Whatever he may know about the sun, he’s darkly ignorant &/or deceptive about the macroscopic properties of terrestrial atmospheric circulation and quantitative methods that reveal them. His dark solar-terrestrial-climate narrative is STRICTLY INADMISSIBLE in the blinding light of earth rotation observations that are well-constrained by the laws of large numbers and conservation of angular momentum. With this one severely egregious offense he has forfeited the moral authority to comment on climate at all. Additionally, the incessant protracted negative public harassment & authoritarian internet bullying raises deep, deep concerns about Stanford’s apparent lack of sensible ethical standards.
My tolerance of this man’s dark ignorance &/or deception has completely expired. I recommend that either he be banned from commenting on climate or that strong restrictions be placed on his insufferable behavior.
Sincerely,
Paul L. Vaughan, B.Sc., M.Sc.
TimTheToolMan says:
December 30, 2012 at 2:58 am
We only have a few years of SIM data Leif and that showed considerable variation. We simply dont know whether there is any trend in the variance or not. There’s not hiding from it, if the variation is real then its a potential game changer and could be the answer to “some solar influence” that the AR5 points at.
Whatever the measurements of SIM says, we have another monitor of UV, namely the Earth itself. UV creates the ionosphere. The day-night cycle results in an electric current about 110 km up. This current has a [small] magnetic effect which we can measure on the ground [was discovered in 1722 by George Graham]. We have kept track of that ever since and the result is that the UV radiation from the Sun [whatever its variability within a cycle is] does not have any long-term trend since then.
Meanwhile you categorically rule out the sun as a driver because of (lack of) TSI trends. I dont understand your reasoning. Or at least your certainty…
My reasoning [at least as far as SIM and UV are concerned] is as just described.
Paul Vaughan says:
December 30, 2012 at 3:42 am
My tolerance of this man’s dark ignorance &/or deception has completely expired. I recommend that either he be banned from commenting on climate or that strong restrictions be placed on his insufferable behavior.
I thought that expired a long time ago. And I feel how deeply inconvenient truths affect you.
Philip Bradley says:
December 28, 2012 at 2:03 pm
In the context of the analogy, alcohol does get stored in a ‘reservoir’ throughout the body and particularly in certain cell types. This is actually a very good example of a simile and your refusal to accept the simple description illustrates your own limited mental capacity to draw parallels and fill in the blanks.
Part 1: i.Alcohol is retained in the body in cells.
ii. It is hypothesized that an energy/heat reservoir is a mechanism that allows heat to be retained.
Part 2: i. An amount of alcohol intoxicates an individual and is above the threshold to produce intoxication by a margin (alcohol accumulates).
ii. The energy entering the system is higher than the energy the system can absorb as something other than heat which results in more heat.
Part 3: i. The alcohol decreases but is still above the amount which can be removed/detoxified by the body and is still increasing in the cells.
ii. The incoming energy is lower but is still higher than the energy the system can retain as anything other than heat which still results in increased heat.