Dana Nuccitelli's holiday trick for sobering up quick: put a little less rum in your egg nog

Photobucket

Guest post by Alec Rawls

When he argues that a reduction in forcing will cause cooling Dana Nuccitelli is not actually talking about drinking. He is talking about the solar forcing of global temperature, but the drinking analogy is a handy way to understand where his argument goes off the rails.

Mr. Nuccitelli, who blogs for the consensus-approved Skeptical Science website, was writing about Henrik Svensmark’s GCR-cloud theory of indirect solar forcing, where Galactic Cosmic Rays are hypothesized to seed cloud formation. If Svensmark is right then a strong solar wind, by deflecting some GCR from reaching the earth, in-effect blows some of the clouds away, letting more sunlight through to warm the planet’s surface.

That can’t possibly explain late 20th century warming says Nuccitelli, because GCR deflection has been estimated (see the Krivova-Solanki graph above) to have peaked by 1980. The raw data suggests the actual GCR minimum was ten years later, but set that aside. Nuccitelli thinks it is the change in the level of forcing, not the level of forcing, that determines whether the climate system warms or cools:

So, if GCRs really do amplify the solar influence on global temperatures, since 1980 they are amplifying a cooling effect.

Cooling begins when a forcing passes its peak? Fail. Daily temperatures don’t start falling at noon. They continue rising until mid-afternoon. The hottest time of the year isn’t the first day of summer (the summer solstice, after which the days start getting shorter), the hottest time is mid-summer. To think cooling should start when forcing passes its peak is like thinking you can sober up by drinking just a little more slowly.

Here’s a tip for Dana to keep in mind on New Year’s eve: it is the level of alcohol forcing that matters. If you are drinking alcohol faster than you body is excreting it (not exactly the way the earth excretes heat, but similar enough), then your blood alcohol is rising. You are getting drunker, even if you have lowered the rate of your drinking! That’s right, putting a little less rum in your egg nog will not sober you up! Your increasing inebriation will just be a little less rapid, and it is the same for solar forcing.

When the peak level of forcing appears in the rearview mirror, the downward trend in the forcing that begins at that point does not cause cooling. It just causes warming to be a little less rapid. Only when the energy pouring into the climate system falls to the level of the energy escaping back out does the system stop warming. Empirically, that turns out to be mid-afternoon, mid-summer, and approximately the first decade of the 21st century.

Three blind mice

Dana Nuccitelli produced one of three widely cited rebuttals to my suggestion that a new sentence that was added to the Second Order Draft of AR5, a sentence that admits strong evidence for some substantial mechanism of solar amplification, is a “game changer.” That admission is on page 7-43 of the SOD:

Many empirical relationships have been reported between GCR or cosmogenic isotope archives and some aspects of the climate system …  The forcing from changes in total solar irradiance alone does not seem to account for these observations, implying the existence of an amplifying mechanism such as the hypothesized GCR-cloud link.

That’s a game changer because the only solar forcing included in the IPCC computer models is the very slight variance in solar irradiance (also known as TSI, or “the solar constant”). If there are other solar forcings in play, working through variables that actually vary substantially as solar activity ramps up and down, that kills the report’s key finding (on page 8-4) that we can have “very high confidence that natural forcing is a small fraction of the anthropogenic forcing.”

The two most widely cited rebuttals, which I answered last week, were both by lead authors from the IPCC. Steven Sherwood, one of 15 lead authors of chapter 7, pretended that the admission of evidence for “an amplifying mechanism” was only about GCR-cloud. He then proceeded to claim that the evidence for GCR-cloud points to a weak mechanism, and used that as a grounds for dismissing the idea that any substantial solar forcing beyond TSI could be at work.

Doesn’t follow. The evidence for “an amplifying mechanism” (emphasis added) is entirely separate from the evidence for the GCR-cloud mechanism. The former is paleo evidence, where numerous studies of the geologic record have found strong correlations between solar activity and climate going back many thousands of years. The evidence for the GCR-cloud mechanism is from cloud-chamber experiments and ongoing observations of cloud micro-physics.

It doesn’t matter how unconvinced Sherwood is by the evidence for the GCR-cloud mechanism. That evidence does nothing to counter the paleo evidence, cited in the draft report, that some mechanism of enhanced solar forcing must be at work. By using his discontent with the GCR-cloud theory as an excuse to dismiss the paleo evidence, Sherwood is inverting the scientific method, and he is lying to the public about what the report says, making him a seriously bad guy.

Apparently weak minds think alike because Nuccitelli did the same thing Sherwood did, only a day earlier. Dana’s post only looks at the GCR-cloud mechanism and completely ignores the draft report’s admission of strong evidence for some mechanism of solar amplification. It is in the context of that more fundamental mistake that Nuccitelli goes on to completely misinterpret the evidence for the GCR-cloud mechanism itself, claiming that anything less than peak forcing causes cooling, arguing in-effect that he can sober up by drinking a little slower. Just tell that to the officer Dana. He won’t even need to give you a breathalyzer.

More evidence that weak minds think alike is the second semi-official rebuttal to my “game change” claim, issued by Joanna Haigh, a lead author of the IPCC’s third report. Haigh proceeds on the same dishonest pretence as Sherwood, telling NewScientist magazine that the new sentence in the draft report is only about GCR-cloud, which she then dismisses with the same drinking-game mistake that Dana makes, claiming that if climate were being driven by solar activity then the planet would have started cooling when solar activity was at its peak:

Haigh points out that the sun actually began dimming slightly in the mid-1980s, if we take an average over its 11-year cycle, so fewer GCRs should have been deflected from Earth and more Earth-cooling clouds should have formed. “If there were some way cosmic rays could be causing global climate change, it should have started getting colder after 1985.”

Sober up Joanna. Have a single shot instead of a double. Works every time.

Which theory has more trouble with flat 21st century temperatures?

It is amusing how Dana Nuccitelli, through sheer incompetence, was able to prefigure the highly credentialed malfeasance of both of these IPCC fraudsters. Still, Nuccitelli has to be credited with at least a bit of misfeasance of his own because he wasn’t satisfied with just assuring his gullible readers that cooling commences when forcing is at its peak. That only supplied an excuse for dismissing a solar explanation for late 20th century warming, leaving the conspicuous lack of 21st century warming still to be dealt with. Dana’s solution? Pretend that the flat 21st century temperature record militates against a solar driver of climate:

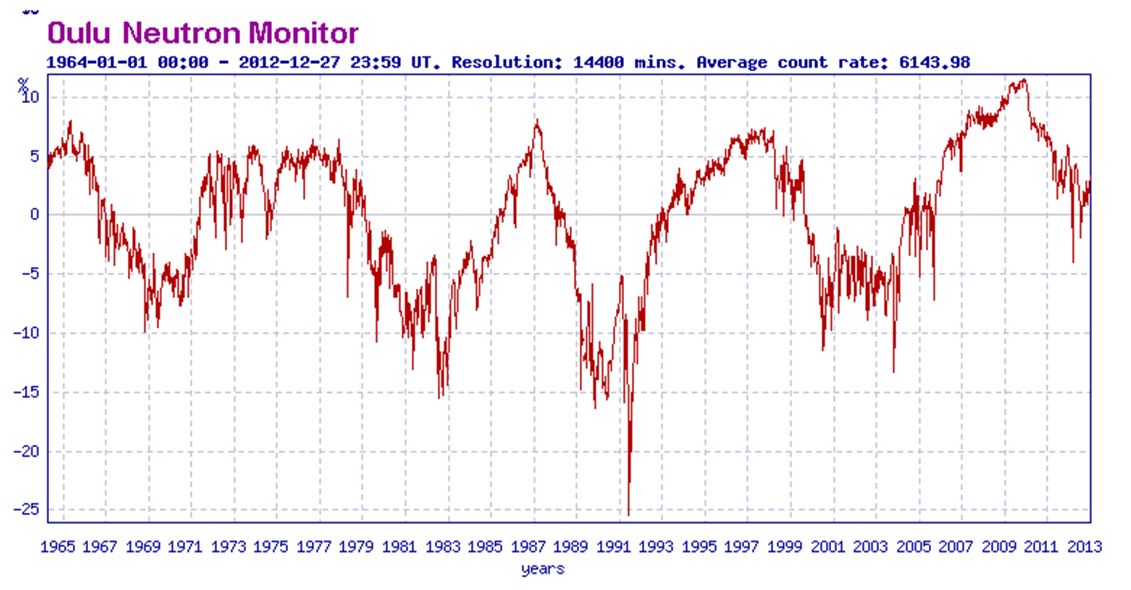
In fact, GCRs reaching Earth recently hit record high levels (Figure 4), yet temperatures are still way up.

Temperatures have merely flattened out, they haven’t gone down yet, and no Skeptical Science reader will ever learn that this is just what the discovered correlations between solar activity and climate predict. The strongest temperature response to a change in solar forcing is seen with a lag of about ten years (Usoskin et al. 2005), or one solar cycle (Solheim et al. 2012). The theory that is discomfited by flat 21st century temperatures is the CO2-warming theory, which predicts ever more rapidly increasing temperatures.

Dana might actually think that the flat 21st century temperature record causes trouble for the solar-warming theory but there is no way he can think it causes less trouble for the CO2-warming theory. For him to pretend that 21st century temperatures favor the CO2-warming theory is inexcusably dishonest, but as usual, the professionals are even worse. Note this little gem from the SOD (p. 7-44):

The lack of trend in the cosmic ray intensity over the last 50 years (Agee et al., 2012; McCracken and Beer, 2007) provides another strong argument against the hypothesis of a major contribution of cosmic rays to ongoing climate change.

That’s 15 IPCC lead authors all accepting the crackpot idea that you can only get drunk if your rate of drinking is going up. Steady exposure to the high 1950’s level of solar activity will keep you from warming, just as steady swilling of a high level of booze will keep you stone-cold sober. But where Dana only said that “temperatures are still way up” (implicitly acknowledging that they are no longer going up), the draft report here claims that temperatures are still going up (“ongoing climate change”).

Must be a Steven Sherwood sentence. He needs to look at page 10-3 of the SOD (emphasis added):

While the trend in global mean temperature since 1998 is not significantly different from zero, it is also consistent with natural variability superposed on the long-term anthropogenic warming trends projected by climate models.

Note that the “consistent with natural variability” part is a near call, after NOAA admitted in 2008 that 15 years of no warming would falsify current models. But yeah, let’s pretend it is the solar theory that has trouble with the lack of recent warming.

The Guardian, Andrew Sullivan, DeSmog, Romm etcetera, all pwned by Dana Nuccitelli’s error-filled AR5 post

The ensuing Skeptical Science newsletter bragged about how many eco-propagandists picked up on nutty Nuccitelli’s non-stop nonsense and the list is indeed impressive, a glaring testament to the total absence of due diligence on the part of these “journalists,” none of whom thought to question Dana’s advice on how to sober up quick. Here is the SkS tally of eco-scalps:

This was a very big week for SkS in the news.  Dana’s IPCC Draft Report Leaked, Shows Global Warming is NOT Due to the Sun was re-posted and/or linked to by The Guardian, New York Times Green, New York Times Dot Earth, Huffington Post, Climate Progress, Mother Jones, Climate Crocks, Carbon Brief, Grist, Daily Beast, DeSmogBlog, Graham Readfearn, Der Spiegel, Maribo, Learn from Nature, Alternative Energy in the 21st Century, and Motherboard.  It was also Tweeted by Michael Mann and Chris Mooney, among many others.

The only “consensus” journalist on this list who showed any integrity was Andrew Revkin, who had already written a post on my leak of the draft report. After updating that post with a link to Nuccitelli, Revkin updated again later with a link to the rebuttal that Jo Nova and I wrote about Seven Sherwood. Thanks Andrew, for being an actual journalist.

To put their “big week” in perspective the folks at Credulous Science reached high for sufficient words:

Winston Churchill once said: “A lie gets halfway around the world before the truth has a chance to get its pants on.” Not this time; we got the truth’s pants on in record time and nipped this myth in the bud before the contrarians were able to misinform the public.

The “truth” in their rendering is whatever patent falsehoods can be used to fool the ignorant into thinking they should fear CO2. No, nutty ones. You did not forge an exception to Churchill’s dictum. You provided a textbook example of it.

Dana is a poster child for those who feel a moral imperative to “believe the scientists”

For the last two years I have had a lot of fun exposing the large number of top climate scientists who claim that it is not the level of forcing that causes warming, but the trend in the forcing. They are all looking at the wrong derivative (one instead of zero).

Given the enormous pressure on the eco-left to accept what these government-funded climatologists are saying it is not surprising that someone like Dana Nuccitelli would swallow the idea that temperature really is driven by the trend in the forcing, and one super-wacky segment in Dana’s post indicates that he really is accepting that this is how physics works. If you leave a pot of water on a steady flame it won’t heat. If you want to heat the water you have to keep turning the flame up. The segment is titled, “Physical Reality Intrudes on Rawls”:

Rawls has argued to the contrary by claiming that the climate is still responding to the increase in solar activity from the early 20th century, and that GCRs are amplifying that solar warming from over 60 years ago.  This argument is simply physically wrong.  As Figure 2 illustrates, when solar activity rises, temperatures follow suit very soon thereafter.  In fact, during the mid-20th century, solar activity and global surface temperatures both flattened out.  Are we to believe that the planet suddenly began responding to the pre-1950 solar activity increase in 1975—2012, after not warming 1940—1975?  The argument makes no physical sense.

Obviously I never said that late 20th century warming was caused by solar activity from the early 20th century and Dana does not give a citation for what argument of mine he is referring to but its easy to figure out. I have argued many times that if one combines the strong paleo correlations between solar activity and climate with the fact that solar activity was at what Ilya Usoskin calls “grand maximum” levels from 1920 to 2000 then it is certainly plausible that much of 20th century warming, including late 20th century warming, could have been caused by the sun. 80 years of a high level of enhanced solar forcing just might warm the place up a bit (and it only did warm a bit, about 0.8 °C over the century).

If I am attributing late 20th century warming to the high solar activity that persisted through 2000, why does Dana think I am attributing it to solar forcings from 60 years earlier? He must be fixed on the idea that only a change in the level of solar forcing can cause warming. That’s what all of these top scientists have been telling everyone and there was no rise in solar activity after 1950, hence any solar-caused warming would have to stem from the pre-1950 rise in solar activity.

But come on Dana. That is not what I am saying. That is what they are saying, and I have been trying my darnedest to expose it as a blatant misrepresentation. I’m not attributing late 20th century warming to the pre-1950 rise in solar activity. I’m attributing it to the fact that solar activity remained at close to the same high 1950’s level until 2000 (or 2003). It is the level of the forcing that causes warming, not the trend in the forcing.

I have to feel bad for Dana on this point. It isn’t his fault. He has been systematically duped by this parade of so-called scientists all telling him that a persistent high level of forcing can’t cause continued warming. Makes me want to put him on a milk carton. The poor guy isn’t just lost, he was kidnapped. Want a piece of candy little boy? Credulous Science indeed.

0 0 votes
Article Rating
400 Comments
Oldest
Newest Most Voted
Inline Feedbacks
View all comments
Greg Goodknight
December 28, 2012 12:55 pm

It would be nice to see that chart extended to 2012.
The leaked AR5 draft retains the idiocy of GCR attributions for 20th century warming being improbable because of a lack of a trend… they don’t continue in lock step with the temperature. To that I’d mention the big pot of water on my stove heating up to cook pasta continues to get hotter with no change in forcing by the burner below. And eyeballing the GCR vs ocean temperatures over the phanerozoic in the graphs of Shaviv & Veizer’s “Celestial driver of phanerozoic climate?” (2003) leads be to believe the time lag in coming to a new steady state temperature for the Earth in a halving of GCR induced clouds is an even longer time period than boiling a couple gallons of water on my inadequate stove.

Resourceguy
December 28, 2012 12:58 pm

So this is how breakthroughs in science are accomplished. It is with debates over inclusion or exclusions of sentences and wording fights over emphasis. I can see we are going to need another Einstein to come forward and blow away this ether debate fog. It better happen soon because the money changer vultures are circling overhead and scheming in the back rooms with assumed names of their pets, etc.

H.R.
December 28, 2012 1:07 pm

Makes sense…. “I’ll drink to that.”
(No posts showing so according to the models, mine will be the 6th posting with that phrase. If I’m first, well of course that’s also consistent with the models.)

Richard M
December 28, 2012 1:10 pm

I doubt the warming is even .8°C. With UHI and questionable adjustments the real increase might be much less.

Harddoneby
December 28, 2012 1:10 pm

Immediate fail. The earth is not heating up so the graph is misleading to start off with.

Gary Pearse
December 28, 2012 1:21 pm

I’m with Greg Goodknight on this – extend the graph to 2012, but also remove the step risers that have been added to temp by GISS (and others) and then compare the plots.

Gary Pearse
December 28, 2012 1:22 pm

and change the global base temp from 15 back to 14 were it was before GISS inflated it in the late 1990s.

AndyG55
December 28, 2012 1:26 pm

They just keep on forgetting that the majority of so-called warming in the 80s,90s was mostly from data manipulation.. Oh well. They may figure it out eventually !!
I find it hilarious that they use data that they KNOW has been “adjusted” to the yazoo (because they did the adjusting), to actually try to prove some point. Very funny !!

AndyG55
December 28, 2012 1:27 pm

darn, while I was typing, 5 posts appear that say basically the same thing 😉

AndyG55
December 28, 2012 1:32 pm

Dana needs to go back to basic physics.
If the heat energy going in is greater than the heat energy coming out, the object warms up.
Eventually an equilibrium point is reached where the heat going in = heat going out
For something to cool down, heat energy in has to be < heat energy out.

Apoxonbothyourhouses
December 28, 2012 1:38 pm

Strewth. So well written Alec I understood most except the reference to the “milk carton”. When complex matters are written in terms we non specialists understand they are all the more effective. Big tick.

kalsel3294
December 28, 2012 1:40 pm

You have illustrated clearly how the blinkered crowd of regulars at Skeptical Science respond to independent thinkers who are capable of much broader and deeper understanding of a complex issue.
Dana Nuccitelli and the likes that inhabit that site always respond by grabbing something, anything, that readily comes to mind to rebut a new perspective that is well outside their very narrow grasp without even trying to consider how the new considerations might play a role in the wider world.
I don’t think any of them have ever exhibited an original thought, being sadly capable of only parroting what they have trained themselves to parrot.

Werner Brozek
December 28, 2012 1:58 pm

Greg Goodknight says:
December 28, 2012 at 12:55 pm
It would be nice to see that chart extended to 2012.
It IS extended to 2012! However what was done was that an 11 year average was taken which gives a completely wrong impression as to what is really happening. To see what I mean, see the graph below. One line is GISS from 1990 to the present. The other is the flat slope from May, 2001. The other is the GISS from 1990 with the 11 year average. So the first 5.5 years after 1990 and the last 5.5 years are cut off since you cannot get an 11 year average with only 2 years. See:
http://www.woodfortrees.org/plot/gistemp/from:1990/plot/gistemp/from:1990/mean:132/plot/gistemp/from:2001.33/trend

December 28, 2012 2:03 pm

GCRs and temperatures decoupled after 1980 because it appears GCR cloud seeding operates in conjunction with aerosols and anthropogenic aerosols fell sharply after 1980.
I’m sorry your drinking analogy fails on 2 counts.
1. Healthy adults metabolize/excrete alcohol at a constant rate. So if you continue drinking below this rate, you will indeed sober up.
The human body does not store alcohol in a large capacity store, like heat is stored in the oceans.

Werner Brozek
December 28, 2012 2:08 pm

If there are other solar forcings in play
Could they be influenced by the changes of the solar wind speed? See:
http://snag.gy/UtqpX.jpg
When the wind speed is low such as 1998 and 2010, we had El Ninos, but when the wind speed is high, such as 1989 and 2000, we had La Ninas.
(This is from the following at Dr. Spencer’s site: Ulric Lyons says:
December 14, 2012 at 4:14 PM
El Nino unforced? I don’t think so. Check for the big drops in solar wind speed in 1997 and 2009: http://snag.gy/UtqpX.jpg)

HarveyS
December 28, 2012 2:11 pm

Hi can I just add to this taken from today Daily Mail website, I know!!! Before anyone comments on it, but I thought it appropriate given this post.
Quote
"
Professor Freeman said a number of factors may have caused this,including changes in the Earth’s movement and changes in sea-surface temperatures.
‘The orbit of the Earth around the sun slowly changes with time,’ she said. ‘These changes were tied to the local climate at Olduvai Gorge through changes in the monsoon system in Africa.
‘Slight changes in the amount of sunshine changed the intensity of atmospheric circulation and the supply of water.
‘The rain patterns that drive the plant patterns follow this monsoon circulation. We found a correlation between changes in the environment and planetary movement.’
There was also a correlation between changes in the environment and sea-surface temperature in the tropics.
Professor Freeman said: ‘We find complementary forcing mechanisms: one is the way Earth orbits, and the other is variation in ocean temperatures surrounding Africa.’
The findings were recently published their results in the Proceedings of the National Academy of Sciences along with another paper on the same issue building on the findings.
The second paper shows that rainfall was greater when there were trees around and less when there was a grassland."
http://www.dailymail.co.uk/sciencetech/article-2254088/Rapid-climate-change-helped-humans-evolve-claims-new-study-Our-ancestors-adapt-quickly-changing-habitats.html#comments

michael sweet
December 28, 2012 2:11 pm

I noticed that in the linked post at Skeptical Science that Dana uses an 11 year average so his data goes up to the present. The graph at the top of this post only goes to 2003. A close examination of both graphs indicates that in the last ten years the GRC count has decreased. Several posters above have asked for the full data set. Why was the data here truncated? Can you update the graph so that it goes to the present like the one at Skeptical Science?

Richard M
December 28, 2012 2:12 pm

It’s good to see others mention the temperature problem. I do understand the desire to use the IPCC SOD as a base and attack the alarmists in their own home. However, when you try to match a theory to something that may be completely wrong it opens up another can of worms. You can end up in a catch 22 situation.
It really does put skeptics at a disadvantage.

Michael Jankowski
December 28, 2012 2:14 pm

Looks like a “divergence problem” Just cut the data off around 1990 and call it good!

December 28, 2012 2:24 pm

I’m very puzzled about Joanna Haigh’s contribution because she is already on record as acknowledging the potential significance of spectral variations:
http://www.nature.com/nature/journal/v467/n7316/full/nature09426.html
“our findings raise the possibility that the effects of solar variability on temperature throughout the atmosphere may be contrary to current expectations”

Werner Brozek
December 28, 2012 2:28 pm

I do not have the ability to do this, but could someone take the cosmic ray count and plot it on the same graph as the Hadcrut3 temperature? It seems to be that there is an inverse relationship. See 1900 and 1998 for example. The cosmic ray count dipped low but the temperatures spiked.

D Böehm
December 28, 2012 2:33 pm

Richard M says:
“It’s good to see others mention the temperature problem… It really does put skeptics at a disadvantage.
Not really. What puts Nuccitelli at a disadvantage is seeing what the planet is doing. That graph easily deconstructs all the wild-eyed hand waving by all the propagandists like Nuccitelli, in their attempt to convince us that War is Peace, Ignorance is Strength, and CO2 causes runaway global warming.
Who should we believe, Richard? Nuccitelli? Or Planet Earth? They can’t both be right. One of them is lying.

JW
December 28, 2012 2:41 pm

Phillip Bradley:: “Healthy adults metabolize/excrete alcohol at a constant rate. So if you continue drinking below this rate, you will indeed sober up.”
Did you notice this statement in the original post? “Only when the energy pouring into the climate system falls to the level of the energy escaping back out does the system stop warming.”
I think the analogy still applies.

D Böehm
December 28, 2012 2:53 pm

Werner Brozek,
Here are lots of charts showing the cosmic ray/temperature relationship.
Also, here is Vuk’s chart showing Arctic temperatures vs Solar:
http://www.vukcevic.talktalk.net/CO2-Arc.htm

December 28, 2012 2:53 pm

The GCR-cloud link is only one of the solar amplifying mechanisms in the scientific literature.
The IPCC conveniently fails to even mention amplification of solar effects via
-ocean oscillations, which have been shown in multiple studies to be driven by solar activity
http://hockeyschtick.blogspot.com/search?q=solar+ocean+oscillations
-global brightening following the ice age scare of the 1970’s, due to decreased aerosols/clouds noted in multiple studies around the globe
http://hockeyschtick.blogspot.com/search?q=solar
-effects on ozone production from large changes in solar UV within and between solar cycles, which has large secondary effects on surface temperature
http://hockeyschtick.blogspot.com/search?q=ozone&max-results=20&by-date=false
-forcing due to changes in length of day [LOD]
http://hockeyschtick.blogspot.com/search?q=length+of+day

DesertYote
December 28, 2012 2:55 pm

Philip Bradley
December 28, 2012 at 2:03 pm
####
I’m sorry your drinking analogy rebuttal fails on 2 counts.
1. The rate of elimination of alcohol is partially dependent on the concentration of alcohol.
2. The rate of elimination of alcohol is far less then even the rate of very moderate consumption.

December 28, 2012 2:56 pm

The Cosmic Ray versus temperature graph is as misleading as a Mann hockey stick as it has a tricky 11 year average. Why 11 years? Why not 10 years? Is that supposed to be a sun-cycle? It all gives a completely wrong impression as to what is really happening. Add to this that the he temperature line is based on a totally manipulated, augmented and corrupted data set fabricated to show continual warming where none exists. Reality is better represented at:
http://www.woodfortrees.org/plot/gistemp/from:1990/plot/gistemp/from:1990/mean:132/plot/gistemp/from:2001.33/trend
Trend is generally flat since 1998, and even flatter since 2005.

Green Sand
December 28, 2012 3:14 pm

Changes, always changes, why with regard to so called “global temperature” is average now more important than rate of change?
Is the defense coach in the ascendancy?

Coke
December 28, 2012 3:20 pm

Is it possible that the “divergence problem” associated with tree ring data is because they react to solar activity and not temperature? Perhaps Michael Mann would be interested in the graph that Alec Rawls provided.

DirkH
December 28, 2012 3:29 pm

Alec Rawls says:
December 28, 2012 at 3:24 pm
“Not all his fault though. The “milk carton” reference, for anyone who is too young to remember what was printed on the once prevalent cardboard milk cartons, throughout the 80′s it was always pictures of kidnapped children, which is probably why kids today mostly get shuttled around by their parents. ”
You had pictures of handcuffed, blindfolded children in trunks of cars on your milk cartons in America in the 80ies?
America can be weirder than Germany.

Kev-in-Uk
December 28, 2012 3:31 pm

I have said this before on other threads a few times, I’m fairly sure – but basically, the drinking analogy Alec uses is all about the time lag from change to effect. This is applicable to EVERY climatic cause and effect, from the OHC to the CO2 value, from the ‘midday’ sun to the midnight clear skies. Each and every one of these effects is not instantaneous. Is this not one of the reasons for TOD observation ‘adjustments’? etc, etc. And although it’s slightly OT – this is one of the reasons I still believe in solar forcing being the primary driver (note the term ‘driver’ is intentional) – because quite simply, a gnats hairs worth of increase (or decrease) in solar forcing over a period of years amounts to a sh&tload of energy. But this is also virtually impossible to detect amongst the inherent climate variability without intense measurement (and I mean something like a sensor within every sq kilometer of the earths surface – which we DONT HAVE!) and is even further difficult to detect if there is an inherent time lag delay in measurement some time after the cause actually happened. I tend to use the central heating analogy, because everyone knows how that works – basically it takes an hour or two for your house to heat up when switched on and an hour or two to cool when turned off – and this is for a very small volume/mass that comprises your house and furnishings! Contrast that to the lag effect on something many gazillions of times bigger and with a ‘thermal mass’ that is constantly ‘swapping’ heat between its constituent parts and it clearly becomes a somewhat futile exercise to try and pinpoint a ’cause’!
When you sit down and think about it like that – I still find it amazing that people want to quote a ‘global temperature’ at all!

DirkH
December 28, 2012 3:34 pm

OIC.

Werner Brozek
December 28, 2012 3:35 pm

D Böehm says:
December 28, 2012 at 2:53 pm
Thank you!
The inverse relationship between cosmic rays and temperature definitely seems to be strong, especially with the graph with the millions of years. However it is not perfect. But then again, we cannot expect any trend to be perfect since there are many variables controlling climate and not just one.

December 28, 2012 3:35 pm

I think we all agree that if cloud cover dropped 25%, surface temp would rise. However after a time the earth would reach a new higher stable temp, and stop rising. The arguement is about time required to approach this new temp. If the assumed time constant is a year or less, absolute temp would track cover – solar forcing. If the time constant is 100 years, at the decade scales we are looking at temp CHANGE would follow solar forcing. So as far as I can see one person is not clearly stating the time constant, and another is asumming a value that suits his purpose., . . .

Elftone
December 28, 2012 3:41 pm

Correct me if I’m wrong (and I’m positive someone will), but it seems that Dana Nuccitelli’s argument is based solely on lag rates. The central assumtion seems to be that Earth’s environmental system reacts quickly to changes. Inertia, “thermal” or otherwise, is discounted.
As with any assumption, that has to be tested. The null hypothesis would be that there *is* a lag. Prove there is, and Mr. Nuccitelli’s theory is disproved/falsified. Simple. No boiling water analogies needed, just physics.
As for his understanding of “basic physics”, well – like it or not – I believe he’s demonstrated a clear understanding of it, or he wouldn’t have attained a degree, master’s degree, or anything else (not sure if he has a PhD, so my apologies if he has attained that level). Stop attacking the person, and start working on the argument.

LazyTeenager
December 28, 2012 3:43 pm

Nuccitelli thinks it is the change in the level of forcing, not the level of forcing, that determines whether the climate system warms or cools:
So, if GCRs really do amplify the solar influence on global temperatures, since 1980 they are amplifying a cooling effect.
———–
Alec is mis-stating Dana’s position. Standard debating trick.
As for Alec’s delayed heating argument this makes sense depending on the heat capacities of parts of the system being heated. Since the heating effect of solar radiation on the top layers of the ocean is pretty much immediate and the time scale for the warm ocean heating the air above it is quite short all we need to know what that time scale is exactly.
I reckon the timescale for transferring heat from the ocean surface to the air is like days not years like Alec reckons. So where can I get an actual figure for the ocean to air transfer rate?

December 28, 2012 3:44 pm

The lack of trend in the cosmic ray intensity over the last 50 years (Agee et al., 2012; McCracken and Beer, 2007) provides another strong argument against the hypothesis of a major contribution of cosmic rays to ongoing climate change.
The lack of trend in the cosmic ray intensity over the last 300 years provides another strong argument against the hypothesis of a major contribution of cosmic rays to ongoing climate change…
I have argued many times that if one combines the strong paleo correlations between solar activity and climate with the fact that solar activity was at what Ilya Usoskin calls “grand maximum” levels from 1920 to 2000
There has been no modern grand maximum. Solar activity in the 18th and 19th centuries was just as grand. The ‘modern maximum’ is an artifact in the sunspot data series.

Bill Illis
December 28, 2012 4:08 pm

Nuccitelli produces the least objective / most distorted charts of anyone involved in the climate change debate. And that is saying something because there are many others out there doing their best to keep the followers believin’. Normally, one would be too embarassed to produce such nonsense but he seems to think it is okay if it is for the cause.
Just disregard anything produced at Skeptical Science and especially anything produced by Nuccitelli.

knr
December 28, 2012 4:20 pm

If Nuccitelli told me it was raining I would still go outside to check , such is the degree of ‘reliability ‘ of their claims . Frankly like their master at SS these wannabe ‘Team ‘ members and not worth the time of day if you actual want to deal in reality .

D Böehm
December 28, 2012 4:31 pm

Bill Illis says:
“Nuccitelli produces the least objective / most distorted charts of anyone involved in the climate change debate.”
From someone who constructs excellent charts, Nuccitelli should take that criticism seriously.
It is as easy to lie with charts as it is to lie with statistics. The standard deceptive trend charts use a zero [or an arbitrary temperature] baseline, when they should be using a trend line. They use a zero baseline chart because it fabricates a hockey stick-shaped warming trend. But the hockey stick shape is simply an artifact of a zero baseline chart.
In fact, the long term global warming trend has remained within well defined parameters for hundreds of years. Global warming has not accelerated. As a matter of fact, global warming has stalled for the past decade and a half, while CO2 has continued it’s rise. Draw your own conclusions.

Other_Andy
December 28, 2012 5:06 pm

@D Böehm
Slightly OT but what is the zero baseline various organisations use based on?
1. Is it the average temperature of all the data?
2. Is it the average temperature of a random period?
3. Is it completely random?
Why are there often no definitions-explanations of the baseline for the given graphs?

Ulric Lyons
December 28, 2012 5:07 pm

If GCR’s are forcing clouds, can we see this in cloud cover levels when GCR’s were at their highest through 1995-97 and 2007-09?
http://i191.photobucket.com/albums/z36/AlecRawls/Environment%20and%20climate/NeutronCount_Oulu_1964-2012_large_zps7997e229.png
http://climate4you.com/images/CloudCoverAllLevel%20AndWaterColumnSince1983.gif

December 28, 2012 5:11 pm

DesertYote says:
December 28, 2012 at 2:55 pm
I’m sorry your drinking analogy rebuttal fails on 2 counts.
1. The rate of elimination of alcohol is partially dependent on the concentration of alcohol.
2. The rate of elimination of alcohol is far less then even the rate of very moderate consumption.

Point 1 is only true for the 5% not metabolized by the liver.
If point 2 were true (it isn’t), a couple of hundred years ago when most people in Europe drank weak beer rather than water, everyone would have died of alcohol poisoning or at least been falling down drunk all the time, and we know they weren’t.

Camburn
December 28, 2012 5:17 pm

What we may know and what we may not know.
1. Dr. Svalgaard has stated numerous times that TSI has been constant for the past 300 years.
2. With TSI being flat, we have had two occurrences in climate of note.
a. We left the LIA period
b. There was an accelerated warming in the early 20th Century that no one has a clue as to why it happened.
1. WE know the warming of the early 20th Century was not CO2 induced. No matter what metric one uses as far as concentrations, there was not enough of a deviation to force any type of temperature increase. We also know that the temps of the Arctic Area were very similar to today’s temperatures from physical measurements.
2. We know from Proxy data, (Greenland, Sargasso Sea, Antarctica) that there was a world wide Medieval Warm Period. No one knows why with any degree of confidence why this happened.
3. We know there is a solar connection and large river basin drainage flows. From the Nile, The Amazon, the Mississippi that solar connection has been well established.
4. We know , from a chemical basis, that UV and Ozone in the Stratosphere have climatic effects via Jet Stream location and the perennial blocking highs such as the Greenland High placement.
Since no one can explain with any certainty why some of the climatic changes occurred in the past, we keep investigating to find the cause.
Certain items come to mind.
1. There has been no statistical warming for the past 16 years. This is well known. This is not cherry picking, as the parameters of the past 16 present this fact very clearly.
2. We know the ocean heat content, via ARGO, is not showing an accumulation of heat. In fact, it may have a negative bias, but statistically it is flat at this time.
3. We know that we are in a Modoki type of ENSO pattern.
http://www.agu.org/pubs/crossref/2007/2006JC003798.shtml
4. We know from established satellite data, that the earths atmosphere is much clearer to incoming solar. The trend from less clear to clear changed in 1994 and has resulted in 5% less particulates in the atmosphere.
From this knowledge base, we learn that we know that CO2 is a minor driver of climate, if in fact it is a driver at all. Past Geological studies concerning CO2 and the end of interglacials, show that temperature cools and CO2 continues to rise for 800 years or longer.
Conclusion:
We don’t know nearly enough about climate and the drivers, short and long term, to make any type of decision concerning remedial action.
Mr. Nuccitelli is doing the best that he can with what he has…..which in all honesty…..isn’t much.
The certainty of the Science of Climate, as presented by Mr. Nuticelli
, reminds me of Dr. Alfred Wegener and his fight over plate tectonics. The consensus was that he was a lunatic, which we all know for a fact that he wasn’t. Mr. Nuccitelli represents the consensus at this time, and they are just flat out wrong.
.

DaveA
December 28, 2012 5:21 pm

On ya’ bike Dana.

Camburn
December 28, 2012 5:30 pm

Concering WG1 Report 5 IPCC
There has been debate concerning the accuracy of models verses observed temp metrics.
Some of the debate has used http://iopscience.iop.org/1748-9326/6/4/044022 (Grant Foster1 and Stefan Rahmstorf 2012) as a basis to show that the models projections and the temperature are really in concert.
However, this is like comparing apples to oranges…..or maybe even a lime.
Foster/Rahmstorf 2012 remove short term (potentially long term) climate drivers to achieve a continued increase in temperature.
The models, themselves, do NOT include these drivers, such as ENSO, because they just can’t predict when and to what extent, these will happen.
The reality is that temps have been flat for 16 years, the models are over 2 sigma removed from reality…..and no one knows why……..or do they?
There are forces at play that are not recognized, and for certain, not understood in regards to climate.
Can the sun be one of the misunderstood players? Evidence most certainly would indicate that it is.

Katio1505
December 28, 2012 5:34 pm

Svensmark proposes that it is only the high energy cosmic rays that cause the cloud seeding. What energy range is used in the graph derived from Krivova and Solanki in the above figure?

D Böehm
December 28, 2012 5:39 pm

Other_Andy,
Different organizations use different baselines. Some use zero, or tenths of a degree, both indicating an anomaly chart, and some use a specific temperature line, such as 14ºC. The point is that if you are showing a trend, you should use a trend line chart. That eliminates the [alarming, but non-existent] hockey stick shape.
Here [note the long term, declining green trend line], and here, and here [0.35ºC rise per century, with no acceleration] are examples of trend line charts. You can see that the long term global warming trend remains unchanged since the end of the LIA. There is no recent acceleration of global warming, despite the fact that CO2 has risen ≈40%. In fact, global warming has stalled for the time being; maybe temporarily, maybe permanently. But despite rising CO2, global warming has stopped.
You ask why there are no explanations with many of the charts. I believe the reason is that it is intended to show a scary rise in temperature — a hockey stick — rather than to inform. All U.S. government agencies [NOAA, GISS, USHCN, etc.] use zero baseline charts when showing the long term natural global warming trend. They know exactly what they are doing, and why. Their budgets would be impacted if they told the truth: that there is no measurable, testable scientific evidence proving that human CO2 emissions cause global warming. So they bury the truth with fictitious charts that show rapid, but non-existent, global warming.

Arno Arrak
December 28, 2012 5:46 pm

Before you start talking about temperature try to get a temperature chart that shows what actually happens to it. An 11-year averaged temperature chart is worthless because it hides important aspects of the real temperature curve. The El Ninos and La Ninas are homogenized when they are actual parts of the temperature curve and not something to be hidden. The entire instrumental temperature curve is a concatenation of alternating El Nino peaks and La Nina valleys, interrupted from time to time by oceanic irregularities, such as the super El Nino of 1998 and the twenty-first century high, or by rapid starts of warming and cooling as happened in the early twentieth century. These are breakpoints where physical changes occurred and they must not
be eliminated by computer processing. The worst part of that NASA curve is that it totally erases the true temperature of the satellite era. I don’t feel like explaining it all but from 1979 to 1997 the global mean temperature was constant. There were five El Nino peaks in that interval, and the middle one, the 1988 El Nino, is the one that Hansen called global warming peak in 1988. Six months later a La Nina dropped global temperature by 0.4 degrees Celsius. What he is now doing is showing that entire period as a smooth temperature rise called “late twentieth century warming.” it is a complete fake. Read my book and find out more.

Rosco
December 28, 2012 5:47 pm

Why wouldn’t continued input of solar energy at the same level be capable of raising temperatures on Earth ?
The only way a steady input of solar radiation is NOT capable of raising temperatures on Earth is if the Earth is at it’s blackbody maximum temperature for the insolation – just like letting the water heat on the gas till it boils without continually increasing the gas.
Of course, Dana Nuccitelli and his fellow nut jobs think this is waht they calculate when they falsely believe it is OK to hypothesise the Earth is flat with the Sun shining 24 hours a day at one quarter power – a simple hypothesis easily demonstrated as wrong by observing the Moon.
The minus 18 degrees C Earth radiating temperature is completely different to the heating under the noonday sun on a clear day at almost all latitudes on Earth from 75 N to 75 S.
The real blackbody temperature the solar radiation is capable of causing is never achieved on Earth because of water evaporating and the atmosphere convecting.
These simpletons continue to cling to their mistaken belief they have not made a simple fundamental error.
What is really funny though is one of SKS’s explanations about backradiation – they now claim it is the Sun that heats the Earth when trying to defend “backradiation” – of course conveniently forgetting that in all their other arguments they claim the Sun can’t be responsible.
What a joke SKS is, what a joke academia is becoming !

December 28, 2012 6:20 pm

GCR are un correlated with cloud cover. Any one of you can go get hourly data from CRN stations, and GCR data and see that for yourselves. No need to use a temperature record you dont trust, use CRN which Anthony endorses. No correlation. Zip, nada. And the argument about lags in temp is utterly beside the point. Just look for a correlation between GCR and cloud cover.
easy peasy. You wont find one.

Bart D
December 28, 2012 6:24 pm

@ Gary Pearse
I think you meant to say they should raise historical global avg temp back to 15c from current 14c they started using sometime in late 1998. I believe current “accepted” avg temp is something like 14.63c. Nice trick lower the avg temp and get global warming. But no they say it’s the trend that’s important. With a little more warming we’ll be back to normal.

Camburn
December 28, 2012 6:25 pm

Steven:
I agree 100%….don’t think it is there. That does NOT preclude another forcing that is not recognized.
WE know that the temperature has varied…..we have to figure out why. We sure as heck don’t know now.

Camburn
December 28, 2012 6:30 pm

The whole premise of what the models are based on needs to be examined.
“Near-zero and even negative trends are common for intervals of a decade or less in the simulations, due to the model’s internal climate variability. The simulations rule out (at the 95% level) zero trends for intervals of 15 yr or more, suggesting that an observed absence of warming of this duration is needed to create a discrepancy with the expected present-day warming rate.”
http://www1.ncdc.noaa.gov/pub/data/cmb/bams-sotc/climate-assessment-2008-lo-rez.pdf

December 28, 2012 6:40 pm

Katio1505 says:
December 28, 2012 at 5:34 pm
Svensmark proposes that it is only the high energy cosmic rays that cause the cloud seeding. What energy range is used in the graph derived from Krivova and Solanki in the above figure?
The neutron monitor data [and the 10Be production] is mostly around 2 GeV. The GCRs that Svensmark talk about are more energetic than 10 GeV [which are only very weakly modulated by solar activity]. Some stations [e.g. Oulu] show an increase in low and medium energy GCRs which are not effective [most stations do not]. In addition, some stations [e.g. Oulu] have changed their geomagnetic latitude in such a way as to record more GCRs [Oulu is just near the edge of the polar region where the geomagnetic cutoff ends]. In any event all these changes are tiny.

Bill Illis
December 28, 2012 6:48 pm

As Mosher says above, the (non-existent) cloud cover datasets don’t match the CGR data.
On the other hand, it would be nice if we has an actual cloud cover dataset. There is only fake climate model data and Hansen’s ISCCP data which noone believes.

ggoodknight
December 28, 2012 6:51 pm

Steve Mosher, GCR are very well correlated with ocean temps over geologic time. something like a 5C (memory failing me) range of equatorial ocean temps from min to max by Jan Veizer’s oxygen isotope proxies. And then there’s the Svensmark paper finding a nice swing of 7% of the amount of water in low level clouds over the oceans in the wake of strong Forbush decreases, just six days after the event.
There is an undeniable link.

Scute
December 28, 2012 7:01 pm

What follows is complicated. My apologies for that but spin is only as complicated in its unraveling as it was in its raveling.
I followed the whole AR5 WG2 leak and backlash story quite closely. There was so much spin in Dana’s SkS post and in the comments there that I was stunned into inaction- I didn’t know where to start tackling this avalanche of absurdities. Some issues like the graphs have been raised here. I do regret not doing anything until now because there was one glaring problem with Dana’s reading of Rawls, or rather his lack of rigor in doing Rawls the courtesy of reading through all the evidence he was presenting. I haven’t seen this point made anywhere in the blogs or the media:
The evidence presented to support Rawls’ concerns about AR5 chapter 7 came from the original WUWT post announcing the leak. And not just the post itself but, crucially, the links embedded therein.  I read that original post and considered it a responsibility to myself, without a readership of millions, to click the links in turn, getting the fullest picture possible of what Alec was saying. The most pertinent link in that post was highlighted “omitted variable fraud”. By not reading this link (or choosing not to cite the killer argument in it) Dana set in train a media frenzy that compounded one misunderstanding after another. His take was in turn pounced upon by one of the chapter 7 authors, Sherwood, as a way out of a tight fix. Sherwood surely must have suspected that Alec Rawls was saying more than Dana was letting on. Either that or Sherwood had actually read the cogent arguments of Rawls’ “omitted variable fraud” link and declined to disabuse all those reporters of their simplistic take on the issue.
This traduced Rawls’ real concerns behind the newly added sentence in AR5: the sentence was only the last straw, the admission that there must be some mechanism over and above the TSI affecting solar forcing. But if we look at this admission in the light of the undressing that Rawls gives the chapter 7 authors in the crucial link, (see capitalised heading below for details) we are in fact marrying that admission to their bald acknowledgments that there are papers pointing to the existence of a strong GCR/Climate correlation. Papers that are good enough to be cited in AR5 by apparently widely respected climatologists are good enough to be presented with the full import of all salient information they contain including an acknowledgment of the quality of the strong correlations they discovered. This was not done. Instead they cast over the GCR/cloud mechanism setting it up as the straw man to discredit these papers further and, because this was a wholly tangential argument, the credibilty of the three papers remains fully intact. This is why the admission in the newly added sentence (in AR5 WG2) is such a game-changer: it is an admission of a strong, yes strong, correlation between GCR and climate, the exact mechanism of which has not yet been established.
Any of the arguments we heard from Sherwood or Dana accusing Rawls of not reading to the end of the paragraph 4.3 which clearly states that they believe the additional solar forcing is insignificant, has to be viewed in the light of the above. Of course, they can reiterate it as much as they like, but it will only be believed if Sherwood can base it on a sound basis of evidence-based argument. Right now it is not, but what remains is his admission of the “existence of an amplifying mechanism” along with three papers cited by him (also an admission by their inclusion) showing a significant correlation between this amplification he admits to, and climate change. That is why Alec Rawls point is intellectually sound: two assertions, in fact two admissions by the chapter 7 authors that dovetail perfectly were crudely de-coupled by a straw man. When the straw man is banished, the two dovetailed admissions remain and they come from the pen of Sherwood and co.
It’s true that some of these points were bandied about over the course of the controversy but nowhere was it laid out as clearly and fully, all in one place, as in the “omitted variable fraud” link.
THE OMITTED VARIABLE FRAUD LINK IN MORE DETAIL
The “omitted variable fraud” link took me to a previous WUWT post by Rawls from February 2012. This post shadowed all the issues in the December leak post apart from one thing- he was referring to the Working Group 1 (WG1) draft copy whereas the December post was referring to the WG2 draft. The only difference between the two was the addition of the much-cited sentence that referred to data “implying the existence of an amplifying mechanism” in the later draft. In his February post, Rawls already appeared to be on the brink of leaking even the WG1 judging by his rightful indignation at the contents. But he wasn’t complaining about the new sentence because it wasn’t there yet. He was concerned that the authors of Chapter 7 were cleverly setting a gameplay whereby they acknowledged the existence of three papers showing “many empirical relationships” between GCR and climate and then, by sleight of hand, trashing them with a spurious tangential argument about the inconclusive results on GCR cloud seeding. This tangential argument was a straw man, set up to shoot down the validity of the three papers despite 1) the fact that they were primarily presenting “empirical relationships”, not hard-and-fast mechanisms 2) by extension they were not concerned with GCR alone 3) the fact that, despite showing only correlations, those correlations were very strong. Crucially, Rawls included quotes from the three papers showing the strength of the correlations. (He also described why this was “omitted variable fraud”- if you eliminate one culprit of GW you can attribute all the warming to your pet culprit, AGW. GCR was an omitted variable and omitted fraudulently).
Although Rawls touches on the three papers in his December post, he does not go into the detail of the February post on this one narrow topic. It is only by reading the February post (by following the “variable fraud” link) that the true subtlety of the AR5 chapter 7 authors’ sleight of hand is revealed. (I tried to capture it in essence above but it doesn’t do it any justice) In fact, as you continue reading the December post after reading the February post it is clear that Rawls is assuming you are up to speed on the issues regarding the February post. You can see him glossing, just a little, over this crucial aspect- and understandably because it isn’t glossing if his readers are up to speed with the facts that he directed them to only just a minute ago.
In conclusion, if Dana and, by extension, a bevy of international media outlets cannot be bothered to read through all the evidence presented to support somebody’s actions and arguments, they should publish precisely nothing. Either that, or publish the bare facts that a leak has been made and by who, along with a link to that person’s full explanation.
Scute

DesertYote
December 28, 2012 7:06 pm

Philip Bradley
December 28, 2012 at 5:11 pm
###
Typical leftie conflation of unrelated things.
You did it twice. You conflated drinking of watered wine or beer at dinner with social drinking. Then you conflated a continuing raise in BAC with alcoholic stupor. Those Europeans (and Americans, the colonists were beer drinkers also) drinking throughout the day were getting drunker as they drank, just not very fast. Another point is that the lack of display of the typical signs of drunkenness is not a good indication that a person is not drunk. When I was still an alcoholic, I could ( and had) passed a police roadside sobriety check while being quite toasted. Some people have a very high tolerance to alcohol.
It takes a bit over an hour to eliminate the alcohol from one glass of beer, once it is in the system. It takes about a half hour for alcohol to get into the system. This is under optimum conditions. So my contention still stands, that a person drinking socially, even moderately will be getting drunker as the night wears on. Note that the initial point was in the context of social drinking.

Policy Guy
December 28, 2012 7:12 pm

Thank you again for your insight and your willingness to spend any time at SS and to respond as you have to certain critics of your thinking.
Tonight, for the first time, I visited SS. I was appalled. I expected a Public Relations Spin site and instead I found a Propaganda Machine (aptly named SS) specifically designed to find the best misleading alarmist argument possible to refute any logic employed anyone holding a challenging viewpoint about the models and their results. Talk about turning science on its head.
This site in its entirety seems focused on crushing and humiliating anyone with a challenge to their “science”. Science is based on skepticism. This site impales that and attempts to turn “Science” around to crush contrary thinking about a predetermined outcome.
What nerve these folk have to refer to themselves as “Scientists”.

D Böehm
December 28, 2012 7:27 pm

Policy Guy,
Now you can see why Anthony puts SkS in it’s own “Unreliable” category. I would have been less charitable, categorizing them as “Deceptive Propagandists”.
Try posting some verifiable scientific facts there. Be as reasonable and polite as possible. But if your comment questions their catastrophic AGW narrative, it will never see the light of day.
It is a given that any blog that deletes wholesale all scientific views contrary to it’s narrative is being dishonest. SkS constantly deletes — or worse, mendaciously changes the meaning of — skeptics’ comments. SkS is run by pathological liars, and I include Nuccitelli along with Cook. The truth is not in them.

December 28, 2012 7:39 pm

While skimming down through the comments, speed-reading to get a gist of what the many views were covering, (which is, in terms of scope, wonderful and amazing,) I skimmed through one comment and thought to myself, “that sounds like Leif Svalgaard.” So I put on the brakes and checked back to see the name, and sure enough it was he.
Leif, for a man who is excellent, when it comes to the narrow range of your expertise, you seem unaware of worlds outside your canyon.

William
December 28, 2012 7:45 pm

The majority of the 20th century warming has caused by solar modulation of planetary cloud cover. Note however that there is three rather than one mechanism by which solar magnetic cycle changes modulate planetary cloud cover. I am currently investigating the physics and cosmological implications of the third mechanism and have found an extensive set of astronomical papers to support its existence and to define the mechanism.
if and when there is unexplained planetary cooling, I will have an in depth explanation of the third mechanism and can explain in detail what to expect next. There is a fourth mechanism.
The solar magnetic cycle affects cloud cover by three mechanisms 1) Changes to the solar heliosphere changes the number of Galactic Cosmic Rays (GCR) and the energy content of the GCR that strike the earth’s atmosphere and 2) Electroscavenging where solar wind bursts remove cloud forming ions. The following is a summary. See this paper by Brian Tinsley and Fangqun Yu “Atmospheric Ionization and Clouds as Links Between Solar Activity and Climate” for details, 3) abrupt changes to solar magnetic cycle which creates an imbalance of charge, the earth and other planets in the solar cycle attempt to reach equilibrium with the sun which results in an increase in volcanic activity and atmospheric activity (see massive new atmospheric spot, Saturn for example). (The third process also removes cloud forming ions from the atmosphere.)
(See Tinsley and Yu’s review paper for a review of the first two mechanisms.)
http://www.utdallas.edu/physics/pdf/Atmos_060302.pdf
General
The net effect of planetary clouds (all levels) is a reflection into space of 27.7 W/m2 (i.e. Clouds cool the planet by 27.7 W/m2.) [Hartmann, 1993] A mechanism that increases or decreases the total amount of planetary cloud cover will change the planet’s temperature.
Cloud Modulation by GCR
Microscope cloud nuclei are created by the electrons that are produced when the GCR strike the upper atmosphere. (GCR create muons. The muons reach lower levels in the atmosphere and create free electrons.) Svensmark has confirmed the processes in a lab test. Two additional tests are planned. One in a deep under ground mine, to test the process in the absence of natural muons and the second with CERN, where CERN will be used to create a known modulated artificial GCR source.
GCR Modulation by Solar Heliosphere
Pieces of magnetic flux from the sun are carried out into the solar heliosphere. The solar heliosphere stretches out about 20 light hours (near the orbit of Uranus.) The pieces of magnetic flux deflect GCR so that deflected GCR does not strike the earth. As the solar cycle progresses there is an observed change in the amount of Galactic Cosmic Ray (GCR) particles that strike the earth. Tracking the change in the number of GCR is a change in total planetary cloud cover. This is shown by satellite data in Palle’s paper and also in Tinsley and Yu’s paper (figure 2.1.).
Electroscavenging
High speed solar winds that are created by coronal holes (for example) remove cloud forming ions by the process of electroscavenging. The high speed solar wind creates a space charge in the earth’s ionosphere. The charge differential in the ionosphere creates a potential difference between the ionosphere and the lower atmosphere which removes cloud forming ions, from the lower atmosphere. (See figure 3.1 and figure 5.3 in Tinsley and Yu’s paper.) The ionosphere space charge is latitude specific (see figure 5.3.) Palle’s satellite analysis shows a significant reduction in clouds at the latitudes, as predicted by Tinsley and Yu.
The planetary cloud cover closely tracks GCR through two solar cycles. Around 1999 there is a gradual reduction in the earth’s total cloud cover and a reduction in the earth’s albedo based on the earthshine albedo data and satellite data. This reduction in cloud cover occurs when there is an increase in solar wind bursts due to coronal holes moving to the solar equator at the end of the solar cycle.
As noted in Enric Palle’s paper there is close correlation of GCR and planetary cloud cover for the period 1983 to 1994. Post 1994 the second mechanism electroscavenging removes cloud forming ions, therefore even though GCR is high there is no increase or reduction in clouds for the period. The third mechanism also removes cloud forming ions and due to the abrupt slow down in the solar magnetic cycle. The third mechanism is interesting as it fundamental to the explanation of a host of cosmological anomalies and paradoxes related to quasar and spiral galaxy formation and evolution with redshift. The same mechanism explains the peculiar axial ejection of blue stragglers and the equatorial ejection of blue stragglers from the Milky Way. The same mechanism explains the evolution of bulgeless spiral disc galaxies and the formation of bars in spiral disc galaxies. The same mechanism explains why quasar periodic variance doe not exhibit time dilation with redshift, why quasar spectrum does not exhibit evolution of metallicity with redshift, explains why there is an unexplained gradual reduction of maximum quasar luminosity with redshift and so on. The basic mechanism is due to what happens when very, very, large objects collapse.
http://www.solen.info/solar/images/comparison_recent_cycles.png
http://solar.njit.edu/preprints/palle1264.pdf
The correlation between annual mean low cloud and the ionization level at 2 km altitude exceeds the 99% significance level over mid-latitude oceans and globally over the period 1983–1994.
The second process, considered by Tinsley and Yu (2003), namely electroscavenging, depends on the action of the global electrical circuit (see review by Rycroft et al. (2000)). The transport of charge by rapidly rising convective currents in the tropics and over continental land masses leads to a _200 kV positive charge of the ionosphere compared to Earth. This large voltage difference, in turn, necessitates a return current which must pass through the regions of the atmosphere where clouds are formed. As cosmic rays are the principal agent of ionization in the atmosphere above 1 km altitude, any modulation of the GCR flux due to solar activity is likely to affect the transport of charge to complete the global electrical circuit. Tinsley and Yu (2003) discuss how the build up of electrostatic charge at the tops and bottoms of clouds could affect the scavenging of ice forming nuclei (IFN) and cloud condensation nuclei (CCN) by droplets, and how this can lead to greater rates of precipitation and a reduction in cloud cover. They find that the electroscavenging process is likely to be more important over oceanic rather than continental regions and that it leads to a positive correlation between clouds and cosmic rays at higher latitudes and a negative correlation at low latitudes. Thus the electroscavenging process can explain several of the most striking features of Fig. 5, namely: (1) the peak in significant positive correlations at latitudes around 50 degrees North and South (Fig. 5a); (2) the tendency for a less significant but nonetheless evident trend to negative correlation coefficients at low latitudes (Fig. 5a); and (3) the location of the peak in correlation over one of the principal oceans, namely over the North and South Atlantic (Fig. 5c).
http://www.agu.org/pubs/crossref/2009/2009JA014342.shtml
If the Sun is so quiet, why is the Earth ringing? A comparison of two solar minimum intervals.
Observations from the recent Whole Heliosphere Interval (WHI) solar minimum campaign are compared to last cycle’s Whole Sun Month (WSM) to demonstrate that sunspot numbers, while providing a good measure of solar activity, do not provide sufficient information to gauge solar and heliospheric magnetic complexity and its effect at the Earth. The present solar minimum is exceptionally quiet, with sunspot numbers at their lowest in 75 years and solar wind magnetic field strength lower than ever observed. Despite, or perhaps because of, a global weakness in the heliospheric magnetic field, large near-equatorial coronal holes lingered even as the sunspots disappeared. Consequently, for the months surrounding the WHI campaign, strong, long, and recurring high-speed streams in the solar wind intercepted the Earth in contrast to the weaker and more sporadic streams that occurred around the time of last cycle’s WSM campaign.
2005 paper by Georgieva, Bianchi, & Kirov “Once again about global warming and solar activity”
http://www.google.ca/url?sa=t&rct=j&q=&esrc=s&frm=1&source=web&cd=1&cad=rja&ved=0CEAQFjAA&url=http%3A%2F%2Fsait.oat.ts.astro.it%2FMSAIt760405%2FPDF%2F2005MmSAI..76..969G.pdf&ei=0VzeUKqnOcTVigKukoG4Dw&usg=AFQjCNE1HIIaQdO213fgDBS9nT2fvY3-Rg&sig2=fJJcGWaLuAqjFMD5nxoivQ&bvm=bv.1355534169,d.cGE
“It could therefore be concluded that both the decreasing correlation between sunspot number and geomagnetic activity, and the deviation of the global temperature temperature long-term trend from solar activity as expressed by the sunspot index are due to the increased number of high speed streams of solar wind on the decreasing phase and the minimum of sunspot in the last decade.”
It has been noted that in the last century the correlation between sunspot number and geomagnetic activity has been steadily decreasing from – 0.76 in the period 1868-1890 to 0.35 in the period 1960-1982, … According to Echer et al (2004), the probable cause seems to be related to the double peak structure of geomagnetic activity. The second peak, related to high speed solar wind from coronal holes (my comment: For example coronal hole 254 that produced the Dec 16, 2006 peak in solar wind, during a sun spot minimum, see attached link to Solar Observation Data), seems to have increased relative to the first one, related to sunspots (CMEs) but, as already mentioned, this type of solar activity is not accounted for by sunspot number. In figure 6 long term variations in global temperature are compared to the long-term variations in geomagnetic activity as expressed by the ak-index (Nevanlinna and Kataga 2003). The correlation between the two quantities is 0.85 with p< 0.01."

Chad Jessup
December 28, 2012 7:47 pm

Steven Mosher, could you kindly provide an amplification of your remarks concerning no correlation between clouds and GCR?
Svensmark claims no correlation between GCR and middle (3.2 – 6.5 km) and high (>6.5 km) clouds but excellent correlation between GCR and low clouds (<3.2 km).

December 28, 2012 7:47 pm

Caleb says:
December 28, 2012 at 7:39 pm
Leif, for a man who is excellent, when it comes to the narrow range of your expertise, you seem unaware of worlds outside your canyon.
When people come into my canyon I tell them the facts. And how do you justify to state that my range of expertise is ‘narrow’? as compared to many commenters here who have no expertise.

Ninderthana
December 28, 2012 7:53 pm

As per usual, the main characters in the shadow-debate here completely miss the central point. Alec Rawls is arguing that there is some (unknown) amplification factor that increases the impact of changes in the level of solar activity on the Earth’s climate. It is this claim that people should be addressing.
It’s as though there is a fight between Jo Frasier and Mohammad Ali and Jo has jumped out of the ring and beating the living-%$#782 out of one of the spectators in the back row.

thisisnotgoodtogo
December 28, 2012 8:32 pm

Mr. Rawls,
I think the proxy divergence issue has been handled in the literature – and clear precedent was set on how to handle such a divergence. Make us a stick!.

u.k.(us)
December 28, 2012 8:44 pm

Steven Mosher says:
December 28, 2012 at 6:20 pm
=======
“….use CRN which Anthony endorses.”
———–
How did Anthony enter into the equation ?

markx
December 28, 2012 8:55 pm

Alec Rawls said of Dana’s view of the physics involved: [Dana’s view is that] If you leave a pot of water on a steady flame it won’t heat. If you want to heat the water you have to keep turning the flame up….. ”
Very nice analogy …. and Dana has to acknowledge this is one freaking big pot of water……. and that he keeps telling how small is the solar forcing, but posits a theory of instant response.

DaveA
December 28, 2012 9:06 pm

Sometimes it’s OK to gauge warming just from surface temperature, and sometimes it’s not…
http://www.skepticalscience.com/global-warming-lesson-for-monckton-and-co.html
This is why Pielke Sr. also argued that global warming “is best diagnosed by changes in upper ocean heat content”. We don’t quite agree — we believe that global warming is best diagnosed by considering all warming measurements including both surface warming and ocean heat content,

E.M.Smith
Editor
December 28, 2012 9:18 pm

@ShrNfr:
Nice catch on the cosmic side… Looks like a somewhat ‘cooked’ series in that the neutron count has 4 roughly equal peaks while the above graph, or the same period, as 2 and ends low.
On the temperature side, they use GISS, which is an ‘outlier high’ anyway, but it is based on GHCN where they have now moved more of the ‘adjusting the past cooler’.
This series looks at GHCN version1 vs version3 for the same time interval. Supposedly this is THE SAME data set:
https://chiefio.wordpress.com/v1vsv3/
and just the ‘fixing’ of it introduces a warming trend.
So the basic data, warmed, pruned, and adjusted; with added TOBS and ‘wrong way UHI’ and an “MMTS cooling bias adjustment” that was really locking in place an ‘aging paint on Stevenson Screens false warming” all bundled in, gets run through GIStemp to make the above basic “pasteurized data food product”.
Yet even that isn’t enough. They put an 11 year average on it. That means the last 11 years of data don’t show the recent trend correctly. “Smoothing” hides inflection points, especially at the ends. ( A simple moving average worse than most, but we don’t know what method was used).
Personally, I’ll take the snow cover as my guide. As of now, we’ve got more % snow cover in the USA than last year and we’ve only just started winter.
We’ve go snow all the way down to Dallas, Texas. We’ve got glaciers growing on Mt. Shasta. We’ve got Russia and China in a frozen meat locker. We’ve got N. Hemisphere snow above the ‘climatology’ average. ( I’m sure we’re going to be told “But it’s a WARM snow!” 😉
http://moe.met.fsu.edu/snow/
doesn’t even have the latest on it (two days old right now) and we’re already “coloring outside the lines”…
So that temperature line on the graph is bogus at every possible step.
(And no, I’m not blaming you Alec! You are just using the graph they did… which gives us ‘target practice’ 😉
So given that both lines are bogus on the graph, I’m not surprised their arguments are broken too…
BTW: I fully followed the argument and the drinking analogy. It is correct. We need to drop below the level of balance to see reduction. For booze, it’s about “one drink / hour” (depends on the person, though) and it only changes how fast you get drunk when over that 1/hr. This is what is taught in traffic school (don’t ask 😉 and I’ve tested it and proven it ( 6 pack fast is effective, 6 pack 1 / hour does nothing… 3/ hour is intermediate…)

William
December 28, 2012 9:32 pm

The extreme AGW paradigm pushers have painted themselves into a corner. There are cycles of warming and cooling in the paleoclimatic record that correlate with cosmogenic isotope changes. There is smoking gun evidence that the sun is a serial climate changer. The answer to how the sun serially changes climate is more complicated and interesting than changes to the solar heliosphere that modulate GCR.
I have seen no discussion electroscavenging in the general media or at Real Climate, except for my postings.
There is peer reviewed published papers concerning a reduction in planetary cloud cover that correlates with the 20th century warming. The questions are: 1) Why was there a reduction in planetary cover (see below for details) and 2) will the cloud cover return (yes).
Note the reduction in cloud cover is at the same latitude as predicted by Tinsley’s electroscavenging mechanism. (The continuation of the suppression of cloud cover – post 2006 – is due to a third mechanism.)
The following is another paper by Tinsley that explains the electroscavenging mechanism. Solar wind bursts create a space charge differential in the ionosphere. The space charge differential removes cloud forming ions.
The electroscavenging mechanism explains why there was a reduction in planetary clouds when GCR has high, as there were solar wind bursts during the declining period of the solar cycle caused by coronal holes on the solar surface.
http://www.atmos-chem-phys.org/5/1721/2005/acp-5-1721-2005.html
Analysis of the decrease in the tropical mean outgoing shortwave radiation at the top of atmosphere for the period 1984–2000
All cloud types show a linearly decreasing trend over the study period, with the low-level clouds having the largest trend, equal to −3.9±0.3% in absolute values or −9.9±0.8% per decade in relative terms. Of course, there are still some uncertainties, since the changes in low-level clouds derived from the ISCCP-D2 data, are not necessarily consistent with changes derived from the second Stratospheric Aerosols and Gas Experiment (SAGE II, Wang et al., 2002) and synoptic observations (Norris, 1999). Nevertheless, note that SAGE II tropical clouds refer to uppermost opaque clouds (with vertical optical depth greater than 0.025 at 1.02μm), while the aforementioned synoptic cloud observations are taken over oceans only. The midlevel clouds decreased by 1.4±0.2% in absolute values or by 6.6±0.8% per decade in relative terms, while the high-level ones also decreased by 1.2±0.4% or 3±0.9% per decade in relative terms, i.e. less than low and middle clouds. Thus, the VIS/IR mean tropical (30_ S–30_ N) low-level clouds are found to have undergone the greatest decrease during the period 1984–2000, in agreement with the findings of Chen et al. (2002) and Lin et al. (2004).
http://www.utdallas.edu/physics/faculty/tinsley/Role%20of%20Global%20Circuit.pdf
Tinsley et al.
The role of the global electric circuit in solar and internal forcing of clouds and climate
Look at figure 12 in the attached which shows the number of solar magnetic storms per year, from 1865 to present and the solar cycle number. There is a roughly 20 times increase in the number of magnetic storms at the end of the solar cycles, when comparing the 20th century to the 19th century. It is not just the number, but the magnitude of the solar storms.
http://www.geomag.bgs.ac.uk/earthmag.html#_Toc2075558
http://sait.oat.ts.astro.it/MSAIt760405/PDF/2005MmSAI..76..969G.pdf
Once again about global warming and solar activity
K. Georgieva1, C. Bianchi2 and B. Kirov1
The real terrestrial impact of the different solar drivers depends not only on the average
geoeffectiveness of a single event but also on the number of events. Figure 5 presents the
yearly number of CHs, CMEs and MCs in the period 1992-2002. On the descending phase
of the sunspot cycle, the greatest part of high speed solar wind streams affecting the Earth comes from coronal holes (Figure 5), in this period their speed is higher than the speed of the solar wind originating from other regions, and their geoeffectiveness is the highest. Therefore, when speaking about the influence Fig. 4. Solar cycle variations of the average geoeffectiveness of solar wind from CHs, MCs and CMEs. Fig. 5. Yearly number of CHs, MCs and CMEs of solar activity on the Earth, we cannot neglect the contribution of the solar wind originating from coronal holes. However, these open magnetic field regions are not connected in any way to sunspots, so their contribution is totally neglected when we use the sunspot number as a measure of solar activity.
The second peak, related to high speed solar wind from coronal holes, seems to have
increased relative to the first one, related to sunspots (CMEs) but, as already mentioned, this type of solar activity is not accounted for by the sunspot number. In Figure 6 the long-term variations in global temperature are compared to the long-term variations in geomagnetic activity as expressed by the ak-index (Nevanlinna and Kataja 2003). The correlation between the two quantities is 0.85 with p<0.01 for the whole period studied.

December 28, 2012 9:33 pm

William says:
December 28, 2012 at 7:45 pm
The majority of the 20th century warming has caused by solar modulation of planetary cloud cover.
That and all the rest fly in the face of the fact that solar modulation has not had any long-term trend the past 300 years.

December 28, 2012 9:36 pm

Ninderthana says:
December 28, 2012 at 7:53 pm
As per usual, the main characters in the shadow-debate here completely miss the central point. Alec Rawls is arguing that there is some (unknown) amplification factor that increases the impact of changes in the level of solar activity on the Earth’s climate.
Since solar activity has not had any long-term trend the past 300 years, then Earth’s climate would not have either.

markx
December 28, 2012 9:43 pm

E.M.Smith says: December 28, 2012 at 9:18 pm
“…I’ve tested it and proven it ( 6 pack fast is effective, 6 pack 1 / hour does nothing… 3/ hour is intermediate…)…”
With all these models and adjusted charts, isn’t it marvelous to see there are still dedicated and meticulous scientists who will get in and do essential basic research!? 🙂

December 28, 2012 9:46 pm

William says:
December 28, 2012 at 7:45 pm
See this paper by Brian Tinsley and Fangqun Yu
Tinsley partially relies on an effect [the Wilcox effect] of which I was a co-discoverer. This effect has long been discredited and is no longer considered valid by the [still living] discoverers.
The solar heliosphere stretches out about 20 light hours (near the orbit of Uranus.)
No, it stretches five times farther.
global temperature are compared to the long-term variations in geomagnetic activity
Geomagnetic activity has had no trend since 1844: http://www.leif.org/research/Ap-1844-now.png

George E. Smith
December 28, 2012 9:51 pm

The Svensmark cosmic ray-temperature link ( to the extent that there may be one), is a bit more complex than say just in phase or out of phase. Some have mentioned an 11 year variability, as if the effect was solar cycle linkage. If solar magnetism reverses each 11 years, while earth magnetism doesn’t, the resultant near earth magnetic field, would have some sort of 22 year cyclic variation. Since CRs result in charged particle showers, such particles can be steered by the net field, resulting in a redistribution from equator to poles (magnetic), and with more moisture in the tropics, than the polar regions, any effect of cloud formation, would be more effective if charged particles aren’t routed to the magnetic polar regions (by spiralling around the field lines).
So magnetic redistribution of CR charged particles, might have more effect than simple change in cr counts.
Of course it woult take actual data to determine if this is another butterfly wing effect, or is of observable magnitude.
I’m not equipped to follow on that; but presumably Svensmark is.

December 28, 2012 10:14 pm

George E. Smith says:
December 28, 2012 at 9:51 pm
the resultant near earth magnetic field, would have some sort of 22 year cyclic variation.
It does, but not the way you think. The polarity change [at solar maximum] introduces a slight variation of the SHAPE of the solar modulation. You can see that here: http://www.leif.org/research/Neutron-Monitors-Real-Time.htm
Scroll to the last page and look at the red curve for Hermanus. You might notice that every other peak is sharp, while the intervening peaks are broader. The reason for this is well-understood and has to do with a polarity-dependent drift of GCRs.

William
December 28, 2012 10:17 pm

In reply to lsvalgaard says:
December 28, 2012 at 9:33 pm
The portion of the heliosphere that deflects GCR extends to the orbit of Uranus. The heliosphere does extend roughly 5 times further.
The geomagnetic field parameter that correlates with the planetary temperature change is AK. I quoted a published paper that notes the correlation. Did you look at the paper?
http://www.agu.org/pubs/crossref/2009/2009JA014342.shtml
If the Sun is so quiet, why is the Earth ringing? A comparison of two solar minimum intervals.
Observations from the recent Whole Heliosphere Interval (WHI) solar minimum campaign are compared to last cycle’s Whole Sun Month (WSM) to demonstrate that sunspot numbers, while providing a good measure of solar activity, do not provide sufficient information to gauge solar and heliospheric magnetic complexity and its effect at the Earth. The present solar minimum is exceptionally quiet, with sunspot numbers at their lowest in 75 years and solar wind magnetic field strength lower than ever observed. Despite, or perhaps because of, a global weakness in the heliospheric magnetic field, large near-equatorial coronal holes lingered even as the sunspots disappeared. Consequently, for the months surrounding the WHI campaign, strong, long, and recurring high-speed streams in the solar wind intercepted the Earth in contrast to the weaker and more sporadic streams that occurred around the time of last cycle’s WSM campaign.
(Sorry this link does not copy. Google “Once again about global warming and solar activity” and have a look at the paper.)
http://sait.oat.ts.astro.it/MSAIt760405/PDF/2005MmSAI..76..969G.pdf
Once again about global warming and solar activity K. Georgieva, C. Bianchi, and B. Kirov
We show that the index commonly used for quantifying long-term changes in solar activity, the sunspot number, accounts for only one part of solar activity and using this index leads to the underestimation of the role of solar activity in the global warming in the recent decades. A more suitable index is the geomagnetic activity which reflects all solar activity, and it is highly correlated to global temperature variations in the whole period for which we have data.
In Figure 6 the long-term variations in global temperature are compared to the long-term variations in geomagnetic activity as expressed by the ak-index (Nevanlinna and Kataja 2003). The correlation between the two quantities is 0.85 with p<0.01 for the whole period studied.It could therefore be concluded that both the decreasing correlation between sunspot number and geomagnetic activity, and the deviation of the global temperature long-term trend from solar activity as expressed by sunspot index are due to the increased number of high-speed streams of
solar wind on the declining phase and in the minimum of sunspot cycle in the last decades.

David L. Hagen
December 28, 2012 10:30 pm

Alec Rawls
Regarding “levels” vs “trends”, recommend comparing David Stockwell’s Solar Accumulation Theory and Solar Supersensitivity.
Note especially the differences between I(1) and I(2).

William
December 28, 2012 11:19 pm

There are published papers from specialists that support the assertion that the sun was unusually active in the later part of the 20th century and there are published papers to support the electroscavening mechanism. (There is an observed change in cloud cover and precipitation changes.)
It is natural for there to be disagreement among specialists. It is very common for one side to believe it is impossible for the other side to be correct.
As it appears the solar magnetic cycle has been interrupted we can resolve this discussion by direct observation rather than by models or predictions. I would most certainly be interested in your comments concerning anomalous solar observations which I would expect should start in 2013.
http://www.solen.info/solar/images/comparison_recent_cycles.png
Doubling Sun’s Coronal Magnetic Field in Last 100 years
http://www.nature.com/nature/journal…/399437a0.html
The solar wind is an extended ionized gas of very high electrical conductivity, and therefore drags some magnetic flux out of the Sun to fill the heliosphere with a weak interplanetary magnetic field1,2. Magnetic reconnection—the merging of oppositely directed magnetic fields—between the interplanetary field and the Earth’s magnetic field allows energy from the solar wind to enter the near-Earth environment. The Sun’s properties, such as its luminosity, are related to its magnetic field, although the connections are still not well understood3,4. Moreover, changes in the heliospheric magnetic field have been linked with changes in total cloud cover over the Earth, which may influence global climate5. Here we show that measurements of the near-Earth interplanetary magnetic field reveal that the total magnetic flux leaving the Sun has risen by a factor of 1.4 since 1964: surrogate measurements of the interplanetary magnetic field indicate that the increase since 1901 has been by a factor of 2.3. This increase may be related to chaotic changes in the dynamo that generates the solar magnetic field. We do not yet know quantitatively how such changes will influence the global environment.
http://www.utdallas.edu/physics/pdf/Atmos_060302.pdf
5. The Global Electric Circuit and Electroscavenging
5a. Modulation of Jz in the global circuit.
The global electric circuit was illustrated pictorially in Figure 3.1, and a schematic circuit diagram is given in Figure 5.1. General properties of the circuit have been reviewed by Bering et al. [1998[. Earlier comprehensive reviews have been given by NAS [1986] and Israël [1973]. The polar potential pattern is superimposed on the thunderstorm-generated potentials. In a given high latitude region the overhead ionospheric potential, Vi is the sum of the thunderstorm-generated potential and the superimposed magnetosphere-ionosphere generated potential for that geomagnetic latitude and geomagnetic local time. During magnetic storms the changes in Vi from the mean can be as high as 30% within regions extending up to 30ーof latitude out from the geomagnetic poles [Tinsley et al.1998].
As indicated in Figure 5.1, horizontal potential differences of order 100 kV are generated, high on the dawn side and low on the dusk side, producing corresponding changes in Vi and Jz. The dawn-dusk potential difference has a strong dependency on the product of the solar wind velocity, vsw, and the Bz(GSM) north-south solar wind magnetic field component [Boyle et al., 1997].
http://www.ann-geophys.net/27/2045/2009/angeo-27-2045-2009.pdf
On the long term change in the geomagnetic activity during the 20th century
The analysis of the aa index series presented in this paper clearly shows that during the last century (1900 to 2000) the number of quiet days (Aa<20 nT) drastically diminished from a mean annual value greater than 270 days per year at the end of the nineteenth century to a mean value of 160 quiet days per year one hundred years later. This decrease is mainly due to the decrease of the number of very quiet days (Aa<13 nT). We show that the so-evidenced decrease in the number of quiet days cannot be accounted for by drift in the aa baseline resulting in a systematic underestimation of aa during the first quarter of the century: a 2–
3 nT overestimation in the aa increase during the 20th century would lead to a 20–40% overestimation in the decrease of the number of quiet days during the same period.
The quiet days and very quiet days correspond to periods during which the Earth encounters slow solar wind streams flowing in the heliosheet during the period where the solar magnetic field has a dipolar geometry. Therefore, the observed change in the number of quiet days is the signature of a long term evolution of the solar coronal field topology. It may be interpreted in terms of an increase in the magnitude of the solar dipole, the associated decrease of the heliosheet thickness accounting for the observed decrease in the number of quiet days.
http://www.agu.org/pubs/crossref/2009/2009JA014342.shtml
If the Sun is so quiet, why is the Earth ringing? A comparison of two solar minimum intervals.

Doug Proctor
December 28, 2012 11:27 pm

The Unique Solution Syndrome: there is one and only one “correct” interpretation to any observation. All others, by definition, must be wrong. As soon as you find “an” answer that suffices, your job is finished.
Geologists know that there are many ways to account for a series of observations that are bound by a common rule in the general sense, but uniquely determined by non-common details in the specific. The barrier island develops by long-shore deposition of sands originating from an upstream river source in general, but it develops HERE, for THIS LENGTH and FOR THIS LONG and with THIS SHAPE because the shelf-shore has a certain pattern, and the winter winds comes from a certain direction for a certain length of time, etc. etc. We create an answer as best we can as to exactly how it works, because the Corps of Engineers and others need to understand what to expect in the future, but what we really do is create an answer that is internally consistent with the facts and theories we have.
We know there are other, similarly sufficient answers: that is why each generation of geologists does not put out of work the following generation of geologists. Our answers often are like the suit that is said to fit where it touches: good-looking and useful from the angle we are looking from today, but not so much from where we are, tomorrow.
Geology is most correct in the general sense, less correct in its details. The geologist knows this even though he is paid to make a specific statement today. Climate science, in contrast, is held as a science with a unique solution to any situation, more of an engineering study.
The details are what determine the characteristics of the outcome in geology. If you don`t have the details right you don`t have a mine or an oil field where you dig. It looks the same with climatology, but you`d never know that from the Global Warming fiasco.
The really weird thing about climatology as practiced by the IPCC is that the science is said to be settled, so what happens is really an engineering project to determine, but the range of outcomes by 2100 has not reduced in the last 24 years of study. If you were to use even a probability function and then compare it to observation, you would feel it necessary to change the probability distribution after 24 years. Even if the change was to admit you didn`t KNOW what the probability distribution should be.

John Wright
December 28, 2012 11:38 pm

Seems Dana’s never head of latent heat, has he?

John Wright
December 28, 2012 11:38 pm

Sorry, never heard…

December 28, 2012 11:43 pm

One of my favourite stories from popular science history is about an incident that took place during World War 2. At some point in ’42 or 43, the British, who’s pioneering use of radar had saved them from the Luftwaffe in 1940 got an awful scare when one morning their screens showed nothing but fuzz. For the first time since the outbreak of war they were effectively blinded. Certain that the Germans had invented a jamming device they immediately got their finest boffins on the job an alerted their coastal defences to expect a massive air attack.
It was mid morning before an astute technician noticed that the source of interference was steadily climbing into the sky…by lunchtime, to their immense relief, they realised that its source was The Sun!
This was one of the first times in history that the sun’s output had been detected by radio sensitive equipment.
So you can understand now why it is that I see a chart recording Cosmic Ray Activity starting in 1880!!!! I just feel like laughing

December 29, 2012 12:29 am

By putting the Gleisberg solar cycle into a chart, as I have done, (and others can follow and copy??),
http://blogs.24.com/henryp/2012/10/02/best-sine-wave-fit-for-the-drop-in-global-maximum-temperatures/
I think it is possible for me to estimate that all observed warming is natural or very nearly completely natural. Please correct me if you think I am wrong.
Consider the fact that we really do not have a global temp. record to speak of since at least around 1925. In those days they just manufactured thermometers, never realizing that after time they need to be re-calibrated…..I have challenged anyone to bring me the calibration certificates of thermometers used in weather stations from before that time, with no response.
This means that if we look at my global sine wave chart above for energy in
(not to be confused with energy-out)
we must rather look at the absolute value of the increase in the heat coming through the top of the atmosphere from 1927 (85 years ago) until 1950. This means an increase of ca. 0.037/2 (roughly integrated) x 23 = 0.43 degrees K.
In the next period from 1950 to 1995, when records were firmly established we are seeing the warming that everyone started to fear, namely 0.037/2 (roughly integrated) x 45 = 0.83 degrees K. From 1995 until 2012 it looks we went down on the maxima by ca. 0.037/2 x 17 = 0.31
So I have 0.43 + 0.83 – 0.31= 0.95 degrees K up on the maxima since 1927
I have had a look now at CET maxima and found it rising by 0.0105 degree K per annum from 1927 – 2012. A total of 0.89 K from 1927 which again confirms the correctness of my global estimate.
I also had a look now at the increase of CET means and found it increasing by 0.0088 degree C per annum since 1927. This means the ratio of maxima/means is therefore estimated as 1.19.
This leaves me with an estimate of 0.95/1.19 = 0.8 up on the means which even is 0.1 K higher than the actual observed increase, as here,
http://www.woodfortrees.org/plot/hadcrut4gl/from:1927/to:2013/plot/hadcrut4gl/from:1927/to:2013/trend/plot/hadcrut3vgl/from:1927/to:2013/plot/hadcrut3vgl/from:1927/to:2013/trend/plot/rss/from:1927/to:2013/plot/rss/from:1927/to:2013/trend/plot/gistemp/from:1927/to:2013/plot/gistemp/from:1927/to:2013/trend/plot/hadsst2gl/from:1927/to:2013/plot/hadsst2gl/from:1927/to:2013/trend
I think an error of +0.1 is not that bad, for a rough estimate, so all of this leaves me with no warming caused by human beings, as I had suspected, from the very beginning,
http://blogs.24.com/henryp/2011/08/11/the-greenhouse-effect-and-the-principle-of-re-radiation-11-aug-2011/

Dale
December 29, 2012 12:32 am

Let’s look at what Dana is saying from another angle:
Case 1: CO2 level stays steady for the next 30 years at 400 ppmv. According to Dana, temps will not change.
Case 2: CO2 levels drop by 2 ppmv/yr for the next 15 years (from 400 to 370). According to Dana, temps will drop.
Anyone willing to bet Dana will agree with the above two cases?

vukcevic
December 29, 2012 1:06 am

Climate’s Natural Variability appear to be a direct consequence of the interaction between the Solar magnetic cycles and the geomagnetic input; results of my finding are briefly summarised her:
http://www.vukcevic.talktalk.net/NV.htm
Dr. Svalgaard in the past has vehemently denied any scientific validity to the above finding, and I assume he will do so in the foreseeable future.
It is pointless going over the same ground again, the most recent exchange can be found on the Haigh-Anxiety

December 29, 2012 1:22 am

William says:
December 28, 2012 at 11:19 pm
It is natural for there to be disagreement among specialists. It is very common for one side to believe it is impossible for the other side to be correct.
The papers you refer to are already out-of-date. This is a rapidly developing area of research. Both the sunspot number and the Ak-index [extension of the Aa-index] are subject to updates and revision. I am leader of a team of specialists examining the evidence http://www.leif.org/research/Svalgaard_ISSI_Proposal_Base.pdf
Charles Gerard Nelson says:
December 28, 2012 at 11:43 pm
So you can understand now why it is that I see a chart recording Cosmic Ray Activity starting in 1880!!!! I just feel like laughing
You shouldn’t. Cosmic Ray Activity create radioactive isotopes (Carbon 14 and Beryllium 10] which can be found in tree rings and ice cores. The data goes back more than 10,000 years.
Here is how it is done: http://www.leif.org/EOS/Beer-GCRs.pdf

Chris Schoneveld
December 29, 2012 1:30 am

Leif claims (his usual line):
“since solar activity has not had any long-term trend the past 300 years, then Earth’s climate would not have either.”
Yet there is a wealth of research that does show a link. For example:
De Jager, C. and Duhau, S. The variable solar dynamo and the forecast of solar activity;
effects on terrestrial surface temperature; in J. M. Cossia (ed), Proceedings of the global
warming in the 21th century. NOVA science publishers, Hauppauge, NY, 2010; 77.
They concluded: “We studied the relation between average terrestrial surface temperature and solar variability for the period 1610 – 1970. During this period the average terrestrial surface temperatures are correlated both with the equatorial as well as the polar solar magnetic field components. The correlation with the equatorial field can fully be explained. It is due to the gradual increase of the Total Solar irradiance and the consequent feedback by evaporated gases. The explanation of the polar correlation is still open.”

December 29, 2012 1:35 am

Joanne Haigh has just been made a CBE for ‘Services to physics’. What!

Editor
Reply to  Phillip Bratby
December 29, 2012 1:39 am

@Phillip Bratby
You beat me to it! I was about to report that here also.

December 29, 2012 1:38 am

vukcevic says:
December 29, 2012 at 1:06 am
Climate’s Natural Variability appear to be a direct consequence of the interaction between the Solar magnetic cycles and the geomagnetic input […]
Dr. Svalgaard in the past has vehemently denied any scientific validity to the above finding, and I assume he will do so in the foreseeable future.

You bet, and much longer than the ‘foreseeable future’.

December 29, 2012 1:41 am

Chris Schoneveld says:
December 29, 2012 at 1:30 am
“since solar activity has not had any long-term trend the past 300 years, then Earth’s climate would not have either.”
Yet there is a wealth of research that does show a link.

Which are based on obsolete datasets of solar activity. Before you make such conclusions, it might be a good idea to examine the evidence: http://www.leif.org/research/Solar-Petaluma–How%20Well%20Do%20We%20Know%20the%20SSN.pdf

pkatt
December 29, 2012 1:52 am

First off Bravo Camburn.
We have ocean currents, plate tectonics, volcanoes, cloud cover, winds, and a whole universe to effect us. There are so many variables it would be nearly impossible for one study of science to explain it with a single graph. Worse we seem to have tossed away major mechanisms, for scientific mysticism. We aren’t the only planet in the system experiencing change. Instead of “we don’t know why”, what we hear is “It has to be because I say so” or worse.. “my model or my corrected data says so.” That is not science. Science is fluid and changing, as man knows more, gets closer, observes directly, science progresses. If science becomes consensus, it becomes stagnant.
I do a lot of reading and I keep an open mind.. but nothing turns me away faster then an author that claims to absolutely know anything and models compared to the actual eco system of this planet are like pong on the first computers.. entertaining but primitive. Humans still don’t know how to make a truly closed ecosystem. All of those models have failed.
It is an interesting time, our sun is quiet, our magnetic field is supposedly weakening, and our poles are moving pretty quickly, but even those may have patterns they follow. We wobble after all. Meanwhile the world did not end.. AGAIN.. but maybe we again have overlooked the subtlety of the universe ( the show behind the sun) because we were too busy looking at the end of worlders throwing a fit in the street. We must keep letting our media, politicians and consensus scientists know that we aren’t playing their game anymore. Maybe it will sink in someday.

December 29, 2012 3:08 am

Right after the title “Three blind mice” you call Mr. Nuccitelli Mr. Nutticelli which comes to my mind too when I read his stuff, but since we sceptics are nice people, you should correct that. Regards from the Swiss mountains, Fred
[Good find. Thank you. Mod]

kwik
December 29, 2012 3:20 am

ggoodknight says:
December 28, 2012 at 6:51 pm
“Steve Mosher, GCR are very well correlated with ocean temps over geologic time. something like a 5C (memory failing me) range of equatorial ocean temps from min to max by Jan Veizer’s oxygen isotope proxies.”
Here:
http://www.phys.huji.ac.il/~shaviv/Ice-ages/GSAToday.pdf

Other_Andy
December 29, 2012 3:20 am

@Freddie
A Freudian slip…?

thingadonta
December 29, 2012 3:48 am

Yes, I see you have taken up the summer solstice and daily temperature heat lags after a solar radiation peak, as well as the Usoskin paper, I blogged on this on skeptical science (sic) a few years ago, but they didn’t get it of course. Keep at it, a few honest consensus physicists will come out of the woodwork to politely inform them of their gross error sooner or later.

December 29, 2012 4:30 am

leif svalgaard says
You bet, and much longer than the ‘foreseeable future’.
henry says
To explain weather cycles, before they started with the carbon dioxide nonsense, they did look in the direction of the planets, rightly or wrongly. See here.
http://www.cyclesresearchinstitute.org/cycles-astronomy/arnold_theory_order.pdf
To quote from the above paper:
A Weather Cycle as observed in the Nile Flood cycle, Max rain followed by Min rain, appears discernible with maximums at 1750, 1860, 1950 and minimums at 1670, 1800, 1900 and a minimum at 1990 predicted.
(The 1990 turned out to be 1995 when cooling started!)
Please note: indeed one would expect more condensation (bigger flooding) at the end of a cooling period and minimum flooding at the end of a warm period. This is because when water vapor cools (more) it condensates (more) to water (i.e. more rain).
Now put my sine wave next to those dates?
http://blogs.24.com/henryp/2012/10/02/best-sine-wave-fit-for-the-drop-in-global-maximum-temperatures/
1900- minimum flooding : end of warming
1950 – maximum flooding: end of cooling
1995 – minimum flooding: end of warming
So far, I do not exclude a gravitational or electromagnetic swing/switch that changes the UV coming into earth. In turn this seems to change the chemical reactions of certain chemicals reacting to the UV lying on top of the atmosphere. This change in concentration of chemicals lying on top of us, i.e. O3, HxOx and NxOx, in turn causes more back radiation (when there is more), hence we are now cooling whilst ozone & others are increasing.
Hope this helps a few people.
the dates are important: ozone started declining in 1951 and started rising in 1995
If Leif or somebody can help to correlate that with the observed switch?

DEEBEE
December 29, 2012 4:49 am

Is’nt this the same crowd that thinks that a decrease in the rate of government spending increase is a cut?

TimTheToolMan
December 29, 2012 4:57 am

Leif writes “The ‘modern maximum’ is an artifact in the sunspot data series.”
Sunspots may be a proxy for TSI but they’re not a proxy for spectral variance. And we now know spectral variance is much greater than first assumed. There is still much we still dont know about how the sun affects our climate.
As to Mosher’s belief that GCRs have no correlation on cloud cover, do you really think a Forbush event is enough to capture that correlation (or lack thereof)? They only last a few days and our cloud data is pretty dodgy.

ConTrari
December 29, 2012 5:05 am

“Dana Nuccitelli’s holiday trick for sobering up quick: put a little less rum in your egg nog”
Perhaps the sobering would be even quicker with a little less Romm?

William
December 29, 2012 5:25 am

In reply to Leif above comments:
lsvalgaard says:
December 29, 2012 at 1:22 am & other comments.
This is where we have common ground. “Something is happening with the Sun”.
I believe we are all going to have an opportunity to observe how the sun causes the cyclic Heinrich events. As others have noted for example Gerald Bond there are massive cosmogenic isotope changes that correlate with the cyclic Heinrich events.There must be a physical explanation for the massive cosmogenic isotope changes, the geomagnetic field changes, and the abrupt cooling that all correlate with the cyclic Heinrich events.
If I understand the mechanisms the solar magnetic cycle has been interrupted which explains why Svensmark’s mechanism (High GCR, creates muons in the upper atmosphere, the muons in turn create ions, which in turn results in an increased in low level clouds at specific latitudes and a reduction in the formation of cirrus clouds. See Tinsley’s paper for details. An increase in low level clouds cools the planet as does a reduction of high latitude cirrus clouds. The cirrus clouds warm the high latitude regions by the greenhouse effect particularly during the winter) and the electroscavening mechanism appears to no longer be functioning.
Electroscavenging is the name Tinsley and others have given for a mechanism by which solar wind bursts create a space charge differential in the ionosphere which removes cloud forming ions.
The electroscavenging mechanism is related to Sprites which form at very high altitudes.
Leif’s power point.
http://www.leif.org/research/Solar-Petaluma–How%20Well%20Do%20We%20Know%20the%20SSN.pdf
Slide 19
“Something is happening with the Sun”
“We don’t know what causes this, but sunspots are becoming more difficult to see or not forming as they used to. There is speculation that this may be what a Maunder-type minimum looks like: magnetic fields still present [cosmic rays still modulated], but just not forming spots. If so, exciting times are ahead.”
William:
As note in the power point presentation, Livingston and Penn have found the magnetic field strength of newly formed sunspots is declining.
The solar large scale magnetic field is also declining.
http://www.solen.info/solar/polarfields/polar.html
http://www.solen.info/solar/
Slide 20
“Sun is perhaps entering a new very low activity Regime
•Fewer sunspots for given F10.7 flux
•Fewer sunspots for given Magnetic Plage Index
•Fewer spots per group
•Fewer small spots
•Less magnetic field per spot
•These changes have been progressive and accelerating since ~1990
•If continuing => possible Maunder Minimum”
William: If the sun causes Heinrich events and the sun is entering the conditions that cause a Heinrich event now, the sun is not entering a Maunder minimum. This will be a true interruption to the solar magnetic cycle. The solar cycle magnetic cycle continued to function during the Maunder minimum (1645 and continuing to about 1715).
http://elf.gi.alaska.edu/#intro
Introduction
Red sprites and blue jets are upper atmospheric optical phenomena associated with thunderstorms that have only recently been documented using low light level television technology.
The first images of a sprite were accidently obtained in 1989 (Franz et al., 1990). Beginning in 1990, about twenty images have been obtained from the space shuttle (Vaughan et al., 1992; Boeck et al., 1994).
Since then, video sequences of well over a thousand sprites have been captured. These include measurements from the ground ( Lyons, 1994; Winckler, 1995) and from aircraft (Sentman and Wescott, 1993; Sentman et al., 1995).
Numerous images have also been obtained from aircraft of blue jets ( Wescott et al., 1995), also a previously unrecorded form of optical activity above thunderstorms. Blue jets appear to emerge directly from the tops of clouds and shoot upward in narrow cones through the stratosphere. Their upward speed has been measured to be about 100 km per second.
Anecdotal reports of “rocket-like” and other optical emissions above thunderstorms go back more than a century (Lyons, 1994), and there have been several pilot reports of similar phenomena (Vaughan and Vonnegut, 1989). Possibly associated gamma ray bursts and TIPPS have also recently reported. Together, these phenomena suggest that thunderstorms exert a much greater influence on the middle and upper atmospheres than was previously suspected.
http://en.wikipedia.org/wiki/Upper-atmospheric_lightning
http://earthobservatory.nasa.gov/Newsroom/view.php?id=29510
Based on the observations, sprites normally begin almost 50 miles high as downward-moving “streamers” that appear spontaneously or at the bottom of a halo — diffuse flashes of light often associated with sprites. The streamers then branch out as they move down. At the same time, a brighter column of light expands both up and down from the starting point, followed by bright streamers that shoot higher into the sky.
http://www.newscientist.com/article/dn8733
“The whole structure develops a lot in one millisecond. So by going with the faster video we really see all the pieces and how they develop in time,” says Steven Cummer, assistant professor of electrical and computer engineering at Duke’s Pratt School of Engineering.
And with so much energy being pumped into a small region, Cummer says sprites may drive atmospheric chemistry that does not normally occur. “The significance at this point lies in what chemical effects these [sprites] may have on the upper atmosphere,” Cummer told New Scientist. The researchers say sprites typically begin at an altitude of about 50 miles (80 kilometres) in the sky in single spots where the electric field creates a spark. Those produce falling “streamers” that branch out as they fall. Much brighter, thicker channels follow, expanding upward from the original spots.

Ninderthana
December 29, 2012 5:34 am

Leif, Could you please pointy out the error in the following train of logic?
1. Leif says:
“Cosmic Ray activity create radioactive isotopes (Carbon 14 and Beryllium 10] which can be found in tree rings and ice cores. The data goes back more than 10,000 years.
Here is how it is done: http://www.leif.org/EOS/Beer-GCRs.pdf
2. Leif acknowledges that Be10 and C14 can be used as proxies for determining long-term changes in the level of solar activity.
3. Leif reads the following two papers:
a. Solar influence on the Indian Ocean Monsoon through dynamical processes
Kunihiko Kodera [2004]
https://www.cfa.harvard.edu/~wsoon/Hiremath2012-d/Kodera04-SolarIndianMonsoon-decadal.pdf
b. The speleothem record of climate variability in Southern Arabia
Dominik Fleitmann and Albert Matter [2009]
http://ipac.kacst.edu.sa/eDoc/2010/189600_1.pdf
4. Leif dismisses the observational evidence showing a link between climate systems here on tthe Earth and long-term variations in the level of solar activity.

vukcevic
December 29, 2012 6:55 am

Climate’s Natural Variability is a direct consequence of the interaction between the Solar magnetic cycles and the geomagnetic input (backed by data from NOAA, SIDC and ETHZ).
– 21.3 years (Hale cycle) period is the primary component in the both solar and Earth magnetic variability
– 16.1 years period is specific to the Earth system, the cause is the Earth’s core-crust internal resonance (possibly triggered by the Hale cycle) equal to the propagation time in either direction (ref: Hide & Dickey) .
16 year period is the strongest component in the Arctic temperature spectrum, while on the opposite side in the Antarctic, its second harmonic (about 8 years) equals the Antarctic’s Circumpolar Wave’s period of oscillation (temperature cycles).
– Two other major ‘components’ the ENSO and AMO are products of cross-modulation.
More here? http://www.vukcevic.talktalk.net/NV.htm

JW
December 29, 2012 7:04 am

Phillip Bradley: Let me try to be clearer because I think the analogy holds true.
Your statement: “Healthy adults metabolize/excrete alcohol at a constant rate. So if you continue drinking below this rate, you will indeed sober up.”
Statement in the original post: “Only when the energy pouring into the climate system falls to the level of the energy escaping back out does the system stop warming.”
In each case, there is a threshold rate (alcohol consumption/energy input) below which there is a decrease and above which there is an increase.
All analogies are imperfect models, but I can’t see any way in which your statements invalidate the analysis of the original post.

ferd berple
December 29, 2012 7:26 am

Ninderthana says:
December 29, 2012 at 5:34 am
4. Leif dismisses the observational evidence showing a link between climate systems here on tthe Earth and long-term variations in the level of solar activity.
=========
By similar logic, scientists have not discovered a mechanism by which gravity can affect matter. Until scientists discover such a mechanism it is not possible for gravity to affect matter.
We know the sun’s magnetic fields and solar wind are variable. Much more variable than TSI. We know that Carbon 14 and Beryllium 10 are good proxies for climate, and that these isotopes are not a result of TSI. Rather they are formed by the sun’s magnetic field and the solar wind.
We do not yet know the mechanism by which the sun determines earth’s climate, but we certainly know from the paleo records that it does. To argue that we need a mechanism before we can attribute cause and effect is nonsense.
What is the mechanism underlying Time? What causes time to move? Why is the rate of time affected by motion and acceleration? What is the mechanism?
Gravity and Time. Fundamental aspects of science. Both of which have no known mechanism. Why do scientists not argue that these cannot be affecting the earth? Isn’t this the argument behind climate science? If we don’t know the mechanism, then the sun cannot be affecting the earth’s climate.

December 29, 2012 8:11 am

ferd berple says
We know the sun’s magnetic fields and solar wind are variable. Much more variable than TSI
henry says
It is not the variation in the TSI as such; it seems (to me) it is the variation in the FUV and/or EUV that causes the differences in the concentration of the ozone and others that affect the energy coming in.

December 29, 2012 8:18 am

William says:
December 29, 2012 at 5:25 am
If I understand the mechanisms the solar magnetic cycle has been interrupted
What does that mean? As I understand the mechanisms the solar magnetic cycle behaves normally, no ‘interruption’ [depending on what you mean by that]
ferd berple says:
December 29, 2012 at 7:26 am
We know the sun’s magnetic fields and solar wind are variable.
There has been no long-term trend in sun’s magnetic field and solar wind since the 1830s.
We know that Carbon 14 and Beryllium 10 are good proxies for climate
Climate influences the deposition of 14C and 10Be, so there is some correlation there, but it goes in the opposite direction.
and that these isotopes are not a result of TSI. Rather they are formed by the sun’s magnetic field and the solar wind.
Variations in the solar wind AND in TSI are caused by the Sun’s magnetic field.

Camburn
December 29, 2012 8:30 am

O/T
Someone should be taking screen shots over at SS. Ron King is asking pertinent questions addressed to Dana’s post http://skepticalscience.com/news.php?n=1791. If SS follows its normal behavior, Mr. King will soon be banned and his posts modified.

Chris Schoneveld
December 29, 2012 8:54 am

lsvalgaard says:
December 29, 2012 at 1:41 am
“Which are based on obsolete datasets of solar activity. Before you make such conclusions, it might be a good idea to examine the evidence: http://www.leif.org/research/Solar-Petaluma–How%20Well%20Do%20We%20Know%20the%20SSN.pdf
Leif, your (peer reviewed?) poster session falsifies all the research that have shown a correlation between solar activity and climate? And I was supposed to have had examined THE evidence that you presented 4 weeks ago? Are you serious?

December 29, 2012 8:58 am

HenryP says:
December 29, 2012 at 8:11 am
It is not the variation in the TSI as such; it seems (to me) it is the variation in the FUV and/or EUV that causes the differences in the concentration of the ozone
The UV creates the ionosphere. Movement of this conduction layer [due to the day-night cycle] results in a dynamo electrical current. The magnetic effect from that current can be measured on the ground [George Graham discovered this in 1722] and those magnetic effects have been measured ever since. The result is that there has been no long-term change in FUV since 1722.

December 29, 2012 9:10 am

Ninderthana says:
December 29, 2012 at 5:34 am
Leif, Could you please pointy out the error in the following train of logic?
E.g. the Kodera paper states that the effects are not due to solar radiative forcing, but “The present analysis demonstrated that the regional impact of Indian Ocean is related to stratospheric variation”.

December 29, 2012 9:26 am

vukcevic says:
December 29, 2012 at 6:55 am
– 21.3 years (Hale cycle) period is the primary component in the both solar and Earth magnetic variability
Solar activity [by any of the many measures] does not have a ~21 year cycle. The period is ~11 years. Your ‘Hale cycle’ is made up by putting a negative sign on every other 11-yr cycle. This is unphysical.

December 29, 2012 9:33 am

Chris Schoneveld says:
December 29, 2012 at 8:54 am
Leif, your (peer reviewed?) poster session falsifies all the research that have shown a correlation between solar activity and climate? And I was supposed to have had examined THE evidence that you presented 4 weeks ago? Are you serious?
Yes, I am serious.

Bigcitylib
December 29, 2012 9:45 am

[snip. Go away. — mod.]

Bart
December 29, 2012 10:05 am

A standard simplified model for temperature of an object heated by an external forcing is
dT/dt = -T/tau + F
where T is temperature, tau is a thermal time constant, and F is the forcing. It is, of course, a natural characteristic of this equation that the temperature will continue to rise when the forcing levels out for short intervals relative to tau.
If one is looking at the system over a very short timeline relative to tau, the equation becomes approximately
dT/dt := F
Various commenters on these boards over the years have pointed out that, if you integrate various solar indices, you get a very clear and pronounced correlation between Earthly temperatures and solar activity. So, you might consider performing such a comparison in your plot at the top of this article, using a model of the form
dT/dt = k*(CRC – CRC_eq)
where CRC is the cosmic ray count, CRC_eq is an equilibrium count to be determined, and k is a coupling constant, also TBD. The effect of solar forcing is cumulative across timelines which could easily be as long as centuries, and that is where the simpleminded analyses of Messrs. Nuccitelli, Sherwood, et al. go astray.

vukcevic
December 29, 2012 10:09 am

lsvalgaard says:
December 29, 2012 at 9:26 am
vukcevic says:
December 29, 2012 at 6:55 am
– 21.3 years (Hale cycle) period is the primary component in the both solar and Earth magnetic variability
Solar activity [by any of the many measures] does not have a ~21 year cycle. The period is ~11 years. Your ‘Hale cycle’ is made up by putting a negative sign on every other 11-yr cycle. This is unphysical.
…………….
No it is not.
The Earth’s magnetic field differentiates between odd and even cycles.
How do we know that?
By different shape of neutron count during the even cycles to the shape of the NC for the odd cycles.
http://i191.photobucket.com/albums/z36/AlecRawls/Environment%20and%20climate/NeutronCount_Oulu_1964-2012_large_zps7997e229.png
Anyway, one can use SSN as proxy for solar polar field, since there are only three cycles of the PF available.
Your argument is invalid

Bart
December 29, 2012 10:09 am

lsvalgaard says:
December 29, 2012 at 9:26 am
“Your ‘Hale cycle’ is made up by putting a negative sign on every other 11-yr cycle. This is unphysical.”
It isn’t his “Hale Cycle”, it is Hale’s. Hence the name. See how that works?

December 29, 2012 10:17 am

Bart says:
December 29, 2012 at 10:05 am
Various commenters on these boards over the years have pointed out that, if you integrate various solar indices
Integration involves an interval over which the integral is to be taken. What is that interval?
And if the values you integrate are wrong to begin with, what does that do to the result?

December 29, 2012 10:22 am

vukcevic says:
December 29, 2012 at 10:09 am
The Earth’s magnetic field differentiates between odd and even cycles. How do we know that? By different shape of neutron count during the even cycles to the shape of the NC for the odd cycles
No, that difference comes from a difference in the incoming flux of cosmic rays. Has nothing to do with the Earth.
Bart says:
December 29, 2012 at 10:09 am
It isn’t his “Hale Cycle”, it is Hale’s. Hence the name. See how that works?
Hale’s cycle is not in solar activity. Vuk makes up an artificial cycle by putting a sign on the SSN alternating between cycles. So, no, I don’t see how that works. Explain it to me.

bones
December 29, 2012 10:22 am

When one writes that temperatures will continue to rise without further increase in the rate of heating it implies that the thing being heated did not reach an equilibrium temperature with any of the previous rates of heating. The question then becomes, how long will it be before an equilibrium temperature is reached. Alec implies that it might be a very long time, but I do not believe that to be the case. Since oceans cover so much of the earth surface, consider the incoming solar UV-VIS that reaches an ocean surface. Roughly half of this is absorbed within the first 25 meters depth and nearly all of the rest is absorbed by 100 meters. Photosynthesizing life is essentially absent at greater depths. The upper 25 meters is a well stirred wave zone and it has about 10 times the heat storage capacity of the earth atmosphere. The temperature of this zone will follow the incoming solar flux with a thermal time constant of about 225 days. Significant temperature changes can occur quickly within this period, as evidenced by the fact that seasonal temperature variations are still very much present at depths of 25 meters.
If, for some reason, solar flux would increase at a steady rate, then in approximately 3 time constant periods, or about 1.8 years, the surface temperature will rise steadily at the same rate as the solar heating increase. Conversely, if the solar flux were then to be held constant, the surface temperature would only rise for another 1.8 years before stabilizing.
The thermal relaxation time for greater depths is longer. At a depth of about 100 meters, the thermal relaxation time is close to 3 years, and it would take three times this, or about 9 years for these lower depths to fully adjust to changes in the solar flux. This is likely the reason that surface temperatures seem to be correlated with the length of previous solar cycles. However, the changes at depths of 100 meters or more are largely accomplished without being manifest at the surface except for the heat transported by ocean currents. For example, water at 100 meters depth in the tropics can be transported to polar regions where it is capable of contributing to atmospheric warming there. For complete equilibration, it should be clear that the circulation time of the ocean currents is part of the adjustment period and this is reflected in some of the multi-decade time scale variations of ocean surface temperatures.
But the bottom line is that ocean surface temperatures mostly adjust very quickly to solar flux changes.

Typhoon
December 29, 2012 10:37 am

The following comments are concerned with the “global temperature” part of the graph
http://i191.photobucket.com/albums/z36/AlecRawls/Environment%20and%20climate/Nuccitelli_cosmic_temp_60_zps38b63e05.jpg
1/ Where are the error bars that show both the statistical and systematic uncertainty? The graphs as presented imply that “global temperature” is known to +/- 0.01C [line thickness] which is nonsensical.
2/ Given that thermometers back in 1890 would do well to be able to measure temperature to +/- 0.5C, how is global temperature from back then apparently known to far better than +/- 0.1C? Even today the best instrumented weather station thermometers have a resolution and accuracy of about +/- 0.1C.
Such graphs and claims require a suspension of belief in measurement and error analysis.
The above bit about missing statistical and systematic error bars also applies to the cosmic ray part of the plot.
3/ Is “global temperature” a physically meaningful derived quantity?
Consider several thousand temperature measurement sites. Divide the surface of the earth into cells – volumes – such that one of the measurement sites is at each centre of a cell. The temperature measured at each site is only representative of the associated cell if and only if the volume is in local thermodynamic equilibrium [temperature is only defined for a system at thermodynamic equilibrium].
As the atmospheric is a dynamic system far from thermodynamic equilibrium and the cells are far to large to be in local thermodynamic equilibrium, the temperature measured at the site centred in cell is not representative.
So deriving a measure called “global temperature” is a dubious exercise at best.
I would argue that it is a meaningless derived quantity and arguments about it are spurious.

December 29, 2012 10:38 am

leifsvalgaard says
The result is that there has been no long-term change in FUV since 1722.
henry says
there are various reports I can find again SHOWING that the variation in FUV/EUV is considerable
the reactions are
uv + O2 => O3
uv + OH => HxOx
uv + NO => NxOx
so, obviously, a change in the distribution of TSI towards more uv
causes more O3, more HxOx and more NxOx
I remember that last time I calculated for you that Trenberth showed that O3 on its own backradiates ca. 25% of all that is being back radiated,
but he (Trenberth) forgot (or never realized) the HxOx and NxOx
It is these changes on top of the atmosphere that cause the warming and cooling periods as explained here
http://wattsupwiththat.com/2012/12/28/dana-nuccitellis-holiday-trick-for-sobering-up-quick-put-a-little-less-rum-in-your-egg-nog/#comment-1185180

December 29, 2012 10:47 am

Henry says
Please note: indeed one would expect more condensation (bigger flooding) at the end of a cooling period and minimum flooding at the end of a warm period. This is because when water vapor cools (more) it condensates (more) to water (i.e. more rain).
Henry says
please understand what I am saying. I am saying that in a cooling period you get more clouds, and more snow and more rain, simply because of physical reasons.
IMHO it has nothing to do with cosmic galactic rays…..

Ulric Lyons
December 29, 2012 11:08 am

lsvalgaard said:
“Geomagnetic activity has had no trend since 1844: http://www.leif.org/research/Ap-1844-now.png
Only a fool would deny that the warming and cooling episodes are readily visible there. And of course the ratio of lower to higher activity periods makes for strong trends at an inter-decadal scale, i.e. there are less periods of lower activity through the strongest warming periods.

Bart
December 29, 2012 11:10 am

lsvalgaard says:
December 29, 2012 at 10:17 am
“What is that interval?”
That of observation. Free parameters must then be assigned based on observation, if they cannot be deduced from first principles.
“And if the values you integrate are wrong to begin with, what does that do to the result?”
It makes it wrong, too. But, that is TBD.
lsvalgaard says:
December 29, 2012 at 10:22 am
“So, no, I don’t see how that works. Explain it to me.”
It is called the “Hale Cycle”. That is because it is named after Hale. If it were Vukcevic’s, it would be called the “Vukcevic Cycle”. Humans tend to name a discovery after the first person who made it widely known and accepted.
bones says:
December 29, 2012 at 10:22 am
“But the bottom line is that ocean surface temperatures mostly adjust very quickly to solar flux changes.”
But, all you are offering is surmise as to that effect. Mental exercises are all fine and good, but when the data tell you your gedanken is flawed, you have to do a little more thinking.

December 29, 2012 11:13 am

HenryP says:
December 29, 2012 at 10:38 am
there are various reports I can find again SHOWING that the variation in FUV/EUV is considerable
Playing with words. Of course, there is considerable variation in FUV/EUV within each cycle and from day to day, but the amount of EUV/FUV we get scales VERY well with the sunspot number and with F10.7 and with the amplitude of the diurnal variation of the east component of the geomagnetic field, and those parameters SHOW no long-term trend since 1722.

vukcevic
December 29, 2012 11:24 am

lsvalgaard says:
December 29, 2012 at 10:22 am
……..
The Sun-Earth magnetic link is established by numerous geomagnetic storms (generated by CMEs) during every cycle. In the even-numbered solar cycles the solar magnetic field tends to hit magnetosphere more often with a leading edge that is magnetized north. This opens a breach and loads the magnetosphere with plasma starting a geomagnetic storm .
Thus the Earth magnetic field differentiates between odd and even cycles.

Gail Combs
December 29, 2012 11:27 am

Richard M says:
December 28, 2012 at 1:10 pm
I doubt the warming is even .8°C. With UHI and questionable adjustments the real increase might be much less.
>>>>>>>>>>>>>>>>>>>>>
Alternate view:
Koppen climate Classification using native plants. The decadal boundaries for the twentieth century for the mid west USA (see second map) map 1910 and 1970 were the only two decades different from the ‘pack’ and they were COLDER.

December 29, 2012 11:27 am

Alec Rawls says:
December 29, 2012 at 11:24 am
Leif makes a distinction between radiative forcings and stratospheric variation
No, Kodera makes that distinction.
Doesn’t change anything. If solar-magnetic effects induce some stratospheric variation that drives climate, that is a mechanism of solar amplification.
Except that the solar parameters that might influence the stratosphere have not shown any long-term trend the past 300 years. That is the key point.

Shawnhet
December 29, 2012 11:40 am

In re: the request for a demonstration of the correlation between cloudiness and GCR. I like to point to the following paper’s graphs.
http://www.atmos-chem-phys.net/8/7373/2008/acp-8-7373-2008.pdf
While it is true that the paper’s authors and the IPCC believe that this is good evidence against the GCR hypothesis, It actually (so far as I can see) provides good evidence for it. see Figure 2 for instance.
Cheers, 🙂

December 29, 2012 12:09 pm

ALEC SAYS
Lots of studies are finding that atmospheric circulation patterns are strongly affected by solar activity, presumably through the UV shift that accompanies solar variation. High activity -> more UV -> more interaction with stratospheric ozone (creation and destruction) warms the stratosphere while at the same time less radiation gets through to warm the surface -> altered atmospheric circulation patterns.
HENRY SAYS
You got it. You figured it out. Just remember it is not only ozone. There are also some peroxides and nitrous oxides involved, which as yet have never even been measured on the TOA….

Gail Combs
December 29, 2012 12:13 pm

kalsel3294 says:
December 28, 2012 at 1:40 pm
Dana Nuccitelli and the likes that inhabit that site always respond by grabbing something, anything, that readily comes to mind to rebut a new perspective …. I don’t think any of them have ever exhibited an original thought, being sadly capable of only parroting what they have trained themselves to parrot.
>>>>>>>>>>>>>>>>>>>>>>>>>>>
SkS is a paid propaganda site. Of course they will do anything, say anything to hide the truth. That is what their pay check requires. That is what their ‘world leadership’ goal requires.
If you read between the lines HERE. John Cook who runs SkS is/was a FOR HIRE web programmer. (2010)

…working from his home in web programming and database programming, something he still does to earn a living, generally working with small local Australian businesses — local doctors, beauty salons, cartoonists, and promotional product companies.

It is interesting that another ‘bio’ states John Cook is currently the Climate Communication Fellow for the Global Change Institute at the University of Queensland. =====> The University established the Global Change Institute (GCI), led by world-renowned researcher Professor Ove Hoegh-Guldberg, to provide a vehicle for collaborative research, learning, engagement and advocacy in major global change issues.
So looks like John has landed in clover, lots of GREEN $$tuff

The University of Queensland is a research leader in many areas associated with global change….
Context
Global change encompasses the interactions of natural and human induced changes in the global environment and their implications for society. These changes are occurring at an unprecedented scale and speed. Fundamental global sustainability challenges include issues as diverse as climate change (carbon mitigation and adaptation); human population growth and shift; resource security and consumption (food, energy sources, water and minerals); stewardship of biodiversity and natural ecosystems; and, within a systems framework, managing the complex impacts (including cumulative impacts), convergences and responses on ecosystem health, social resilience and economic prosperity (including business and industry).
The University of Queensland has established leadership in many of the issues associated with global change, and is positioned to provide national and international leadership in these areas. The GCI will provide a vehicle for collaborative research, learning, engagement and advocacy in major global change issues.
Vision
The GCI will contribute to evidence-based, progressive solutions to the problems of a rapidly changing world within the existing and projected frameworks of those problems: political, environmental, technical, social, economic.
The Institute’s vision is to be an internationally respected source of knowledge for addressing the challenges of a changing world.
Mission
In achieving the vision, the GCI will investigate complex, interconnected issues in innovative ways to achieve multi-disciplinary, integrated solutions.The Institute’s mission is therefore:
“To foster discovery,learning and engagement by creating, applying and transferring knowledge for innovative and integrated solutions to address the challenges of a changing world”.

Boy talk about swallowing the Progressive Kool Aid! These guys see themselves as some sort of techno-aristocracy handing down wisdom from on high to the sheeple and saving the world. Must be some head trip to think you will be ruling the world.
This is the reason you will not see these guys climbing down from CAGW. This gives you a glimpse of ‘The Cause’ mentioned in the Climategate e-mails stated in their own words.

Frumious
December 29, 2012 12:24 pm

I believe that that they also miss attributed that quote from Winston Churchill too. Most say Mark Twain but Charles Hadden Spurgeon did in 1885, contributing the wisdom to “an old proverb”.

William
December 29, 2012 12:29 pm

In reply to Lief’s comment.
lsvalgaard says:
December 29, 2012 at 8:18 am
William says:
December 29, 2012 at 5:25 am
If I understand the mechanisms the solar magnetic cycle has been interrupted
What does that mean? As I understand the mechanisms the solar magnetic cycle behaves normally, no ‘interruption’ [depending on what you mean by that]
If my understanding of the mechanisms, what happen in the past, and what is currently happening to the sun is correct, solar cycle 24 will lead to an interruption to the solar magnetic cycle. (i.e. This is not a Maunder minimum.) The restart of the solar magnetic cycle is the hypothesized cause of a Heinrich event. You believe based on the assumed standard solar model that it is not possible for the solar magnetic cycle to be interrupted.
As I stated, there is concurrent with the cyclic Heinrich events massive cosmogenic isotope changes, an abrupt drop in planetary temperature, burn marks on the surface of the planet, and abrupt changes to the geomagnetic field. I started a quest 10 years ago looking for a physical explanation as to what causes the cyclic Heinrich event and the glacial/interglacial cycle and become sidetracked with sets of interrelated astronomical anomalies.
There is observational evidence that supports the assertion that there are significant fundamental errors in the standard solar model.
If and when there is unequivocal observational evidence that the solar magnetic cycle has been interrupted or if there are significant unexplained solar observations, there will be a something to discuss. I would expect the solar anomalies to start before there is a drop in planetary temperature. I would be very interested in your comments concerning any anomalous solar observations.
I have looked into each specialist’s deep cavern and pulled out the observational anomalies. The physics of what happens when very, very; large objects collapse is different than what is assumed. Black holes are a theoretical construct; they do not physically exist: the standard accretion disc model does not and cannot explain quasar evolution, quasar magnetic field structure, quasar jets, quasar clustering, structured ejection of material from the central galactic region, and so on. The object that forms is active not passive, it changes with time and affects the evolution and morphology of galaxies. There are 20 years of astronomical papers to support that assertion. The authors of the papers use the word anomaly, paradox, unexplained or missing mechanism to force observations to fit a pattern that should be random based on the standard models, and so on. The papers in question are at the end of the process of observation and analysis and are written by prominent specialists in each subfield.
The observational anomalies can be fit together like a jig saw puzzle, to provide an outline of the missing mechanisms.
The following is observational evidence that indicates there is something fundamental incorrect with the standard solar model.
“The Sun’s heat, generated by nuclear fusion in its core, is transported to the surface by convection in the outer third. However, our understanding of this process is largely theoretical—the Sun is opaque, so convection cannot be directly observed. As a result, theories largely rest on what we know about fluid flow and then applying them to the Sun, which is primarily composed of hydrogen, helium, and plasma.”
“Our current theoretical understanding of magnetic field generation in the Sun relies on these motions being of a certain magnitude,” explained Shravan Hanasoge, an associate research scholar in geosciences at Princeton University and a visiting scholar at NYU’s Courant Institute of Mathematical Sciences. “These convective motions are currently believed to prop up large-scale circulations in the outer third of the Sun that generate magnetic fields.”
“However, our results suggest that convective motions in the Sun are nearly 100 times smaller than these current theoretical expectations,” continued Hanasoge, also a postdoctoral fellow at the Max Plank Institute in Katlenburg-Lindau, Germany. “If these motions are indeed that slow in the Sun, then the most widely accepted theory concerning the generation of solar magnetic field is broken, leaving us with no compelling theory to explain its generation of magnetic fields and the need to overhaul our understanding of the physics of the Sun’s interior.”
http://arxiv.org/pdf/1206.3173.pdf
ANOMALOUSLY WEAK SOLAR CONVECTION (William: Based on observation not theory)

December 29, 2012 12:29 pm

Henry@Gail
You are a yankee?
Henry M
I explained here
http://wattsupwiththat.com/2012/12/28/dana-nuccitellis-holiday-trick-for-sobering-up-quick-put-a-little-less-rum-in-your-egg-nog/#comment-1185110
that the 0.8 degrees warming can be explained by the Gleisberg cycle.

Paul Vaughan
December 29, 2012 12:31 pm

Uselessly-protracted back-&-forth-silliness summary:
“As the sun moves across the sky, yin and yang gradually trade places with each other, revealing what was obscured and obscuring what was revealed.”
http://en.wikipedia.org/wiki/Yin-yang
No valuation placed on frugality.

As usual, Bill Illis provides the sensible, concise commentary.
Genuinely appreciated Bill. Thank you.

December 29, 2012 12:44 pm

Bart says:
December 29, 2012 at 11:10 am
“What is that interval?”
That of observation.

For the sunspot number that is 400 years. The result of integration over that interval is a single number.
It is called the “Hale Cycle”. That is because it is named after Hale. If it were Vukcevic’s, it would be called the “Vukcevic Cycle”.
Hale did not assign a negative sign to every other solar cycle. Vuk does. Hence the ‘cycle’ Vuk works with is not Hale’s but Vuk’s.
Alec Rawls says:
December 29, 2012 at 11:24 am
High activity -> more UV -> more interaction with stratospheric ozone (creation and destruction) warms the stratosphere while at the same time less radiation gets through to warm the surface -> altered atmospheric circulation patterns.
The problem with this is that there has been no long-term trend the past 300 years. Another problem is that some recent observations [Jeff Harder] suggests that UV varies in anti-phase with the sunspot cycle [low activity – > more UV].
vukcevic says:
December 29, 2012 at 11:24 am
lsvalgaard says:
Thus the Earth magnetic field differentiates between odd and even cycles.
CMEs don’t behave like that. There is no difference between even and odd cycles: http://www.leif.org/research/Even-Odd-Dst.png
Alec Rawls says:
December 29, 2012 at 11:58 am
The claim that persistent high levels of forcing won’t cause continued warming is WRONG.
If the forcing increases at a step and stays persistently high forever, continued warming stops, i.e. the temperature stops increasing after a while.
William says:
December 29, 2012 at 12:29 pm
If my understanding of the mechanisms, what happen in the past, and what is currently happening to the sun is correct, solar cycle 24 will lead to an interruption to the solar magnetic cycle.
What does that mean? Interruption of what? What is an ‘interruption’?

Gail Combs
December 29, 2012 12:52 pm

DirkH says:
December 28, 2012 at 3:29 pm
You had pictures of handcuffed, blindfolded children in trunks of cars on your milk cartons in America in the 80ies?
>>>>>>>>>>>>>>>>>>>>>>>>
ROTFL… No the pictures were the last pictures the parents had of the child. Walmart now has similar pictures posted on the wall behind the checkout counters.

December 29, 2012 12:59 pm

William says:
December 29, 2012 at 12:29 pm
There is observational evidence that supports the assertion that there are significant fundamental errors in the standard solar model. […]
The following is observational evidence that indicates there is something fundamental incorrect with the standard solar model.

I asked Hanasoge about that and he realizes that he went a bit ‘over the top’ and that his comments are confusing:
From: Shravan Hanasoge
I now realize it’s a bit of a confusing statement because it’s a slightly technical concept. The “rapidity” of solar rotation is defined in our context through the Rossby number: the ratio of convective velocity to the speed of rotation. It is largely thought that the Sun, in the context of Rossby number, is a slow rotator, i.e. that Coriolis forces play a very weak role in influencing convective motions. (which is actually true in the case of granulation; see also Miesch 2005, living reviews). However our results show that the convective motions are substantially weaker than previously thought, which means the Rossby number is very low and convection therefore is strongly influenced by rotation and Coriolis forces (much more so than previously thought). In that sense, the Sun is “fast rotator”.
Shravan
There is nothing fundamentally wrong with the standard solar model.
“Helioseismology, through the very accurate identification of oscillation frequencies of acoustic and fundamental modes, has clearly demonstrated that the standard solar models reproduce the behaviour of the Sun with remarkably accuracy, consistent within 1%.”
http://www.leif.org/EOS/1212-5077-Helioseismology.pdf

Gail Combs
December 29, 2012 1:27 pm

Werner Brozek says: @ December 28, 2012 at 3:35 pm
….The inverse relationship between cosmic rays and temperature definitely seems to be strong, especially with the graph with the millions of years. However it is not perfect. But then again, we cannot expect any trend to be perfect since there are many variables controlling climate and not just one.
>>>>>>>>>>>>>>>>>>>>>>>>>>>>>>>
You have to add in the oceans. The Thermohaline Circulation is something like 1600 years for the Pacific and 350 for the Atlantic. link
There is the ~1500 year Heinrich Events, Dansgaard-Oeschger Events, and Bond Cycles.
On a paper by Dr. Sebastian Lüning (includes link to paper)

The American scientists also performed a frequency analysis of the climatic fluctuations and found the characteristic cycles with periods of 1500, 90 and 60 years (Figure 3). Schmidt and his colleagues interpreted the 1500 year cycle as those that Gerard Bond described earlier. The data set also contained the 60-year cycle, which likely mirrored the Atlantic Decadal Cycle. link

And another new study

December 06, 2012 A team of scientists supported by the National Science Foundation (NSF) has identified for the first time a clear 1,500-year cycle in the far North’s surface atmosphere pressure pattern.
….When the Arctic Oscillation (AO) index is positive, surface pressure is low in the polar region. This helps the mid-latitude jet stream blow strongly and consistently from west to east, thus keeping cold Arctic air locked in the polar region. When the Arctic Oscillation (AO) index is negative, there tends to be high pressure in the polar region, weaker zonal winds and greater movement of frigid polar air into the populated areas of the middle latitudes….
link

There is Stephen Wilde’s zonal vs meridional jet stream.
One wonders if what you are seeing is an ocean circulation on the same timing as the solar variation with the increase/decrease in solar energy, especially at different wavelengths acting to ‘recharge the capacitor’ or even adding increments of energy to an already ‘charged system’ Sort of like a kid being pushed on a swing where once the oscillation is started not much energy is needed to keep it going or to increase the amplitude.
The solar cycles identified are:
11-year sunspot cycle (a.k.a. The Schwabe cycle). Where in the cycle are we now?
22-year magnetic cycle (a.k.a. the double sunspot cycle or The Hale cycle)
The Gleissberg cycle (an approx. 80 to 90 year cycle)
The de Vries cycle or Suess cycle (an approx. 205 year cycle)
The Hallstatt cycle (an approx. 2300 yr cycle)
August 2002 paper by the Russians I do not think people have seen yet.

LONG-PERIOD CYCLES OF THE SUN’S ACTIVITY RECORDED IN
DIRECT SOLAR DATA AND PROXIES

M. G. OGURTSOV1 , YU. A. NAGOVITSYN2 , G. E. KOCHAROV1 and H. JUNGNER3
1 A.F. Ioffe Physical-Technical Institute, 194021, Polytechnicheskaya 26, St.-Petersburg, Russia
Abstract. Different records of solar activity (Wolf and group sunspot number, data on cosmogenic isotopes, historic data) were analyzed by means of modern statistical methods, including one especially developed for this purpose. It was confirmed that two long-term variations in solar activity – the cycles of Gleissberg and Suess – can be distinguished at least during the last millennium. The results also show that the century-type cycle of Gleissberg has a wide frequency band with a double structure consisting of 50 – 80 years and 90 – 140 year periodicities. The structure of the Suess cycle is less complex showing a variation with a period of 170 – 260 years. Strong variability in Gleissberg and Suess frequency bands was found in northern hemisphere temperature multiproxy that confirms the existence of a long-term relationship between solar activity and terrestial climate.
5. Conclusions
Summarising results of our analysis we can conclude that:
(1) Two basic modes of long-term solar variability – the cycles of Gleissberg and
Suess – really exist at least within the last millennium, and probably during a longer
period (up to 10 000 last years). They are manifested in direct and proxy indicators
of different parameters of solar activity (sunspots, heliospheric solar modulation,
aurorae). It indicates that Gleissberg and Suess cycles are the fundamental features
of SA.

(2) The century-type solar variation – the Gleissberg cycle has not a single 80–90-year periodicity (as it was considered till now) but has a wide frequency band (50–140 years) and a complex character. More likely it consists of two oscillation modes – 50–80-years periodicity and 90–140-years periodicity. The Suess cycle is 160–260 years and the cycle is more stable and less complex, as Schove (1983) suggested.
(3) Global northern hemisphere climate has appreciable variability in the Gleissberg and Suess bands at least during the last 1000 years. It confirms an assumption that climate is modulated by SA during the corresponding time interval. The work made in this paper using modern statistical methods shows that complex analysis of all variety of direct and indirect information about SA in the past is a perspective tool for investigation of long-term variability

Seems the Russians do not agree with Dr. S.

December 29, 2012 1:47 pm

Gail Combs says:
December 29, 2012 at 1:27 pm
A team of scientists supported by the National Science Foundation (NSF) has identified for the first time a clear 1,500-year cycle in the far North’s surface atmosphere pressure pattern.
Quaternary Science Reviews
Volume 55, 8 November 2012, Pages 23–33
Invited paper
A re-examination of evidence for the North Atlantic “1500-year cycle” at Site 609
Stephen P. Obrochta, Hiroko Miyahara, Yusuke Yokoyama, Thomas J. Crowley
Ice-rafting evidence for a “1500-year cycle” sparked considerable debate on millennial-scale climate change and the role of solar variability. Here, we reinterpret the last 70,000 years of the subpolar North Atlantic record, focusing on classic DSDP Site 609, in the context of newly available raw data, the latest radiocarbon calibration (Marine09) and ice core chronology (GICC05), and a wider range of statistical methodologies. A ∼1500-year oscillation is primarily limited to the short glacial Stage 4, the age of which is derived solely from an ice flow model (ss09sea), subject to uncertainty, and offset most from the original chronology. Results from the most well-dated, younger interval suggest that the original 1500 ± 500 year cycle may actually be an admixture of the ∼1000 and ∼2000 cycles that are observed within the Holocene at multiple locations. In Holocene sections these variations are coherent with 14C and 10Be estimates of solar variability. Our new results suggest that the “1500-year cycle” may be a transient phenomenon whose origin could be due, for example, to ice sheet boundary conditions for the interval in which it is observed. We therefore question whether it is necessary to invoke such exotic explanations as heterodyne frequencies or combination tones to explain a phenomenon of such fleeting occurrence that is potentially an artifact of arithmetic averaging.
Seems the Russians do not agree with Dr. S.
As long as they use the obsolete Wolf number and Group Numbers no agreement can be expected.

Gail Combs
December 29, 2012 1:49 pm

Camburn says:
December 28, 2012 at 6:30 pm
The whole premise of what the models are based on needs to be examined….
>>>>>>>>>>>>>>>>>>>>>>>>>
Here is the premise:
the IPCC mandate states:

The Intergovernmental Panel on Climate Change (IPCC) was established by the United Nations Environmental Programme (UNEP) and the World Meteorological Organization (WMO) in 1988 to assess the scientific, technical and socio-economic information relevant for the understanding of human induced climate change, its potential impacts and options for mitigation and adaptation.
http://www.ipcc-wg2.gov/

As Mosher stated in another thread, the climate models keep CO2 forcing constant and fiddle with everything else – aerosols are the current play toy – to get some sort of agreement with reality.

Gail Combs
December 29, 2012 1:58 pm

Scute says:
December 28, 2012 at 7:01 pm
What follows is complicated. My apologies for that but spin is only as complicated in its unraveling as it was in its raveling….
>>>>>>>>>>>>>>>>>>>>>>>>>>>
Thank you for making that point. People at WUWT often forget others may not have read several years worth of posts as background.

December 29, 2012 2:12 pm

gail says
http://wattsupwiththat.com/2012/12/28/dana-nuccitellis-holiday-trick-for-sobering-up-quick-put-a-little-less-rum-in-your-egg-nog/#comment-1185428
henry says
excellent comment, as usual, from Gail.
there are more people not agreeing with Dr. S.
I have determined the whole Gleisberg cycle and find it explains all modern warming.
(hint to Dr. S: look at maxima rather than the (noisy) means)
According to my own analysis of 47 weather stations, we will be cooling in the next 35 years:
http://blogs.24.com/henryp/2012/10/02/best-sine-wave-fit-for-the-drop-in-global-maximum-temperatures/
and indeed it is this global cooling that is generally causing more rain, more snow and cooler weather, globally, on average.
(Remember also that when water vapour in the atmosphere cools more, you get more clouds and more precipitation, at certain places).
As the farmers in Anchorage have noted,
http://www.adn.com/2012/07/13/2541345/its-the-coldest-july-on-record.html
the cooling is so bad there that they do not get much of any harvests.
And it seems NOBODY is telling them there that it is not going to get any better. The cooling will last until 2030-2040. See here:
http://wattsupwiththat.com/2012/11/19/cooling-in-the-near-future/
The sad story is, that as we enter 2013, and where the world should prepare itself for climate change due to (natural) global cooling,
for example, by initiating more agricultural schemes at lower latitudes (FOOD!),
and providing more protection against more precipitation at certain places (FLOODS!),
the media and the powers-that-be are twiddling with their thumbs, not listening to the real scientists,
e.g. those not making any money and nice journeys out of the gravy train that “global warming” has become
Wishing you all God’s richest wisdom for 2013!!
Henry

December 29, 2012 2:14 pm

Alec Rawls says:
December 29, 2012 at 2:02 pm
So Leif has insisted many times, but other scientists disagree. Leif himself has previously lauded Steinhilber’s TSI reconstruction.
Check out their Figure 1d in the first paper you cite
and Figure 7 in the 2nd paper. No trend.
The Steinhilber paper has these statements:
“Our estimated difference between the MM and the present is smaller by a factor of 2-4 compared
to records [Lean et al., 1995; Lean, 2000] that have been used in climate model studies.”
Implying a much smaller trend than people assume.
the rather small forcing by TSI changes may still be a problem. The UV irradiance may not be the viable solution because its observational data do not show a similar distinct decreasing trend as TSI [Frohlich ¨ , 2009], implying that its level during the MM was similar as in present solar cycle minima.
Thus no trend.
When you cite, perhaps include the whole truth.

December 29, 2012 2:20 pm

Seems an opportune time for a reminder:
http://climaterealists.com/attachments/ftp/How%20The%20Sun%20Could%20Control%20Earths%20Temperature.pdf
“How The Sun Could Control Earth’s Temperature”
Note that I have subsequently shifted my focus to particle and wavelength variations in general rather than solar protons.
Also that a reverse sign response to solar variations is suggested which deals with one of Leif’s objections and accords with recent findings mentioned by Jo Haigh.
To get the observed climate zone shifting we really need less ozone and a cooling stratosphere when the sun is active and the opposite when the sun is inactive.
If the sun stays quiet I expect confirmation or rebuttal within a year or two.

December 29, 2012 2:20 pm

Alec Rawls says:
December 29, 2012 at 2:02 pm
My favorite part? In the caption they join Usoskin in calling the high 20th century levels of solar activity a “grand solar maximum.” Heh. Hard to herd the cats isn’t it?
Science is self-correcting so their little sleight of hand will disappear. Slides 4 and 5 of
http://www.leif.org/research/The%20long-term%20variation%20of%20solar%20activity.pdf tell the story. They use the heliospheric magnetic field as their parameter but omitting data before 1900 even as they agree with our reconstruction [shown of slide 4 and ‘blown up’ to match on slide 5].

Gail Combs
December 29, 2012 2:25 pm

markx says:
December 28, 2012 at 8:55 pm
Alec Rawls said of Dana’s view of the physics involved: [Dana’s view is that] If you leave a pot of water on a steady flame it won’t heat. If you want to heat the water you have to keep turning the flame up….. ”
Very nice analogy …. and Dana has to acknowledge this is one freaking big pot of water……. and that he keeps telling how small is the solar forcing, but posits a theory of instant response.
>>>>>>>>>>>>>>>>>>>>>>>>>>>>
Yes that is another sleight of hand. the Delta in solar forcing is small in Wm^2 but then you have to multiply it by the 70% surface area of the ocean. Also the ocean is not effected byCO2 IR wavelengths (penetrate 10 microns) but is the most sensitive to shorter wavelengths in the visible and UV range where the sun DOES vary.
How anyone can look at the following four graphs and honestly think CO2 has much of anything to do with the climate much less is the ‘climate control knob’ completely floors me. That it is Universities and ‘World Class’ scientists stuns me. It also convinces me we need a very though house cleaning by withdrawing all grant money.
graph 1
graph 2
graph 3
graph 4

vukcevic
December 29, 2012 2:27 pm

Dr. Svalgaard
CMEs don’t behave like that. There is no difference between even and odd cycles:
NASA thinks differently, and I assume they know what they are talking about
“We’re entering Solar Cycle 24. For reasons not fully understood, CMEs in even-numbered solar cycles (like 24) tend to hit Earth with a leading edge that is magnetized north. Such a CME should open a breach and load the magnetosphere with plasma just before the storm gets underway. It’s the perfect sequence for a really big event.”
http://science.nasa.gov/science-news/science-at-nasa/2008/16dec_giantbreach/
and indeed the data confirm the difference is transmitted to the climate’s natural variability:
http://www.vukcevic.talktalk.net/NV.htm

Gail Combs
December 29, 2012 2:44 pm

E.M.Smith says:
December 28, 2012 at 9:18 pm
…..Personally, I’ll take the snow cover as my guide. As of now, we’ve got more % snow cover in the USA than last year and we’ve only just started winter.
We’ve go snow all the way down to Dallas, Texas. We’ve got glaciers growing on Mt. Shasta. We’ve got Russia and China in a frozen meat locker. We’ve got N. Hemisphere snow above the ‘climatology’ average. ( I’m sure we’re going to be told “But it’s a WARM snow!” 😉
http://moe.met.fsu.edu/snow/
>>>>>>>>>>>>>>>>>>>>>>>>
I find the month of October N. Hemisphere snow data enlightening. This gives an indication of whether or not the growing season is shortening:
http://www.ncdc.noaa.gov/sotc/service/global/snowcover-nhland/201210.gif
The length of the Arctic melt season has shortened the last five years too.
http://i45.tinypic.com/27yr1wy.png
No one really mentions the record lows.
http://devconsultancygroup.blogspot.co.uk/2012/11/cold-wave-roundup-record-temperature.html
http://www.washingtonpost.com/blogs/capital-weather-gang/post/coldest-january-on-record-for-parts-of-alaska/2012/01/31/gIQAQVyIfQ_blog.html
For climate scientists to continue to ignore, hide and sweep under the rug this type of information borders on criminal because of its impact on food production.

December 29, 2012 2:51 pm

Alec Rawls says:
December 29, 2012 at 2:39 pm
Leif seems to be misreading the SOD on Harder 2009.
I read Harder not SOD on Harder.
The unexpected variation of UV [which is not certain at all – difficult measurements!] even prompted the modellers to consider what would happen if indeed UV and solar activity were out-of-phase:
http://lasp.colorado.edu/sorce/news/2011ScienceMeeting/docs/presentations/6b_Cahalan_Sedona_9-15-2011.pdf
My own take is that the Harder ‘effect’ is due to calibration problems and will go away with better data.

December 29, 2012 2:58 pm

December 29, 2012 at 2:56 pm
vukcevic says:
December 29, 2012 at 2:27 pm
NASA thinks differently, and I assume they know what they are talking about
It seems not.
“We’re entering Solar Cycle 24. For reasons not fully understood, CMEs in even-numbered solar cycles (like 24) tend to hit Earth with a leading edge that is magnetized north. Such a CME should open a breach and load the magnetosphere with plasma just before the storm gets underway. It’s the perfect sequence for a really big event.”
‘should’? When you look at 100 years of data you find that there is no difference between even and odd cycles as far as the impact of CMEs is concerned: http://www.leif.org/research/Even-Odd-Dst.png so the expectation is wrong.

Nick Kermode
December 29, 2012 2:58 pm

So does this mean climate sensitivity is higher or lower than thought before this “discovery”?

Ian Holton
December 29, 2012 3:07 pm

“Geomagnetic activity has had no trend since 1844: http://www.leif.org/research/Ap-1844-now.png
(Leif)
Leif, looks clearly to me that it was lower mean from approx 1876 to 1929 and higher mean from 1930 to 2003

bones
December 29, 2012 3:17 pm

Alec Rawls says:
“According to Bones:
the bottom line is that ocean surface temperatures mostly adjust very quickly to solar flux changes.
But as he himself notes, heat transfer in and out of deeper ocean layers can take much longer, and as deeper layers warm, that will reduce the heat loss from the upper ocean layer, causing it to continue to warm in response to a long term increase in forcing. The claim that persistent high levels of forcing won’t cause continued warming is WRONG.”
The idea that warming of deeper ocean layers layers will reduce the rate of heat loss from the upper ocean layers is what is WRONG here. It may be a surprise to Alec, but there is very, very little heat loss from the first 100 meters of the ocean to greater depths. With thermal conductivity of about 6 watt/m/C and a temperature gradient of about 0.025 C/m. the rate of heat loss to lower depths is thus of the order 0.15 watt per square meter, compared to something like a net 170 watt per square meter of UV-VIS absorbed in the first 100 meters, on global average (and half of that in the first 25 meters). Thus nearly all of that 170 watt/m^2 is radiated back out from the surface. Consequently, the surface temperatures respond to solar flux changes on the thermal relaxation time scale of the upper ocean layers. Further, the heat that makes it to depths below 100 meters essentially won’t be coming back. Only in the polar regions are there places cold enough to be warmed by transport of that heat to a colder place. As I noted previously, the thermal time constant for the first hundred meters is about 3 years and thermal relaxation is essentially complete after about 3 such periods.
I will be happy to discuss this issue in considerable mathematical detail with any interested parties. For a change, q, of solar flux from a thermal equilibrium value, that increases linearly with time while producing no other changes of cloud cover or wind speeds or patterns, the surface temperature increase and thermal time constant are given here:
http://i1244.photobucket.com/albums/gg580/stanrobertson/ocean-eq.jpg

Gail Combs
December 29, 2012 3:22 pm

lsvalgaard says:
December 29, 2012 at 1:47 pm
…..Seems the Russians do not agree with Dr. S.
As long as they use the obsolete Wolf number and Group Numbers no agreement can be expected.
>>>>>>>>>>>>>>>>>>>>>>>>>
They are not.
I find it quite interesting that you are rewriting historical data just as Hansen does with temperature data.

December 29, 2012 3:28 pm

Alec Rawls says:
December 29, 2012 at 2:39 pm
UV-shift effects is one obvious candidate, so the NewScientist actually belittles TWO of the main candidates for this unidentified solar amplification mechanism
The Steinhilber et al. paper you cite, ends with “The UV irradiance may not be the viable solution because its observational data do not show a similar distinct decreasing trend as TSI [Frohlich ¨ , 2009], implying that its level during the MM was similar as in present solar cycle minima.
So you will quote selectively and omit what you don’t like.
Ian Holton says:
December 29, 2012 at 3:07 pm
Leif, looks clearly to me that it was lower mean from approx 1876 to 1929 and higher mean from 1930 to 2003
Yes, but was higher before 1876 and lower after 2003, adding up to no overall trend. The straight line is the least-square trend [there isn’t any].

vukcevic
December 29, 2012 3:54 pm

Dr. Svalgaard disagree
…………..:
As long as it is in the data, I am not really much concerned if you agree or not.

December 29, 2012 3:58 pm

Gail Combs says:
December 29, 2012 at 3:22 pm
“As long as they use the obsolete Wolf number and Group Numbers no agreement can be expected.”
They are not.

They say they are: “Different records of solar activity (Wolf and group sunspot number)”
I find it quite interesting that you are rewriting historical data just as Hansen does with temperature data.
I am not ‘rewriting’ the historical data. The whole sunspot community [some 60 experts on this] are doing this, as it should be done when errors have been identified. Wolf himself did that several times. Wolfer did the same in 1902. Hoyt and Schatten did in 1994. Hugh Hudson summarizes the work of the 1st and 2nd SSN workshops thus
“Conclusions I
• The modern work on SSN has been wonderful, establishing its reproducibility and precision
• The older SSN records need rationalization
• This group needs to take charge of the perception of SSN:
– Consensus
– Public databases and ample publications
– Propaganda that discredits any research not using the consensus SSN ”
We have recruited scientists with a variety of expertise/opinions on re-calibration/reconciliation of the SSN. In addition, at each workshop we have invited knowledgeable senior scientists as reviewers to provide critiques and offer guidance. Re-calibrating the sunspot number is a topic whose time has time. It can no longer be ignored – the discrepancies are too large and the applications (solar dynamo, climate change, space weather and climate) too prominent. Our efforts to re-calibrate the SSN have met with some resistance already, primarily from people with vested interest in the status-quo [are you one of those?]

December 29, 2012 4:03 pm

Alec Rawls says:
December 29, 2012 at 3:59 pm
That Figure 1d looks approximately like the temperature record for the same period.
To substantiate that would you plot the temperature record on Figure 1d?
And there is no Grand Maximum in the 20th century, no matter what they call it.

December 29, 2012 4:15 pm

Alec Rawls says:
December 29, 2012 at 3:59 pm
When solar activity rose to what Usoskin, Steinhilber and Lockwood call “grand maximum” levels from the 1920 on, it got warmer.
Here is what Usoskin call the Modern Grand Maximum http://www.leif.org/research/Extreme-MGM.png [pink oval]. compare that the green oval where TSI [actually 10Be] was similar to what it is today. And you can see the error.

December 29, 2012 4:17 pm

vukcevic says:
December 29, 2012 at 3:54 pm
As long as it is in the data, I am not really much concerned if you agree or not.
but since it is not in the data http://www.leif.org/research/Even-Odd-Dst.png
you are committing scientific fraud by claiming it is.

Green Sand
December 29, 2012 4:42 pm

At present I am only sure of one fact. In the morning the sun will rise, will I see it? Don’t know. If I am alive the chance of observation increases, but it is no guarantee. Things get in the way, they exist, between me and my external source of energy. All I know is if I can see the sun I am warmer than if I cannot. I know that walls, (I grow fruit) retain more warmth the longer they are exposed to the sun.
Have a look at a few charts courtesy of the UKMO, they are only the UK, but that is where I am:-
http://www.metoffice.gov.uk/climate/uk/actualmonthly/
Have a play, look at “UK Temperature” and “UK Sunshine Hours”.
Then figure out does an increase in sunshine hours lead to higher temperatures or do higher temperatures lead to more sunshine hours?
I do hope to see and feel the warmth of the sun tomorrow!

December 29, 2012 4:57 pm

Alec Rawls says:
December 29, 2012 at 4:30 pm
you jumping on me for not digging some bit of counter evidence out of one of dozens of papers on the subject?
I’m pointing to a paper you just cited, not dozens of others.
I’m not claiming certainty about, but you seem to be. It can’t be X. It can’t be Y.
If the data does not support Z, it can’t be Z. Here, I spared you the work:
http://www.leif.org/research/Global-Temp-TSI-Since-1600.png
Remember that ‘TSI’ here just means any and all of the solar indicators that all vary very much the same.
Given the state of the evidence, GCR and UV most certainly are possible mechanisms
For an effect that doesn’t exist. Any mechanism will work.

u.k.(us)
December 29, 2012 5:29 pm

lsvalgaard says:
December 29, 2012 at 4:17 pm
===============
Scientific fraud, seems a bit harsh.
Open data, may reveal mistakes.
As we try to make sense of a nonsensical data stream.
We’re hard-wired that way.

vukcevic
December 29, 2012 5:39 pm

– Is Dr. Svalgaard as the premier solar scientist aware of spectral composition of the geomagnetic Aa index?
– Of course he is.
http://www.vukcevic.talktalk.net/HC.htm
– Does Aa index show Hale Cycle component?
– Of course it does
– How and where is Aa index measured?
– The Aa index data have been derived by two antipodal sites, originally Greenwich and Melbourne but now their nearest replacements. The daily values are formed from an average of the 8 three-hourly values.
– Is there any similarity between Aa index and the Earth’s magnetic field spectra?
– Yes, for periods above 14 years, spectra are very similar and both have Hale cycle component.
– Why is Dr. Svalgaard denying that the Hale cycle is perceptible on the Earth’s surface?
– You have to ask Dr. Svalgaard.

Gail Combs
December 29, 2012 5:44 pm

lsvalgaard says:
December 29, 2012 at 3:58 pm
I am not ‘rewriting’ the historical data. The whole sunspot community [some 60 experts on this] are doing this…..Our efforts to re-calibrate the SSN have met with some resistance already, primarily from people with vested interest in the status-quo [are you one of those?]
>>>>>>>>>>>>>>>>>>>>>>>>>>>
I am a Quality Engineer/Chemist who has great respect for data. I have been fired more than once for refusing to change data as directed by my boss.
From the Climategate e-mails we have seen what lengths the ‘Climate Science Community’ will go to to protect ‘The Cause’. Jo Nova, E.M. Smith, Digging-in-the-Clay and Anthony have documented the activities of the ‘Climate Science Community’ with regards to temperature.
Then there is the CO2 measurements. Again we see what was done by the ‘Climate Science Community’ to the historic data when Callender and Keeling tossed any data points they did not like. link The fact that Dr. Jaworowski, a World Class scientist was denied funding and fired makes it clear those who dissent are punished.

…in 1994 Dr. Jaworowski, together with a team from the Norwegian Institute for Energy Technics, proposed a research project on the reliability of trace-gas determinations in the polar ice. The prospective sponsors of the research refused to fund it, claiming the research would be “immoral” if it served to undermine the foundations of climate research.….
…in a peer-reviewed article published by the Norwegian Polar Institute, Dr. Jaworowski criticized the methods by which CO2 levels were ascertained from ice cores, and cast doubt on the global-warming hypothesis….. Said one prominent critic, “this paper puts the Norsk Polarinstitutt in disrepute.” Although none of the critics faulted Dr. Jaworowski’s science, the institute nevertheless fired him to maintain its access to funding.
http://www.canada.com/nationalpost/news/story.html?id=25526754-e53a-4899-84af-5d9089a5dcb6

Here at WUWT we have seen the ridiculous lengths ‘scientists’ and universities will go in the pursuit of grant funding including a contrived paper that equates skeptics with real loony-tunes and finally a guy with a degree in PHYSICS (yeah Parncutt) calling for a law making climate skepticism punishable by death.
Now you want me to believe there are SIXTY solar scientists out there who are not bit with the Skeptical Science Syndrone bug??? And it just so happens that the ‘adjustments’ to the historical data they are making iron the sun’s variability flat so the IPCC can then point to your data and say SEE it ain’t the sun.
Yeah right.

Manfred
December 29, 2012 6:50 pm

Hi Leif Svalgaard, two more questions:
1. You have been discussing these issues for a long time. See here, for example, from 2008:
http://climateaudit.org/2008/01/30/svalgaard-3/
“When it was believed that TSI was significantly lower and that the solar magnetic field [HMF] was near zero during the MM, it might have been a good bet to say that there is a causal link between MM and LIA. Now, that there is a strong possibility that TSI and the HMF were not at those lows, we can only still believe that MM caused LIA if we postulate either 1) unknown other causes and/or 2) extreme sensitivity of climate to solar activity.”
I think you have changed your mind about the solar magnetic field during the Maunder Minimum (MM), what was wrong with the previous assumption ?
2. If the sun is not considered to be a primary climate driver, what may have caused the warm periods during the last 9000 years. Is there anything at all (except the solar amplification mechanism) in the IPCC report that could explain those fast recoveries from several episodes of little ice age like temperatures ?
http://www.scinexx.de/redaktion/focus/bild6/stalagmit3g.jpg

markx
December 29, 2012 7:05 pm

Gail Combs says: December 29, 2012 at 2:25 pm
“..It also convinces me we need a very though house cleaning by withdrawing all grant money…”
I often face statements that I am arguing that “all the world’s climate scientists must be involved in a huge conspiracy”.
When in fact (as you pointed out elsewhere) with the magnificent vision of carbon trading before them, all governments and financial institutions immediately recognize an opportunity to do what they do best, make money out of other peoples’ money going past.
And they know (re scientific research) that they get that which they fund, and so they fund the ‘science’ they want to see.
No conspiracies needed. Supply and demand at work…. (money, in this case).
Science funding and research grants are still needed …. we just need to be careful it is not part of a system that automatically points everything in the one direction.
And I don’t have an answer on how we do that!

December 29, 2012 7:26 pm

Leif, is there a particular reason that the data here http://www.leif.org/research/Ap-1844-now.png starts in 1844? Why would a linear trend (of zero) from such an early starting point have any relevance to recent temperature changes (i.e. the past 40 years or even the past 100)?

December 29, 2012 8:20 pm

vukcevic says:
December 29, 2012 at 5:39 pm
– Does Aa index show Hale Cycle component?
– Of course it does
As I explain in section 9 of http://www.leif.org/research/suipr699.pdf and in secion 5 of http://www.leif.org/research/Semiannual-Comment.pdf
there is a very weak
22-yr cycle in geomagnetic activity [discovered by Ed Chernosky in 1966] and which is reasonably well understood.
Except it is not a Hale cycle component as the period goes from solar max to solar max [thus not in phase with the sunspot cycle]. The weak variation can be found in geomagnetic storms as well http://www.leif.org/research/Plus-Minus.Dst.png
What is wrong with your assertion is, that this is a primary or dominant cycle. It is not, it is a hard to discover 2nd-order effect.
You started out by postulating that the Earth was causing the different shapes of the cosmic ray variation, then when that didn’t work, then you claimed CMEs showed a 22-yr cycle [which I showed you it didn’t]. You really have no idea what is going on.

December 29, 2012 8:42 pm

Gail Combs says:
December 29, 2012 at 5:44 pm
And it just so happens that the ‘adjustments’ to the historical data they are making iron the sun’s variability flat so the IPCC can then point to your data and say SEE it ain’t the sun.
It would help if you would actually read the papers on this. It is not hard. The problem starts in the 1940s when Waldmeier began to count larger spots more than once [up to five times dpending on size]. He even writes so specifically. The effect of that is a 20% increase of the sunspot number. When we noticed that a few years back, we began to ALSO count each spot only once as was done before 1945. Even the current observers on which the modern sunspots are based participated in the counting and we and they have conclusively shown that the double [or more] counting of spots contaminates the sunspot number making all number later than 1945 too large by 20%. The simplest way to correct for this known contamination is to increase all the old numbers by 20%. Even you could figure that out, if you took the trouble: http://www.leif.org/research/Reconstruction%20of%20Sunspot%20Number.pdf
or simply count the spots on today’s drawing: http://www.specola.ch/drawings/2012/loc-d20121229.JPG and compare with what the observer has for each gropu [given at the upper right]. Tell us here how many spots you count.
Yeah right.
Yes, RIGHT!
Manfred says:
December 29, 2012 at 6:50 pm
I think you have changed your mind about the solar magnetic field during the Maunder Minimum (MM), what was wrong with the previous assumption ?
I don’t think so.
2. If the sun is not considered to be a primary climate driver, what may have caused the warm periods during the last 9000 years. Is there anything at all (except the solar amplification mechanism) in the IPCC report that could explain those fast recoveries from several episodes of little ice age like temperatures ?
If the Sun can have those random fluctuations, then why can’t the Earth’s climate?
eric1skeptic says:
December 29, 2012 at 7:26 pm
Leif, is there a particular reason that the data here http://www.leif.org/research/Ap-1844-now.png starts in 1844?
That is when the data with hourly [or better] resolution starts [there are some for a few years before, but we have not been able to dig them up yet].
Why would a linear trend (of zero) from such an early starting point have any relevance to recent temperature changes (i.e. the past 40 years or even the past 100)?
If there is no trend over 170 years but there is a trend in climate, the argument that the sun is responsible weakens.

December 29, 2012 8:44 pm

vukcevic says:
December 29, 2012 at 5:39 pm
– Does Aa index show Hale Cycle component?
– Of course it does

As I explain in section 9 of http://www.leif.org/research/suipr699.pdf and in section 5 of http://www.leif.org/research/Semiannual-Comment.pdf
there is a very weak 22-yr cycle in geomagnetic activity [discovered by Ed Chernosky in 1966] which is reasonably well understood.
Except it is not a Hale cycle component as the period goes from solar max to solar max [thus not in phase with the sunspot cycle]. This weak variation can be found in geomagnetic storms as well http://www.leif.org/research/Plus-Minus-Dst.png
What is wrong with your assertion is, that this is a primary or dominant cycle. It is not, it is a hard to discover 2nd-order effect.
You started out by postulating that the Earth was causing the different shapes of the cosmic ray variation, then when that didn’t work, you claimed CMEs showed a 22-yr cycle [which I showed you it didn’t]. You really have no idea what is going on.

pkatt
December 29, 2012 9:51 pm

We can argue about Earth all day.. but other planets of our Solar system are exhibiting signs of climate changes as well. Mars ice caps, Jupiter’s southern stripe ect ect ect.. The evidence is there for all to see but only for those who do not refuse to see it. There is research out for years on the effects of solar events on our sister planets but the entire its not the sun crowd refuses to acknowledge any of it because it is completely inconvenient of the other planets to cause discord in their perfect little theory. . Its a consensus science now, such a shame. Heres a thought though, if you have to change the data from the past to fit your present theory.. YOU SUCK.

Manfred
December 30, 2012 12:41 am

lsvalgaard says:
December 29, 2012 at 8:42 pm
Manfred says:
December 29, 2012 at 6:50 pm
I think you have changed your mind about the solar magnetic field during the Maunder Minimum (MM), what was wrong with the previous assumption ?
I don’t think so.
——————————————-
You didn’t think the heliospheric magnetic field strength was “near zero” during the Maunder Minimum. So is this still your opinion ?. How would you define “near zero” and what are your expectations for the AP index in case of a new MM ? Thanks.
http://www.leif.org/research/Heliospheric%20Magnetic%20Field%201835-2010.pdf

Henry Clark
December 30, 2012 12:51 am

The one and only graph directly displayed in the article here is dishonest garbage of fudged data, on both false cosmic ray trends and on choosing the most heavily fudged temperature set around (Hansen’s). It is disappointing that a skeptic like Alec Rawls helps the CAGW propagandists in prominent visual presentation. Having passing comments in text, with buried links to other graphs not so prominently displayed, does not remotely make up for such, as maybe several percent at most of readers will click on them.
However, for anybody who wades through the sea of falsehoods and reads this who has not before (even though my deeply buried comment here will only lead a few, if any, to truth, for every hundred misled by the prominently displayed graph):
No sharp decline in solar deflection of cosmic rays started in the early 1980s, in contrast to the disgustingly false graph. On the contrary, solar cycle 22 (September 1986 to May 1996) averaged a neutron count rate of about 5992 as verifiable at [ref. 1] (link given at end of comment), which was essentially identical as an average to how the prior solar cycle 21 (June 1976 to September 1986) had an average neutron count rate of 5991 ([ref. 2]).
The big picture, including a major rise in solar activity for those cycles relative to weak solar cycle 20 (1964-1976) of the prior global cooling scare period, can be seen in http://s10.postimage.org/l9gokvp09/composite.jpg (click to enlarge).
Overall, the 20th century had much higher solar activity than the prior century, as may be particularly illustrated by using a metric exceptionally difficult to fudge into flatness: Shorter solar cycles tend to be more intense, and the average solar cycle length over 1901 to 1996 was 10.5 years, compared to the slower weaker cycles averaging 11.5 years each over the prior century from 1798 to 1901 ( ftp://ftp.ngdc.noaa.gov/STP/SOLAR_DATA/SUNSPOT_NUMBERS/docs/maxmin.new ).
Additional illustrations including cosmic ray trends versus clouds (including correlation with Forbush events) are in http://s13.postimage.org/ka0rmuwgn/gcrclouds.gif .
[ref. 1]
http://cosmicrays.oulu.fi/webform/query.cgi?startday=1&startmonth=09&startyear=1986&starttime=00%3A00&endday=1&endmonth=5&endyear=1996&endtime=23%3A30&resolution=Automatic+choice&picture=on
[ref. 2]
http://cosmicrays.oulu.fi/webform/query.cgi?startday=1&startmonth=06&startyear=1976&starttime=00%3A00&endday=1&endmonth=9&endyear=1986&endtime=23%3A30&resolution=Automatic+choice&picture=on

vukcevic
December 30, 2012 12:57 am

Dr. Svalgaard
– I wrote Hale cycle is a primary period in the Earth’s magnetic field.
-You wrote and implied that I said it is primary cycle in the Aa index, when you know I have not
There is a mismatch between of what you read and what you wrote, I even linked the graph showing exactly the relationship.
http://www.vukcevic.talktalk.net/HC.htm
you said: When you look at 100 years of data you find that there is no difference between even and odd cycles as far as the impact of CMEs is concerned
you said: but since it is not in the data you are committing scientific f… by claiming it is.
then after seeng above link you said: The weak variation can be found in geomagnetic storms as well
Hey, being accused of scientific misdeed (WUWT doesn’t like the f word) by someone changing data left, right and centre, it’s more sign of the weakness of your case. You first deny, than when confronted by the data, you haven’t managed to change as yet, you pull back a bit..
It is becoming not only tedious but a waste of time, when number of people have to point to you, that what they wrote and the interpretation you put on it, are very often two different things.
It appears that many other readers too, don’t take you your statements any more with full confidence, you once enjoyed, and that is really a pity.
The agenda that sun doesn’t affect climate, one way or the other, whatever the mechanism/s may be, is becoming less and less convincing.

December 30, 2012 2:21 am

I hate to say it, but this is the first GCR explanation I’ve really understood. Obviously if there is a lag (2.75 years – Lockwood) on solar effects, there must also be some lag on GCR. While there’s a slight statistical rise from 1991 to 2001, serious increase in GCR doesn’t start occurring until 2007. My thought is that even if the mechanism is not proven, the correlation between sunspots and temperature forcing is way too strong to be ignored.
The second prong of the agenda strategy to ignore solar forcing is the commonly reported mistake that the TSI was lowest in the second half of the 20th century, and that SC 23, being the lowest of the series did not immediately lead to cooling, thereby disproving that there is any solar effect on climate.

TimTheToolMan
December 30, 2012 2:58 am

Leif writes “Except that the solar parameters that might influence the stratosphere have not shown any long-term trend the past 300 years. That is the key point.”
We only have a few years of SIM data Leif and that showed considerable variation. We simply dont know whether there is any trend in the variance or not. There’s not hiding from it, if the variation is real then its a potential game changer and could be the answer to “some solar influence” that the AR5 points at.
Meanwhile you categorically rule out the sun as a driver because of (lack of) TSI trends. I dont understand your reasoning. Or at least your certainty…

December 30, 2012 3:04 am

vukcevic says:
December 30, 2012 at 12:57 am
– I wrote Hale cycle is a primary period in the Earth’s magnetic field.
-You wrote and implied that I said it is primary cycle in the Aa index, when you know I have not

Here is what you wrote:
vukcevic says:
December 29, 2012 at 6:55 am
Climate’s Natural Variability is a direct consequence of the interaction between the Solar magnetic cycles and the geomagnetic input (backed by data from NOAA, SIDC and ETHZ).
– 21.3 years (Hale cycle) period is the primary component in the both solar and Earth magnetic variability

Now you are denying that the Aa index is related to solar magnetic cycles…
In a weak sense you are correct, as the weak 22-yr variation in the Aa index is a geometric effect related to the aspect of the Earth in the solar wind.
then after seeing above link you said: The weak variation can be found in geomagnetic storms as well
I said that back in 1978 and explained the physics that makes that happen. The plot was to show you how insignificant the 22-yr variation is.
It appears that many other readers too, don’t take you your statements any more with full confidence, you once enjoyed
Unlike you, I’m not fishing for approval.
pkatt says:
December 29, 2012 at 9:51 pm
Heres a thought though, if you have to change the data from the past to fit your present theory.. YOU SUCK.
Same comments as to Gail: take the trouble to look for yourself. Go count the spots on http://www.specola.ch/drawings/2012/loc-d20121229.JPG
Tell me how many you see. The official number is 20. If you don’t go and look and report here what you see, guess who sucks?
Manfred says:
December 30, 2012 at 12:41 am
You didn’t think the heliospheric magnetic field strength was “near zero” during the Maunder Minimum. So is this still your opinion ?. How would you define “near zero” and what are your expectations for the AP index in case of a new MM ?
I thought then and think now that the heliospheric magnetic field strength was about 4 nT [about the same as it was in 2009]. So for Ap, I would expect the same as for 2009: 4 [coincidence that it is 4 in both cases], for aa about 8 [aa is measured in nT, ap in units of 2 nT]. I consider those numbers good to about one unit, so can live with 3 nT. Since I don’t think the field was ‘near zero’, I don’t need to define ‘near zero’.

December 30, 2012 3:14 am

vukcevic says:
December 30, 2012 at 12:57 am
the data, you haven’t managed to change as yet
BTW, I have managed to changed the aa-index: it is now generally accept that aa is wrong before 1957 and must be corrected by adding 3 before that year, see Figures 13 and 14 of http://www.leif.org/research/2007JA012437.pdf

Paul Vaughan
December 30, 2012 3:42 am

vukcevic (December 30, 2012 at 12:57 am) wrote:
“It is becoming not only tedious but a waste of time, when number of people have to point to you, that what they wrote and the interpretation you put on it, are very often two different things.
It appears that many other readers too, don’t take you your statements any more with full confidence, you once enjoyed, and that is really a pity.
The agenda that sun doesn’t affect climate, one way or the other, whatever the mechanism/s may be, is becoming less and less convincing.”

His credibility is toast vukcevic. Whatever he may know about the sun, he’s darkly ignorant &/or deceptive about the macroscopic properties of terrestrial atmospheric circulation and quantitative methods that reveal them. His dark solar-terrestrial-climate narrative is STRICTLY INADMISSIBLE in the blinding light of earth rotation observations that are well-constrained by the laws of large numbers and conservation of angular momentum. With this one severely egregious offense he has forfeited the moral authority to comment on climate at all. Additionally, the incessant protracted negative public harassment & authoritarian internet bullying raises deep, deep concerns about Stanford’s apparent lack of sensible ethical standards.
My tolerance of this man’s dark ignorance &/or deception has completely expired. I recommend that either he be banned from commenting on climate or that strong restrictions be placed on his insufferable behavior.
Sincerely,
Paul L. Vaughan, B.Sc., M.Sc.

December 30, 2012 3:48 am

TimTheToolMan says:
December 30, 2012 at 2:58 am
We only have a few years of SIM data Leif and that showed considerable variation. We simply dont know whether there is any trend in the variance or not. There’s not hiding from it, if the variation is real then its a potential game changer and could be the answer to “some solar influence” that the AR5 points at.
Whatever the measurements of SIM says, we have another monitor of UV, namely the Earth itself. UV creates the ionosphere. The day-night cycle results in an electric current about 110 km up. This current has a [small] magnetic effect which we can measure on the ground [was discovered in 1722 by George Graham]. We have kept track of that ever since and the result is that the UV radiation from the Sun [whatever its variability within a cycle is] does not have any long-term trend since then.
Meanwhile you categorically rule out the sun as a driver because of (lack of) TSI trends. I dont understand your reasoning. Or at least your certainty…
My reasoning [at least as far as SIM and UV are concerned] is as just described.

December 30, 2012 4:12 am

Paul Vaughan says:
December 30, 2012 at 3:42 am
My tolerance of this man’s dark ignorance &/or deception has completely expired. I recommend that either he be banned from commenting on climate or that strong restrictions be placed on his insufferable behavior.
I thought that expired a long time ago. And I feel how deeply inconvenient truths affect you.

Marvin
December 30, 2012 4:13 am

Philip Bradley says:
December 28, 2012 at 2:03 pm
In the context of the analogy, alcohol does get stored in a ‘reservoir’ throughout the body and particularly in certain cell types. This is actually a very good example of a simile and your refusal to accept the simple description illustrates your own limited mental capacity to draw parallels and fill in the blanks.
Part 1: i.Alcohol is retained in the body in cells.
ii. It is hypothesized that an energy/heat reservoir is a mechanism that allows heat to be retained.
Part 2: i. An amount of alcohol intoxicates an individual and is above the threshold to produce intoxication by a margin (alcohol accumulates).
ii. The energy entering the system is higher than the energy the system can absorb as something other than heat which results in more heat.
Part 3: i. The alcohol decreases but is still above the amount which can be removed/detoxified by the body and is still increasing in the cells.
ii. The incoming energy is lower but is still higher than the energy the system can retain as anything other than heat which still results in increased heat.

Paul Vaughan
December 30, 2012 4:32 am

@lsvalgaard (December 30, 2012 at 4:12 am)
Do not ever address me again.
REPLY: Paul, take a deep breath, and step away from the keyboard a few days. – Anthony

vukcevic
December 30, 2012 4:46 am

lsvalgaard says:
December 30, 2012 at 3:04 am
…….
You do sometime write a bit of nonsense.
Yes I said
– 21.3 years (Hale cycle) period is the primary component in the both solar and Earth magnetic variability.
And I will say that again.
Polar magnetic fields change polarity sign every ~10.6 years, making it a 21.3 year cycle
Sunspots change magnetic polarity sign every ~10.6 years, making it a 21.3 year cycle
For the Earth’s magnetic field main variable component (year to century scale) is at 21.3 years.
http://www.vukcevic.talktalk.net/HC.htm
But for the Aa index which has no sign (always a positive number) main component is at ~10.6 year.
Now you are denying that the Aa index is related to solar magnetic cycles…
Rubbish.
Once I find something is imbedded in the data, I shall make a point of it, I don’t need your approval whether to do it or not.

December 30, 2012 5:10 am

vukcevic says:
December 30, 2012 at 4:46 am
Yes I said
Here is what you said [and my responses]:
vukcevic says:
December 29, 2012 at 11:24 am
Thus the Earth magnetic field differentiates between odd and even cycles.
CMEs don’t behave like that. There is no difference between even and odd cycles: http://www.leif.org/research/Even-Odd-Dst.png
vukcevic says:
December 29, 2012 at 2:27 pm
NASA thinks differently, and I assume they know what they are talking about
It seems not. […] When you look at 100 years of data you find that there is no difference between even and odd cycles as far as the impact of CMEs is concerned: http://www.leif.org/research/Even-Odd-Dst.png so the expectation is wrong.
So, your idea of even/odd cycles is wrong and the notion of giving even and odd cycles different signed sunspot numbers nonsense. Now you are trying to creep back, thinking that the tiny 22-variation in aa and Dst which I explained back in 1978 and which change at maximum rather than at minimum is a primary solar influence. Well, it is not. It is barely detectable.
I don’t need your approval whether to do it or not
When you fail or misinterpret the data, I let you know. Experience shows that you are impervious to learning, so my effort is probably of little impact [just like the 22-yr variation].

December 30, 2012 5:52 am

leif svalgaard says
UV creates the ionosphere. The day-night cycle results in an electric current about 110 km up. This current has a [small] magnetic effect which we can measure on the ground [was discovered in 1722 by George Graham]. We have kept track of that ever since and the result is that the UV radiation from the Sun [whatever its variability within a cycle is] does not have any long-term trend since then.
Henry says
You still did not get it. I will try one more time. I explained to you the reactions happening on TOA.
What comes through on earth in UV is constant exactly because of the reason that more (certain type) UV causes (manufactures) more ozone, peroxides and nitrous oxides instead ,which subsequently back radiate another portion of far UV that would otherwise have heated the oceans (as water has absorption there)
So, now that ozone & others are increasing (leaving that UV that you measure at ground level the same!) we are cooling.
http://blogs.24.com/henryp/2012/10/02/best-sine-wave-fit-for-the-drop-in-global-maximum-temperatures/
there is no other mechanism that would otherwise explain the facts that I am seeing happening.

December 30, 2012 6:09 am

HenryP says:
December 30, 2012 at 5:52 am
there is no other mechanism that would otherwise explain the facts that I am seeing happening.
Perhaps you are just seeing things. I wonder how many people would agree with you. Let them speak up now.
Henry says
You still did not get it. I will try one more time. I explained to you the reactions happening on TOA.
What comes through on earth in UV is constant

What determines the conductivity in the ionosphere 100-150 km up [not on Earth] is solar UV, so, indeed, I don’t get what you are trying to say [and I think that is how it should be].

vukcevic
December 30, 2012 6:33 am

Dr.S.
Well you can deny it as long as you wish, but the AMO and some other indices show and respond directly to the magnetic polarity/oscillations.
http://www.vukcevic.talktalk.net/NV.htm and
http://www.vukcevic.talktalk.net/AMO-recon.htm
Data is there, you know it, eventually sooner or later you will be proven wrong.

December 30, 2012 6:47 am

vukcevic says:
December 30, 2012 at 6:33 am
Well you can deny it as long as you wish, but the AMO and some other indices show and respond directly to the magnetic polarity/oscillations.
It should rather be phrased as you have not to my satisfaction shown that there is any meaningful or fruitful connection. Certainly you have fooled yourself and may happily live forevermore in that paradise.

Chris Schoneveld
December 30, 2012 6:47 am

Paul, I understand why Anthony tries to calm you down, but be assured I feel sympathy for your emotions.
Chris

December 30, 2012 6:58 am

Leif, you said “If there is no trend over 170 years but there is a trend in climate, the argument that the sun is responsible weakens.” I thought all of the solar factors were related (solar wind, solar UV, etc) to each other and to this measurement: http://www.leif.org/research/Ap-1844-now.png If solar changes didn’t warm us from the LIA that means we need another explanation. I do not believe that explanation is CO2 or CO2 equivalent (e.g. deforestation) because the manmade changes in CO2 prior to the 1940’s are too small. There are possible natural explanations like long term ocean circulation changes and volcanoes.
It seems to me that integrating the Ap index above and below some average (e.g. 12) can start to explain some of the warming and cooling in the 20th century. That is in conjunction with other factors like slow steady CO2 warming and longer term oceanic trends. The atmospheric heat engines explanation for stability of the earth’s climate (specifically convection meridional cells) can account for factors that are not cyclical whether solar or terrestrial. For example if the Ap stays high for an extended period the heat engines limit the warming subject to other factors that control them.

Gail Combs
December 30, 2012 7:03 am

markx says:
December 29, 2012 at 7:05 pm
…..Science funding and research grants are still needed …. we just need to be careful it is not part of a system that automatically points everything in the one direction…..
>>>>>>>>>>>>>>>>>>>>>>>>>>>>>
Neither the EU or the USA can afford government ‘grant money’ Thanks to CAGW, WTO and the bankers we are bankrupt in all except name. In the USA we are not creating enough ‘wealth’ that is producing tangible goods via manufacturing, mining, forestry and Agriculture, to be able to provide grants. Our ever increasing trade deficit is proof of this.
On top of that academia is infested with a useless self-perpetuating ideology. We have a whole generation training in useless ‘green’ ‘environmental’ and ‘sustainability’ careers with a heavy flavoring of hatred for capitalism. Only a good swift kick out the door into the real world will cure that and it is the academics from kindergarten up that need that boot. As it is now it is the kids graduating with a rotten work ethic and even worse useless skills that are paying for the mistakes made by their advisors and teachers. It is time for those insulated in their ivory towers to pay instead.
The dead end kids: The number of young Americans without a job has exploded to 53.4 percent — a post-World War II high, according to the Labor Dept….
The U.S. unemployment rate is reported as 7.8% and falling in the news although it is actually between 23% to 24% and rising. However it is new workers who are hit the worse because they have nothing to offer business.

… Surveys of corporations consistently find that businesses are focused outside • the U.S. to recruit necessary talent. … One respondent to the survey even noted, “If I wanted to recruit people who are both technically skilled and culturally aware, I wouldn’t even waste time looking for them on U.S. college campuses.”
Source

May 2010 A Report by the US Congress Joint Economic Commitee
…In December 2007, the unemployment rate for young workers was 11.8 percent, more than two and a half times the unemployment rate for prime-age workers. Most recently, in April 2010, the unemployment rate for young workers reached 19.6 percent – the highest since the Bureau of Labor Statistics began tracking unemployment in 1947.
Young workers make up a disproportionate share of the unemployed. They comprise 13 percent of the labor force, but make up 26 percent of the unemployed….
Unemployment spells early in a young person’s work life can have lasting negative effects on future earnings, productivity, and employment opportunities…..

The work categories that are employing young workers are:
#1 Leisure and Hospitality ~ 37%
#2 Wholesale and Retail Trade (shop clerks and sales reps) ~ 27%
#3 Health and Education ~ 12%
#4 Professional, business & other services ~ 9%
On the very bottom of the list are Ag plus mining, manufacturing, construction, information, transportation and financial. ALL those are under 5% and those first four are the categories that produce this nations wealth. As I keep saying we have become a nation of shop keepers and burger flippers and it is not a ‘sustainable’ (I hate that word) mix. Without a solid foundation of mining, manufacturing and agriculture you just can not support the frills like Leisure, Hospitality, Health and Education where 50% of these new jobs are.
“When we pass the tax boundary…. my best guess is that the train goes off the tracks and we get our worst nightmare of a severe “double dip” recession…. If we do not act, the result will be a crash in tax receipts once the surge is past. If you thought deficits and unemployment have been bad lately, you ain’t seen nothing yet.” ~ top economist Arthur Laffer

December 30, 2012 7:08 am
December 30, 2012 7:12 am

eric1skeptic says:
December 30, 2012 at 6:58 am
If solar changes didn’t warm us from the LIA that means we need another explanation. I do not believe that explanation is CO2 or CO2 equivalent (e.g. deforestation) because the manmade changes in CO2 prior to the 1940′s are too small. There are possible natural explanations like long term ocean circulation changes and volcanoes.
Yes there are such other natural explanations. That solar activity and CO2 cannot alone explain the climate variation is evident from http://www.leif.org/research/Global-Temp-TSI-Since-1600.png
There is no doubt solar ‘wiggles’ of the order of a tenth of a degree, but they can hardly be said to be ‘major drivers’ of our climate.

December 30, 2012 7:19 am

Gail Combs says:
December 30, 2012 at 7:03 am
Only a good swift kick out the door into the real world …
Well, here is such a kick for you: did you look at the sunspot drawing http://www.specola.ch/drawings/2012/loc-d20121229.JPG to count the spots yourself and compare with the official count? Or are you like the people that refused to look through Galilieo’s telescope to avoid seeing the wonders he saw?

lgl
December 30, 2012 7:23 am

Vukcevic
– 21.3 years (Hale cycle) period is the primary component in the both solar and Earth magnetic variability.
And Jupiter-Earth-Venus driving it all: http://virakkraft.com/EMB-AM.png
Changing the orbital speed leading to a rotation speed gradient through the inner of the objects.

December 30, 2012 7:25 am

Chris Schoneveld says:
December 30, 2012 at 6:47 am
Paul, I understand why Anthony tries to calm you down, but be assured I feel sympathy for your emotions.
so do I. It must be terrible to be so frustrated by exposure to inconvenient facts.

mrmethane