
Guest post by Alec Rawls
When he argues that a reduction in forcing will cause cooling Dana Nuccitelli is not actually talking about drinking. He is talking about the solar forcing of global temperature, but the drinking analogy is a handy way to understand where his argument goes off the rails.
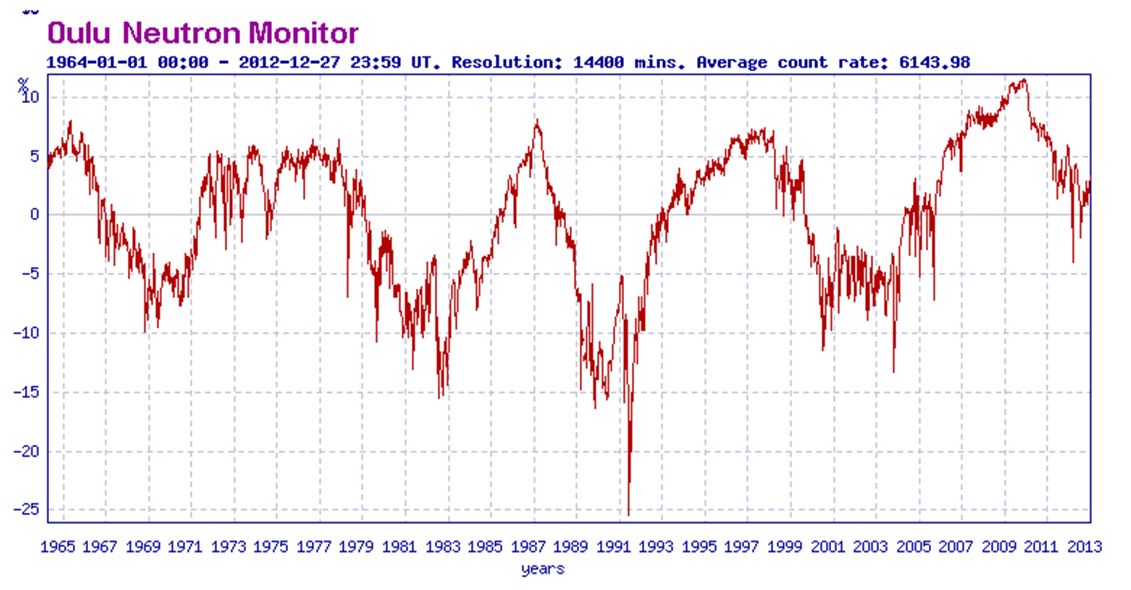
Mr. Nuccitelli, who blogs for the consensus-approved Skeptical Science website, was writing about Henrik Svensmark’s GCR-cloud theory of indirect solar forcing, where Galactic Cosmic Rays are hypothesized to seed cloud formation. If Svensmark is right then a strong solar wind, by deflecting some GCR from reaching the earth, in-effect blows some of the clouds away, letting more sunlight through to warm the planet’s surface.
That can’t possibly explain late 20th century warming says Nuccitelli, because GCR deflection has been estimated (see the Krivova-Solanki graph above) to have peaked by 1980. The raw data suggests the actual GCR minimum was ten years later, but set that aside. Nuccitelli thinks it is the change in the level of forcing, not the level of forcing, that determines whether the climate system warms or cools:
So, if GCRs really do amplify the solar influence on global temperatures, since 1980 they are amplifying a cooling effect.
Cooling begins when a forcing passes its peak? Fail. Daily temperatures don’t start falling at noon. They continue rising until mid-afternoon. The hottest time of the year isn’t the first day of summer (the summer solstice, after which the days start getting shorter), the hottest time is mid-summer. To think cooling should start when forcing passes its peak is like thinking you can sober up by drinking just a little more slowly.
Here’s a tip for Dana to keep in mind on New Year’s eve: it is the level of alcohol forcing that matters. If you are drinking alcohol faster than you body is excreting it (not exactly the way the earth excretes heat, but similar enough), then your blood alcohol is rising. You are getting drunker, even if you have lowered the rate of your drinking! That’s right, putting a little less rum in your egg nog will not sober you up! Your increasing inebriation will just be a little less rapid, and it is the same for solar forcing.
When the peak level of forcing appears in the rearview mirror, the downward trend in the forcing that begins at that point does not cause cooling. It just causes warming to be a little less rapid. Only when the energy pouring into the climate system falls to the level of the energy escaping back out does the system stop warming. Empirically, that turns out to be mid-afternoon, mid-summer, and approximately the first decade of the 21st century.
Three blind mice
Dana Nuccitelli produced one of three widely cited rebuttals to my suggestion that a new sentence that was added to the Second Order Draft of AR5, a sentence that admits strong evidence for some substantial mechanism of solar amplification, is a “game changer.” That admission is on page 7-43 of the SOD:
Many empirical relationships have been reported between GCR or cosmogenic isotope archives and some aspects of the climate system … The forcing from changes in total solar irradiance alone does not seem to account for these observations, implying the existence of an amplifying mechanism such as the hypothesized GCR-cloud link.
That’s a game changer because the only solar forcing included in the IPCC computer models is the very slight variance in solar irradiance (also known as TSI, or “the solar constant”). If there are other solar forcings in play, working through variables that actually vary substantially as solar activity ramps up and down, that kills the report’s key finding (on page 8-4) that we can have “very high confidence that natural forcing is a small fraction of the anthropogenic forcing.”
The two most widely cited rebuttals, which I answered last week, were both by lead authors from the IPCC. Steven Sherwood, one of 15 lead authors of chapter 7, pretended that the admission of evidence for “an amplifying mechanism” was only about GCR-cloud. He then proceeded to claim that the evidence for GCR-cloud points to a weak mechanism, and used that as a grounds for dismissing the idea that any substantial solar forcing beyond TSI could be at work.
Doesn’t follow. The evidence for “an amplifying mechanism” (emphasis added) is entirely separate from the evidence for the GCR-cloud mechanism. The former is paleo evidence, where numerous studies of the geologic record have found strong correlations between solar activity and climate going back many thousands of years. The evidence for the GCR-cloud mechanism is from cloud-chamber experiments and ongoing observations of cloud micro-physics.
It doesn’t matter how unconvinced Sherwood is by the evidence for the GCR-cloud mechanism. That evidence does nothing to counter the paleo evidence, cited in the draft report, that some mechanism of enhanced solar forcing must be at work. By using his discontent with the GCR-cloud theory as an excuse to dismiss the paleo evidence, Sherwood is inverting the scientific method, and he is lying to the public about what the report says, making him a seriously bad guy.
Apparently weak minds think alike because Nuccitelli did the same thing Sherwood did, only a day earlier. Dana’s post only looks at the GCR-cloud mechanism and completely ignores the draft report’s admission of strong evidence for some mechanism of solar amplification. It is in the context of that more fundamental mistake that Nuccitelli goes on to completely misinterpret the evidence for the GCR-cloud mechanism itself, claiming that anything less than peak forcing causes cooling, arguing in-effect that he can sober up by drinking a little slower. Just tell that to the officer Dana. He won’t even need to give you a breathalyzer.
More evidence that weak minds think alike is the second semi-official rebuttal to my “game change” claim, issued by Joanna Haigh, a lead author of the IPCC’s third report. Haigh proceeds on the same dishonest pretence as Sherwood, telling NewScientist magazine that the new sentence in the draft report is only about GCR-cloud, which she then dismisses with the same drinking-game mistake that Dana makes, claiming that if climate were being driven by solar activity then the planet would have started cooling when solar activity was at its peak:
Haigh points out that the sun actually began dimming slightly in the mid-1980s, if we take an average over its 11-year cycle, so fewer GCRs should have been deflected from Earth and more Earth-cooling clouds should have formed. “If there were some way cosmic rays could be causing global climate change, it should have started getting colder after 1985.”
Sober up Joanna. Have a single shot instead of a double. Works every time.
Which theory has more trouble with flat 21st century temperatures?
It is amusing how Dana Nuccitelli, through sheer incompetence, was able to prefigure the highly credentialed malfeasance of both of these IPCC fraudsters. Still, Nuccitelli has to be credited with at least a bit of misfeasance of his own because he wasn’t satisfied with just assuring his gullible readers that cooling commences when forcing is at its peak. That only supplied an excuse for dismissing a solar explanation for late 20th century warming, leaving the conspicuous lack of 21st century warming still to be dealt with. Dana’s solution? Pretend that the flat 21st century temperature record militates against a solar driver of climate:
In fact, GCRs reaching Earth recently hit record high levels (Figure 4), yet temperatures are still way up.
Temperatures have merely flattened out, they haven’t gone down yet, and no Skeptical Science reader will ever learn that this is just what the discovered correlations between solar activity and climate predict. The strongest temperature response to a change in solar forcing is seen with a lag of about ten years (Usoskin et al. 2005), or one solar cycle (Solheim et al. 2012). The theory that is discomfited by flat 21st century temperatures is the CO2-warming theory, which predicts ever more rapidly increasing temperatures.
Dana might actually think that the flat 21st century temperature record causes trouble for the solar-warming theory but there is no way he can think it causes less trouble for the CO2-warming theory. For him to pretend that 21st century temperatures favor the CO2-warming theory is inexcusably dishonest, but as usual, the professionals are even worse. Note this little gem from the SOD (p. 7-44):
The lack of trend in the cosmic ray intensity over the last 50 years (Agee et al., 2012; McCracken and Beer, 2007) provides another strong argument against the hypothesis of a major contribution of cosmic rays to ongoing climate change.
That’s 15 IPCC lead authors all accepting the crackpot idea that you can only get drunk if your rate of drinking is going up. Steady exposure to the high 1950’s level of solar activity will keep you from warming, just as steady swilling of a high level of booze will keep you stone-cold sober. But where Dana only said that “temperatures are still way up” (implicitly acknowledging that they are no longer going up), the draft report here claims that temperatures are still going up (“ongoing climate change”).
Must be a Steven Sherwood sentence. He needs to look at page 10-3 of the SOD (emphasis added):
While the trend in global mean temperature since 1998 is not significantly different from zero, it is also consistent with natural variability superposed on the long-term anthropogenic warming trends projected by climate models.
Note that the “consistent with natural variability” part is a near call, after NOAA admitted in 2008 that 15 years of no warming would falsify current models. But yeah, let’s pretend it is the solar theory that has trouble with the lack of recent warming.
The Guardian, Andrew Sullivan, DeSmog, Romm etcetera, all pwned by Dana Nuccitelli’s error-filled AR5 post
The ensuing Skeptical Science newsletter bragged about how many eco-propagandists picked up on nutty Nuccitelli’s non-stop nonsense and the list is indeed impressive, a glaring testament to the total absence of due diligence on the part of these “journalists,” none of whom thought to question Dana’s advice on how to sober up quick. Here is the SkS tally of eco-scalps:
This was a very big week for SkS in the news. Dana’s IPCC Draft Report Leaked, Shows Global Warming is NOT Due to the Sun was re-posted and/or linked to by The Guardian, New York Times Green, New York Times Dot Earth, Huffington Post, Climate Progress, Mother Jones, Climate Crocks, Carbon Brief, Grist, Daily Beast, DeSmogBlog, Graham Readfearn, Der Spiegel, Maribo, Learn from Nature, Alternative Energy in the 21st Century, and Motherboard. It was also Tweeted by Michael Mann and Chris Mooney, among many others.
The only “consensus” journalist on this list who showed any integrity was Andrew Revkin, who had already written a post on my leak of the draft report. After updating that post with a link to Nuccitelli, Revkin updated again later with a link to the rebuttal that Jo Nova and I wrote about Seven Sherwood. Thanks Andrew, for being an actual journalist.
To put their “big week” in perspective the folks at Credulous Science reached high for sufficient words:
Winston Churchill once said: “A lie gets halfway around the world before the truth has a chance to get its pants on.” Not this time; we got the truth’s pants on in record time and nipped this myth in the bud before the contrarians were able to misinform the public.
The “truth” in their rendering is whatever patent falsehoods can be used to fool the ignorant into thinking they should fear CO2. No, nutty ones. You did not forge an exception to Churchill’s dictum. You provided a textbook example of it.
Dana is a poster child for those who feel a moral imperative to “believe the scientists”
For the last two years I have had a lot of fun exposing the large number of top climate scientists who claim that it is not the level of forcing that causes warming, but the trend in the forcing. They are all looking at the wrong derivative (one instead of zero).
Given the enormous pressure on the eco-left to accept what these government-funded climatologists are saying it is not surprising that someone like Dana Nuccitelli would swallow the idea that temperature really is driven by the trend in the forcing, and one super-wacky segment in Dana’s post indicates that he really is accepting that this is how physics works. If you leave a pot of water on a steady flame it won’t heat. If you want to heat the water you have to keep turning the flame up. The segment is titled, “Physical Reality Intrudes on Rawls”:
Rawls has argued to the contrary by claiming that the climate is still responding to the increase in solar activity from the early 20th century, and that GCRs are amplifying that solar warming from over 60 years ago. This argument is simply physically wrong. As Figure 2 illustrates, when solar activity rises, temperatures follow suit very soon thereafter. In fact, during the mid-20th century, solar activity and global surface temperatures both flattened out. Are we to believe that the planet suddenly began responding to the pre-1950 solar activity increase in 1975—2012, after not warming 1940—1975? The argument makes no physical sense.
Obviously I never said that late 20th century warming was caused by solar activity from the early 20th century and Dana does not give a citation for what argument of mine he is referring to but its easy to figure out. I have argued many times that if one combines the strong paleo correlations between solar activity and climate with the fact that solar activity was at what Ilya Usoskin calls “grand maximum” levels from 1920 to 2000 then it is certainly plausible that much of 20th century warming, including late 20th century warming, could have been caused by the sun. 80 years of a high level of enhanced solar forcing just might warm the place up a bit (and it only did warm a bit, about 0.8 °C over the century).
If I am attributing late 20th century warming to the high solar activity that persisted through 2000, why does Dana think I am attributing it to solar forcings from 60 years earlier? He must be fixed on the idea that only a change in the level of solar forcing can cause warming. That’s what all of these top scientists have been telling everyone and there was no rise in solar activity after 1950, hence any solar-caused warming would have to stem from the pre-1950 rise in solar activity.
But come on Dana. That is not what I am saying. That is what they are saying, and I have been trying my darnedest to expose it as a blatant misrepresentation. I’m not attributing late 20th century warming to the pre-1950 rise in solar activity. I’m attributing it to the fact that solar activity remained at close to the same high 1950’s level until 2000 (or 2003). It is the level of the forcing that causes warming, not the trend in the forcing.
I have to feel bad for Dana on this point. It isn’t his fault. He has been systematically duped by this parade of so-called scientists all telling him that a persistent high level of forcing can’t cause continued warming. Makes me want to put him on a milk carton. The poor guy isn’t just lost, he was kidnapped. Want a piece of candy little boy? Credulous Science indeed.
Werner Brozek says: @ur momisugly December 28, 2012 at 3:35 pm
….The inverse relationship between cosmic rays and temperature definitely seems to be strong, especially with the graph with the millions of years. However it is not perfect. But then again, we cannot expect any trend to be perfect since there are many variables controlling climate and not just one.
>>>>>>>>>>>>>>>>>>>>>>>>>>>>>>>
You have to add in the oceans. The Thermohaline Circulation is something like 1600 years for the Pacific and 350 for the Atlantic. link
There is the ~1500 year Heinrich Events, Dansgaard-Oeschger Events, and Bond Cycles.
On a paper by Dr. Sebastian Lüning (includes link to paper)
Gail Combs says:
December 29, 2012 at 1:27 pm
A team of scientists supported by the National Science Foundation (NSF) has identified for the first time a clear 1,500-year cycle in the far North’s surface atmosphere pressure pattern.
Quaternary Science Reviews
Volume 55, 8 November 2012, Pages 23–33
Invited paper
A re-examination of evidence for the North Atlantic “1500-year cycle” at Site 609
Stephen P. Obrochta, Hiroko Miyahara, Yusuke Yokoyama, Thomas J. Crowley
Ice-rafting evidence for a “1500-year cycle” sparked considerable debate on millennial-scale climate change and the role of solar variability. Here, we reinterpret the last 70,000 years of the subpolar North Atlantic record, focusing on classic DSDP Site 609, in the context of newly available raw data, the latest radiocarbon calibration (Marine09) and ice core chronology (GICC05), and a wider range of statistical methodologies. A ∼1500-year oscillation is primarily limited to the short glacial Stage 4, the age of which is derived solely from an ice flow model (ss09sea), subject to uncertainty, and offset most from the original chronology. Results from the most well-dated, younger interval suggest that the original 1500 ± 500 year cycle may actually be an admixture of the ∼1000 and ∼2000 cycles that are observed within the Holocene at multiple locations. In Holocene sections these variations are coherent with 14C and 10Be estimates of solar variability. Our new results suggest that the “1500-year cycle” may be a transient phenomenon whose origin could be due, for example, to ice sheet boundary conditions for the interval in which it is observed. We therefore question whether it is necessary to invoke such exotic explanations as heterodyne frequencies or combination tones to explain a phenomenon of such fleeting occurrence that is potentially an artifact of arithmetic averaging.
Seems the Russians do not agree with Dr. S.
As long as they use the obsolete Wolf number and Group Numbers no agreement can be expected.
Camburn says:
December 28, 2012 at 6:30 pm
The whole premise of what the models are based on needs to be examined….
>>>>>>>>>>>>>>>>>>>>>>>>>
Here is the premise:
the IPCC mandate states:
As Mosher stated in another thread, the climate models keep CO2 forcing constant and fiddle with everything else – aerosols are the current play toy – to get some sort of agreement with reality.
Scute says:
December 28, 2012 at 7:01 pm
What follows is complicated. My apologies for that but spin is only as complicated in its unraveling as it was in its raveling….
>>>>>>>>>>>>>>>>>>>>>>>>>>>
Thank you for making that point. People at WUWT often forget others may not have read several years worth of posts as background.
So Leif has insisted many times, but other scientists disagree. Leif himself has previously lauded Steinhilber’s TSI reconstruction. Check out Steinhilber 2009’s figure 3 here:
ftp://pmodwrc.ch/pub/Claus/TSI_longterm/reconstr_TSI_grl_rev_submitted.pdf
No trend over the last several hundred years? Sorry, but that’s a big-ol trend. Ditto for Steinhilber’s more recent analysis. Check out figure 1 from his 2010 paper, graphing his “solar modulation function” phi from 1700:
http://www.agu.org/pubs/crossref/2010/2009JA014193.shtml
Yes it did bounce up pretty high a few hundred years ago, but fit a trend line to that Leif, and it most definitely goes up.
Also, see the solar flux plot (figure 5) from Lockwood, Steinhilber, et al. 2011.
http://iopscience.iop.org/1748-9326/6/3/034004/fulltext/
My favorite part? In the caption they join Usoskin in calling the high 20th century levels of solar activity a “grand solar maximum.” Heh. Hard to herd the cats isn’t it?
gail says
http://wattsupwiththat.com/2012/12/28/dana-nuccitellis-holiday-trick-for-sobering-up-quick-put-a-little-less-rum-in-your-egg-nog/#comment-1185428
henry says
excellent comment, as usual, from Gail.
there are more people not agreeing with Dr. S.
I have determined the whole Gleisberg cycle and find it explains all modern warming.
(hint to Dr. S: look at maxima rather than the (noisy) means)
According to my own analysis of 47 weather stations, we will be cooling in the next 35 years:
http://blogs.24.com/henryp/2012/10/02/best-sine-wave-fit-for-the-drop-in-global-maximum-temperatures/
and indeed it is this global cooling that is generally causing more rain, more snow and cooler weather, globally, on average.
(Remember also that when water vapour in the atmosphere cools more, you get more clouds and more precipitation, at certain places).
As the farmers in Anchorage have noted,
http://www.adn.com/2012/07/13/2541345/its-the-coldest-july-on-record.html
the cooling is so bad there that they do not get much of any harvests.
And it seems NOBODY is telling them there that it is not going to get any better. The cooling will last until 2030-2040. See here:
http://wattsupwiththat.com/2012/11/19/cooling-in-the-near-future/
The sad story is, that as we enter 2013, and where the world should prepare itself for climate change due to (natural) global cooling,
for example, by initiating more agricultural schemes at lower latitudes (FOOD!),
and providing more protection against more precipitation at certain places (FLOODS!),
the media and the powers-that-be are twiddling with their thumbs, not listening to the real scientists,
e.g. those not making any money and nice journeys out of the gravy train that “global warming” has become
Wishing you all God’s richest wisdom for 2013!!
Henry
Alec Rawls says:
December 29, 2012 at 2:02 pm
So Leif has insisted many times, but other scientists disagree. Leif himself has previously lauded Steinhilber’s TSI reconstruction.
Check out their Figure 1d in the first paper you cite
and Figure 7 in the 2nd paper. No trend.
The Steinhilber paper has these statements:
“Our estimated difference between the MM and the present is smaller by a factor of 2-4 compared
to records [Lean et al., 1995; Lean, 2000] that have been used in climate model studies.”
Implying a much smaller trend than people assume.
the rather small forcing by TSI changes may still be a problem. The UV irradiance may not be the viable solution because its observational data do not show a similar distinct decreasing trend as TSI [Frohlich ¨ , 2009], implying that its level during the MM was similar as in present solar cycle minima.
Thus no trend.
When you cite, perhaps include the whole truth.
Seems an opportune time for a reminder:
http://climaterealists.com/attachments/ftp/How%20The%20Sun%20Could%20Control%20Earths%20Temperature.pdf
“How The Sun Could Control Earth’s Temperature”
Note that I have subsequently shifted my focus to particle and wavelength variations in general rather than solar protons.
Also that a reverse sign response to solar variations is suggested which deals with one of Leif’s objections and accords with recent findings mentioned by Jo Haigh.
To get the observed climate zone shifting we really need less ozone and a cooling stratosphere when the sun is active and the opposite when the sun is inactive.
If the sun stays quiet I expect confirmation or rebuttal within a year or two.
Alec Rawls says:
December 29, 2012 at 2:02 pm
My favorite part? In the caption they join Usoskin in calling the high 20th century levels of solar activity a “grand solar maximum.” Heh. Hard to herd the cats isn’t it?
Science is self-correcting so their little sleight of hand will disappear. Slides 4 and 5 of
http://www.leif.org/research/The%20long-term%20variation%20of%20solar%20activity.pdf tell the story. They use the heliospheric magnetic field as their parameter but omitting data before 1900 even as they agree with our reconstruction [shown of slide 4 and ‘blown up’ to match on slide 5].
markx says:
December 28, 2012 at 8:55 pm
Alec Rawls said of Dana’s view of the physics involved: [Dana’s view is that] If you leave a pot of water on a steady flame it won’t heat. If you want to heat the water you have to keep turning the flame up….. ”
Very nice analogy …. and Dana has to acknowledge this is one freaking big pot of water……. and that he keeps telling how small is the solar forcing, but posits a theory of instant response.
>>>>>>>>>>>>>>>>>>>>>>>>>>>>
Yes that is another sleight of hand. the Delta in solar forcing is small in Wm^2 but then you have to multiply it by the 70% surface area of the ocean. Also the ocean is not effected byCO2 IR wavelengths (penetrate 10 microns) but is the most sensitive to shorter wavelengths in the visible and UV range where the sun DOES vary.
How anyone can look at the following four graphs and honestly think CO2 has much of anything to do with the climate much less is the ‘climate control knob’ completely floors me. That it is Universities and ‘World Class’ scientists stuns me. It also convinces me we need a very though house cleaning by withdrawing all grant money.
graph 1
graph 2
graph 3
graph 4
Dr. Svalgaard
CMEs don’t behave like that. There is no difference between even and odd cycles:
NASA thinks differently, and I assume they know what they are talking about
“We’re entering Solar Cycle 24. For reasons not fully understood, CMEs in even-numbered solar cycles (like 24) tend to hit Earth with a leading edge that is magnetized north. Such a CME should open a breach and load the magnetosphere with plasma just before the storm gets underway. It’s the perfect sequence for a really big event.”
http://science.nasa.gov/science-news/science-at-nasa/2008/16dec_giantbreach/
and indeed the data confirm the difference is transmitted to the climate’s natural variability:
http://www.vukcevic.talktalk.net/NV.htm
Leif seems to be misreading the SOD on Harder 2009. He writes:
The SOD (p. 11-57) says:
Reduction was expected [low activity -> less UV] and Harder found that this reduction was even greater than expected. Haigh seems to have found the same thing, but puts an amazingly crazy spin on it. She claims that with such a large UV shift the amount of visible light that goes down when solar activity is high (i.e. the shift is larger than the increase in TSI) resulting in less warming of the surface. Instead of causing global warming, a highly active sun would actually cause cooling, according to Haigh, all stated very soberly of course:
Total energy in goes up, but she claims a cooling effect. She is an atmospheric physicist. She knows as well as anybody that this UV shift is going to change atmospheric circulation, which lots of studies are showing can affect climate, but she’s got her story and she’s sticking to it.
Interestingly, her NewScientist interview mentioned the atmospheric effects of UV shift, dismissing them as only local:
Actually, it is not clear whether is a paraphrase of Haigh, or was interjected by NewScientist, but either way, Haigh is certainly aware of this stuff, and was at the time being asked to comment on my leak of the SOD’s admission of strong evidence for SOME substantial mechanism of solar amplification. UV-shift effects is one obvious candidate, so the NewScientist actually belittles TWO of the main candidates for this unidentified solar amplification mechanism, without mention in either case how being unconvinced of any particular mechanism does nothing to counter the evidence that some such mechanism is at work.
E.M.Smith says:
December 28, 2012 at 9:18 pm
…..Personally, I’ll take the snow cover as my guide. As of now, we’ve got more % snow cover in the USA than last year and we’ve only just started winter.
We’ve go snow all the way down to Dallas, Texas. We’ve got glaciers growing on Mt. Shasta. We’ve got Russia and China in a frozen meat locker. We’ve got N. Hemisphere snow above the ‘climatology’ average. ( I’m sure we’re going to be told “But it’s a WARM snow!” 😉
http://moe.met.fsu.edu/snow/
>>>>>>>>>>>>>>>>>>>>>>>>
I find the month of October N. Hemisphere snow data enlightening. This gives an indication of whether or not the growing season is shortening:
http://www.ncdc.noaa.gov/sotc/service/global/snowcover-nhland/201210.gif
The length of the Arctic melt season has shortened the last five years too.
http://i45.tinypic.com/27yr1wy.png
No one really mentions the record lows.
http://devconsultancygroup.blogspot.co.uk/2012/11/cold-wave-roundup-record-temperature.html
http://www.washingtonpost.com/blogs/capital-weather-gang/post/coldest-january-on-record-for-parts-of-alaska/2012/01/31/gIQAQVyIfQ_blog.html
For climate scientists to continue to ignore, hide and sweep under the rug this type of information borders on criminal because of its impact on food production.
Alec Rawls says:
December 29, 2012 at 2:39 pm
Leif seems to be misreading the SOD on Harder 2009.
I read Harder not SOD on Harder.
The unexpected variation of UV [which is not certain at all – difficult measurements!] even prompted the modellers to consider what would happen if indeed UV and solar activity were out-of-phase:
http://lasp.colorado.edu/sorce/news/2011ScienceMeeting/docs/presentations/6b_Cahalan_Sedona_9-15-2011.pdf
My own take is that the Harder ‘effect’ is due to calibration problems and will go away with better data.
December 29, 2012 at 2:56 pm
vukcevic says:
December 29, 2012 at 2:27 pm
NASA thinks differently, and I assume they know what they are talking about
It seems not.
“We’re entering Solar Cycle 24. For reasons not fully understood, CMEs in even-numbered solar cycles (like 24) tend to hit Earth with a leading edge that is magnetized north. Such a CME should open a breach and load the magnetosphere with plasma just before the storm gets underway. It’s the perfect sequence for a really big event.”
‘should’? When you look at 100 years of data you find that there is no difference between even and odd cycles as far as the impact of CMEs is concerned: http://www.leif.org/research/Even-Odd-Dst.png so the expectation is wrong.
So does this mean climate sensitivity is higher or lower than thought before this “discovery”?
“Geomagnetic activity has had no trend since 1844: http://www.leif.org/research/Ap-1844-now.png”
(Leif)
Leif, looks clearly to me that it was lower mean from approx 1876 to 1929 and higher mean from 1930 to 2003
Alec Rawls says:
“According to Bones:
the bottom line is that ocean surface temperatures mostly adjust very quickly to solar flux changes.
But as he himself notes, heat transfer in and out of deeper ocean layers can take much longer, and as deeper layers warm, that will reduce the heat loss from the upper ocean layer, causing it to continue to warm in response to a long term increase in forcing. The claim that persistent high levels of forcing won’t cause continued warming is WRONG.”
The idea that warming of deeper ocean layers layers will reduce the rate of heat loss from the upper ocean layers is what is WRONG here. It may be a surprise to Alec, but there is very, very little heat loss from the first 100 meters of the ocean to greater depths. With thermal conductivity of about 6 watt/m/C and a temperature gradient of about 0.025 C/m. the rate of heat loss to lower depths is thus of the order 0.15 watt per square meter, compared to something like a net 170 watt per square meter of UV-VIS absorbed in the first 100 meters, on global average (and half of that in the first 25 meters). Thus nearly all of that 170 watt/m^2 is radiated back out from the surface. Consequently, the surface temperatures respond to solar flux changes on the thermal relaxation time scale of the upper ocean layers. Further, the heat that makes it to depths below 100 meters essentially won’t be coming back. Only in the polar regions are there places cold enough to be warmed by transport of that heat to a colder place. As I noted previously, the thermal time constant for the first hundred meters is about 3 years and thermal relaxation is essentially complete after about 3 such periods.
I will be happy to discuss this issue in considerable mathematical detail with any interested parties. For a change, q, of solar flux from a thermal equilibrium value, that increases linearly with time while producing no other changes of cloud cover or wind speeds or patterns, the surface temperature increase and thermal time constant are given here:
http://i1244.photobucket.com/albums/gg580/stanrobertson/ocean-eq.jpg
lsvalgaard says:
December 29, 2012 at 1:47 pm
…..Seems the Russians do not agree with Dr. S.
As long as they use the obsolete Wolf number and Group Numbers no agreement can be expected.
>>>>>>>>>>>>>>>>>>>>>>>>>
They are not.
I find it quite interesting that you are rewriting historical data just as Hansen does with temperature data.
Alec Rawls says:
December 29, 2012 at 2:39 pm
UV-shift effects is one obvious candidate, so the NewScientist actually belittles TWO of the main candidates for this unidentified solar amplification mechanism
The Steinhilber et al. paper you cite, ends with “The UV irradiance may not be the viable solution because its observational data do not show a similar distinct decreasing trend as TSI [Frohlich ¨ , 2009], implying that its level during the MM was similar as in present solar cycle minima.
So you will quote selectively and omit what you don’t like.
Ian Holton says:
December 29, 2012 at 3:07 pm
Leif, looks clearly to me that it was lower mean from approx 1876 to 1929 and higher mean from 1930 to 2003
Yes, but was higher before 1876 and lower after 2003, adding up to no overall trend. The straight line is the least-square trend [there isn’t any].
Dr. Svalgaard disagree
…………..:
As long as it is in the data, I am not really much concerned if you agree or not.
Gail Combs says:
December 29, 2012 at 3:22 pm
“As long as they use the obsolete Wolf number and Group Numbers no agreement can be expected.”
They are not.
They say they are: “Different records of solar activity (Wolf and group sunspot number)”
I find it quite interesting that you are rewriting historical data just as Hansen does with temperature data.
I am not ‘rewriting’ the historical data. The whole sunspot community [some 60 experts on this] are doing this, as it should be done when errors have been identified. Wolf himself did that several times. Wolfer did the same in 1902. Hoyt and Schatten did in 1994. Hugh Hudson summarizes the work of the 1st and 2nd SSN workshops thus
“Conclusions I
• The modern work on SSN has been wonderful, establishing its reproducibility and precision
• The older SSN records need rationalization
• This group needs to take charge of the perception of SSN:
– Consensus
– Public databases and ample publications
– Propaganda that discredits any research not using the consensus SSN ”
We have recruited scientists with a variety of expertise/opinions on re-calibration/reconciliation of the SSN. In addition, at each workshop we have invited knowledgeable senior scientists as reviewers to provide critiques and offer guidance. Re-calibrating the sunspot number is a topic whose time has time. It can no longer be ignored – the discrepancies are too large and the applications (solar dynamo, climate change, space weather and climate) too prominent. Our efforts to re-calibrate the SSN have met with some resistance already, primarily from people with vested interest in the status-quo [are you one of those?]
Leif says:Check out their Figure 1d in the first paper you cite and Figure 7 in the 2nd paper. No trend.Starting in 1700? Definitely a trend. And just as interestingly, when solar activity went up in the 1700’s it got warmer. When solar activity dipped into the Dalton minimum, it got colder. When solar activity went back up, it got warmer. When solar activity dropped into the turn of the 19th century lull, it got colder. When solar activity rose to what Usoskin, Steinhilber and Lockwood call “grand maximum” levels from the 1920 on, it got warmer. That Figure 1d looks approximately like the temperature record for the same period.
Alec Rawls says:
December 29, 2012 at 3:59 pm
That Figure 1d looks approximately like the temperature record for the same period.
To substantiate that would you plot the temperature record on Figure 1d?
And there is no Grand Maximum in the 20th century, no matter what they call it.
Alec Rawls says:
December 29, 2012 at 3:59 pm
When solar activity rose to what Usoskin, Steinhilber and Lockwood call “grand maximum” levels from the 1920 on, it got warmer.
Here is what Usoskin call the Modern Grand Maximum http://www.leif.org/research/Extreme-MGM.png [pink oval]. compare that the green oval where TSI [actually 10Be] was similar to what it is today. And you can see the error.