
Guest post by Alec Rawls
When he argues that a reduction in forcing will cause cooling Dana Nuccitelli is not actually talking about drinking. He is talking about the solar forcing of global temperature, but the drinking analogy is a handy way to understand where his argument goes off the rails.
Mr. Nuccitelli, who blogs for the consensus-approved Skeptical Science website, was writing about Henrik Svensmark’s GCR-cloud theory of indirect solar forcing, where Galactic Cosmic Rays are hypothesized to seed cloud formation. If Svensmark is right then a strong solar wind, by deflecting some GCR from reaching the earth, in-effect blows some of the clouds away, letting more sunlight through to warm the planet’s surface.
That can’t possibly explain late 20th century warming says Nuccitelli, because GCR deflection has been estimated (see the Krivova-Solanki graph above) to have peaked by 1980. The raw data suggests the actual GCR minimum was ten years later, but set that aside. Nuccitelli thinks it is the change in the level of forcing, not the level of forcing, that determines whether the climate system warms or cools:
So, if GCRs really do amplify the solar influence on global temperatures, since 1980 they are amplifying a cooling effect.
Cooling begins when a forcing passes its peak? Fail. Daily temperatures don’t start falling at noon. They continue rising until mid-afternoon. The hottest time of the year isn’t the first day of summer (the summer solstice, after which the days start getting shorter), the hottest time is mid-summer. To think cooling should start when forcing passes its peak is like thinking you can sober up by drinking just a little more slowly.
Here’s a tip for Dana to keep in mind on New Year’s eve: it is the level of alcohol forcing that matters. If you are drinking alcohol faster than you body is excreting it (not exactly the way the earth excretes heat, but similar enough), then your blood alcohol is rising. You are getting drunker, even if you have lowered the rate of your drinking! That’s right, putting a little less rum in your egg nog will not sober you up! Your increasing inebriation will just be a little less rapid, and it is the same for solar forcing.
When the peak level of forcing appears in the rearview mirror, the downward trend in the forcing that begins at that point does not cause cooling. It just causes warming to be a little less rapid. Only when the energy pouring into the climate system falls to the level of the energy escaping back out does the system stop warming. Empirically, that turns out to be mid-afternoon, mid-summer, and approximately the first decade of the 21st century.
Three blind mice
Dana Nuccitelli produced one of three widely cited rebuttals to my suggestion that a new sentence that was added to the Second Order Draft of AR5, a sentence that admits strong evidence for some substantial mechanism of solar amplification, is a “game changer.” That admission is on page 7-43 of the SOD:
Many empirical relationships have been reported between GCR or cosmogenic isotope archives and some aspects of the climate system … The forcing from changes in total solar irradiance alone does not seem to account for these observations, implying the existence of an amplifying mechanism such as the hypothesized GCR-cloud link.
That’s a game changer because the only solar forcing included in the IPCC computer models is the very slight variance in solar irradiance (also known as TSI, or “the solar constant”). If there are other solar forcings in play, working through variables that actually vary substantially as solar activity ramps up and down, that kills the report’s key finding (on page 8-4) that we can have “very high confidence that natural forcing is a small fraction of the anthropogenic forcing.”
The two most widely cited rebuttals, which I answered last week, were both by lead authors from the IPCC. Steven Sherwood, one of 15 lead authors of chapter 7, pretended that the admission of evidence for “an amplifying mechanism” was only about GCR-cloud. He then proceeded to claim that the evidence for GCR-cloud points to a weak mechanism, and used that as a grounds for dismissing the idea that any substantial solar forcing beyond TSI could be at work.
Doesn’t follow. The evidence for “an amplifying mechanism” (emphasis added) is entirely separate from the evidence for the GCR-cloud mechanism. The former is paleo evidence, where numerous studies of the geologic record have found strong correlations between solar activity and climate going back many thousands of years. The evidence for the GCR-cloud mechanism is from cloud-chamber experiments and ongoing observations of cloud micro-physics.
It doesn’t matter how unconvinced Sherwood is by the evidence for the GCR-cloud mechanism. That evidence does nothing to counter the paleo evidence, cited in the draft report, that some mechanism of enhanced solar forcing must be at work. By using his discontent with the GCR-cloud theory as an excuse to dismiss the paleo evidence, Sherwood is inverting the scientific method, and he is lying to the public about what the report says, making him a seriously bad guy.
Apparently weak minds think alike because Nuccitelli did the same thing Sherwood did, only a day earlier. Dana’s post only looks at the GCR-cloud mechanism and completely ignores the draft report’s admission of strong evidence for some mechanism of solar amplification. It is in the context of that more fundamental mistake that Nuccitelli goes on to completely misinterpret the evidence for the GCR-cloud mechanism itself, claiming that anything less than peak forcing causes cooling, arguing in-effect that he can sober up by drinking a little slower. Just tell that to the officer Dana. He won’t even need to give you a breathalyzer.
More evidence that weak minds think alike is the second semi-official rebuttal to my “game change” claim, issued by Joanna Haigh, a lead author of the IPCC’s third report. Haigh proceeds on the same dishonest pretence as Sherwood, telling NewScientist magazine that the new sentence in the draft report is only about GCR-cloud, which she then dismisses with the same drinking-game mistake that Dana makes, claiming that if climate were being driven by solar activity then the planet would have started cooling when solar activity was at its peak:
Haigh points out that the sun actually began dimming slightly in the mid-1980s, if we take an average over its 11-year cycle, so fewer GCRs should have been deflected from Earth and more Earth-cooling clouds should have formed. “If there were some way cosmic rays could be causing global climate change, it should have started getting colder after 1985.”
Sober up Joanna. Have a single shot instead of a double. Works every time.
Which theory has more trouble with flat 21st century temperatures?
It is amusing how Dana Nuccitelli, through sheer incompetence, was able to prefigure the highly credentialed malfeasance of both of these IPCC fraudsters. Still, Nuccitelli has to be credited with at least a bit of misfeasance of his own because he wasn’t satisfied with just assuring his gullible readers that cooling commences when forcing is at its peak. That only supplied an excuse for dismissing a solar explanation for late 20th century warming, leaving the conspicuous lack of 21st century warming still to be dealt with. Dana’s solution? Pretend that the flat 21st century temperature record militates against a solar driver of climate:
In fact, GCRs reaching Earth recently hit record high levels (Figure 4), yet temperatures are still way up.
Temperatures have merely flattened out, they haven’t gone down yet, and no Skeptical Science reader will ever learn that this is just what the discovered correlations between solar activity and climate predict. The strongest temperature response to a change in solar forcing is seen with a lag of about ten years (Usoskin et al. 2005), or one solar cycle (Solheim et al. 2012). The theory that is discomfited by flat 21st century temperatures is the CO2-warming theory, which predicts ever more rapidly increasing temperatures.
Dana might actually think that the flat 21st century temperature record causes trouble for the solar-warming theory but there is no way he can think it causes less trouble for the CO2-warming theory. For him to pretend that 21st century temperatures favor the CO2-warming theory is inexcusably dishonest, but as usual, the professionals are even worse. Note this little gem from the SOD (p. 7-44):
The lack of trend in the cosmic ray intensity over the last 50 years (Agee et al., 2012; McCracken and Beer, 2007) provides another strong argument against the hypothesis of a major contribution of cosmic rays to ongoing climate change.
That’s 15 IPCC lead authors all accepting the crackpot idea that you can only get drunk if your rate of drinking is going up. Steady exposure to the high 1950’s level of solar activity will keep you from warming, just as steady swilling of a high level of booze will keep you stone-cold sober. But where Dana only said that “temperatures are still way up” (implicitly acknowledging that they are no longer going up), the draft report here claims that temperatures are still going up (“ongoing climate change”).
Must be a Steven Sherwood sentence. He needs to look at page 10-3 of the SOD (emphasis added):
While the trend in global mean temperature since 1998 is not significantly different from zero, it is also consistent with natural variability superposed on the long-term anthropogenic warming trends projected by climate models.
Note that the “consistent with natural variability” part is a near call, after NOAA admitted in 2008 that 15 years of no warming would falsify current models. But yeah, let’s pretend it is the solar theory that has trouble with the lack of recent warming.
The Guardian, Andrew Sullivan, DeSmog, Romm etcetera, all pwned by Dana Nuccitelli’s error-filled AR5 post
The ensuing Skeptical Science newsletter bragged about how many eco-propagandists picked up on nutty Nuccitelli’s non-stop nonsense and the list is indeed impressive, a glaring testament to the total absence of due diligence on the part of these “journalists,” none of whom thought to question Dana’s advice on how to sober up quick. Here is the SkS tally of eco-scalps:
This was a very big week for SkS in the news. Dana’s IPCC Draft Report Leaked, Shows Global Warming is NOT Due to the Sun was re-posted and/or linked to by The Guardian, New York Times Green, New York Times Dot Earth, Huffington Post, Climate Progress, Mother Jones, Climate Crocks, Carbon Brief, Grist, Daily Beast, DeSmogBlog, Graham Readfearn, Der Spiegel, Maribo, Learn from Nature, Alternative Energy in the 21st Century, and Motherboard. It was also Tweeted by Michael Mann and Chris Mooney, among many others.
The only “consensus” journalist on this list who showed any integrity was Andrew Revkin, who had already written a post on my leak of the draft report. After updating that post with a link to Nuccitelli, Revkin updated again later with a link to the rebuttal that Jo Nova and I wrote about Seven Sherwood. Thanks Andrew, for being an actual journalist.
To put their “big week” in perspective the folks at Credulous Science reached high for sufficient words:
Winston Churchill once said: “A lie gets halfway around the world before the truth has a chance to get its pants on.” Not this time; we got the truth’s pants on in record time and nipped this myth in the bud before the contrarians were able to misinform the public.
The “truth” in their rendering is whatever patent falsehoods can be used to fool the ignorant into thinking they should fear CO2. No, nutty ones. You did not forge an exception to Churchill’s dictum. You provided a textbook example of it.
Dana is a poster child for those who feel a moral imperative to “believe the scientists”
For the last two years I have had a lot of fun exposing the large number of top climate scientists who claim that it is not the level of forcing that causes warming, but the trend in the forcing. They are all looking at the wrong derivative (one instead of zero).
Given the enormous pressure on the eco-left to accept what these government-funded climatologists are saying it is not surprising that someone like Dana Nuccitelli would swallow the idea that temperature really is driven by the trend in the forcing, and one super-wacky segment in Dana’s post indicates that he really is accepting that this is how physics works. If you leave a pot of water on a steady flame it won’t heat. If you want to heat the water you have to keep turning the flame up. The segment is titled, “Physical Reality Intrudes on Rawls”:
Rawls has argued to the contrary by claiming that the climate is still responding to the increase in solar activity from the early 20th century, and that GCRs are amplifying that solar warming from over 60 years ago. This argument is simply physically wrong. As Figure 2 illustrates, when solar activity rises, temperatures follow suit very soon thereafter. In fact, during the mid-20th century, solar activity and global surface temperatures both flattened out. Are we to believe that the planet suddenly began responding to the pre-1950 solar activity increase in 1975—2012, after not warming 1940—1975? The argument makes no physical sense.
Obviously I never said that late 20th century warming was caused by solar activity from the early 20th century and Dana does not give a citation for what argument of mine he is referring to but its easy to figure out. I have argued many times that if one combines the strong paleo correlations between solar activity and climate with the fact that solar activity was at what Ilya Usoskin calls “grand maximum” levels from 1920 to 2000 then it is certainly plausible that much of 20th century warming, including late 20th century warming, could have been caused by the sun. 80 years of a high level of enhanced solar forcing just might warm the place up a bit (and it only did warm a bit, about 0.8 °C over the century).
If I am attributing late 20th century warming to the high solar activity that persisted through 2000, why does Dana think I am attributing it to solar forcings from 60 years earlier? He must be fixed on the idea that only a change in the level of solar forcing can cause warming. That’s what all of these top scientists have been telling everyone and there was no rise in solar activity after 1950, hence any solar-caused warming would have to stem from the pre-1950 rise in solar activity.
But come on Dana. That is not what I am saying. That is what they are saying, and I have been trying my darnedest to expose it as a blatant misrepresentation. I’m not attributing late 20th century warming to the pre-1950 rise in solar activity. I’m attributing it to the fact that solar activity remained at close to the same high 1950’s level until 2000 (or 2003). It is the level of the forcing that causes warming, not the trend in the forcing.
I have to feel bad for Dana on this point. It isn’t his fault. He has been systematically duped by this parade of so-called scientists all telling him that a persistent high level of forcing can’t cause continued warming. Makes me want to put him on a milk carton. The poor guy isn’t just lost, he was kidnapped. Want a piece of candy little boy? Credulous Science indeed.
lsvalgaard says:
December 29, 2012 at 9:26 am
“Your ‘Hale cycle’ is made up by putting a negative sign on every other 11-yr cycle. This is unphysical.”
It isn’t his “Hale Cycle”, it is Hale’s. Hence the name. See how that works?
Bart says:
December 29, 2012 at 10:05 am
Various commenters on these boards over the years have pointed out that, if you integrate various solar indices
Integration involves an interval over which the integral is to be taken. What is that interval?
And if the values you integrate are wrong to begin with, what does that do to the result?
vukcevic says:
December 29, 2012 at 10:09 am
The Earth’s magnetic field differentiates between odd and even cycles. How do we know that? By different shape of neutron count during the even cycles to the shape of the NC for the odd cycles
No, that difference comes from a difference in the incoming flux of cosmic rays. Has nothing to do with the Earth.
Bart says:
December 29, 2012 at 10:09 am
It isn’t his “Hale Cycle”, it is Hale’s. Hence the name. See how that works?
Hale’s cycle is not in solar activity. Vuk makes up an artificial cycle by putting a sign on the SSN alternating between cycles. So, no, I don’t see how that works. Explain it to me.
When one writes that temperatures will continue to rise without further increase in the rate of heating it implies that the thing being heated did not reach an equilibrium temperature with any of the previous rates of heating. The question then becomes, how long will it be before an equilibrium temperature is reached. Alec implies that it might be a very long time, but I do not believe that to be the case. Since oceans cover so much of the earth surface, consider the incoming solar UV-VIS that reaches an ocean surface. Roughly half of this is absorbed within the first 25 meters depth and nearly all of the rest is absorbed by 100 meters. Photosynthesizing life is essentially absent at greater depths. The upper 25 meters is a well stirred wave zone and it has about 10 times the heat storage capacity of the earth atmosphere. The temperature of this zone will follow the incoming solar flux with a thermal time constant of about 225 days. Significant temperature changes can occur quickly within this period, as evidenced by the fact that seasonal temperature variations are still very much present at depths of 25 meters.
If, for some reason, solar flux would increase at a steady rate, then in approximately 3 time constant periods, or about 1.8 years, the surface temperature will rise steadily at the same rate as the solar heating increase. Conversely, if the solar flux were then to be held constant, the surface temperature would only rise for another 1.8 years before stabilizing.
The thermal relaxation time for greater depths is longer. At a depth of about 100 meters, the thermal relaxation time is close to 3 years, and it would take three times this, or about 9 years for these lower depths to fully adjust to changes in the solar flux. This is likely the reason that surface temperatures seem to be correlated with the length of previous solar cycles. However, the changes at depths of 100 meters or more are largely accomplished without being manifest at the surface except for the heat transported by ocean currents. For example, water at 100 meters depth in the tropics can be transported to polar regions where it is capable of contributing to atmospheric warming there. For complete equilibration, it should be clear that the circulation time of the ocean currents is part of the adjustment period and this is reflected in some of the multi-decade time scale variations of ocean surface temperatures.
But the bottom line is that ocean surface temperatures mostly adjust very quickly to solar flux changes.
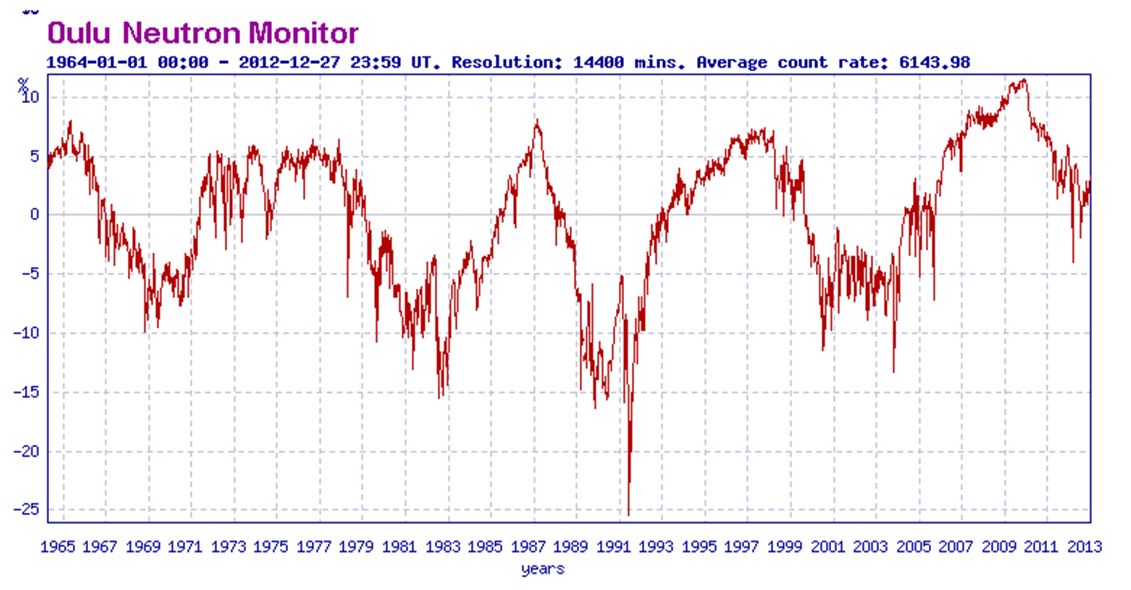
The following comments are concerned with the “global temperature” part of the graph
http://i191.photobucket.com/albums/z36/AlecRawls/Environment%20and%20climate/Nuccitelli_cosmic_temp_60_zps38b63e05.jpg
1/ Where are the error bars that show both the statistical and systematic uncertainty? The graphs as presented imply that “global temperature” is known to +/- 0.01C [line thickness] which is nonsensical.
2/ Given that thermometers back in 1890 would do well to be able to measure temperature to +/- 0.5C, how is global temperature from back then apparently known to far better than +/- 0.1C? Even today the best instrumented weather station thermometers have a resolution and accuracy of about +/- 0.1C.
Such graphs and claims require a suspension of belief in measurement and error analysis.
The above bit about missing statistical and systematic error bars also applies to the cosmic ray part of the plot.
3/ Is “global temperature” a physically meaningful derived quantity?
Consider several thousand temperature measurement sites. Divide the surface of the earth into cells – volumes – such that one of the measurement sites is at each centre of a cell. The temperature measured at each site is only representative of the associated cell if and only if the volume is in local thermodynamic equilibrium [temperature is only defined for a system at thermodynamic equilibrium].
As the atmospheric is a dynamic system far from thermodynamic equilibrium and the cells are far to large to be in local thermodynamic equilibrium, the temperature measured at the site centred in cell is not representative.
So deriving a measure called “global temperature” is a dubious exercise at best.
I would argue that it is a meaningless derived quantity and arguments about it are spurious.
leifsvalgaard says
The result is that there has been no long-term change in FUV since 1722.
henry says
there are various reports I can find again SHOWING that the variation in FUV/EUV is considerable
the reactions are
uv + O2 => O3
uv + OH => HxOx
uv + NO => NxOx
so, obviously, a change in the distribution of TSI towards more uv
causes more O3, more HxOx and more NxOx
I remember that last time I calculated for you that Trenberth showed that O3 on its own backradiates ca. 25% of all that is being back radiated,
but he (Trenberth) forgot (or never realized) the HxOx and NxOx
It is these changes on top of the atmosphere that cause the warming and cooling periods as explained here
http://wattsupwiththat.com/2012/12/28/dana-nuccitellis-holiday-trick-for-sobering-up-quick-put-a-little-less-rum-in-your-egg-nog/#comment-1185180
Henry says
Please note: indeed one would expect more condensation (bigger flooding) at the end of a cooling period and minimum flooding at the end of a warm period. This is because when water vapor cools (more) it condensates (more) to water (i.e. more rain).
Henry says
please understand what I am saying. I am saying that in a cooling period you get more clouds, and more snow and more rain, simply because of physical reasons.
IMHO it has nothing to do with cosmic galactic rays…..
lsvalgaard said:
“Geomagnetic activity has had no trend since 1844: http://www.leif.org/research/Ap-1844-now.png ”
Only a fool would deny that the warming and cooling episodes are readily visible there. And of course the ratio of lower to higher activity periods makes for strong trends at an inter-decadal scale, i.e. there are less periods of lower activity through the strongest warming periods.
lsvalgaard says:
December 29, 2012 at 10:17 am
“What is that interval?”
That of observation. Free parameters must then be assigned based on observation, if they cannot be deduced from first principles.
“And if the values you integrate are wrong to begin with, what does that do to the result?”
It makes it wrong, too. But, that is TBD.
lsvalgaard says:
December 29, 2012 at 10:22 am
“So, no, I don’t see how that works. Explain it to me.”
It is called the “Hale Cycle”. That is because it is named after Hale. If it were Vukcevic’s, it would be called the “Vukcevic Cycle”. Humans tend to name a discovery after the first person who made it widely known and accepted.
bones says:
December 29, 2012 at 10:22 am
“But the bottom line is that ocean surface temperatures mostly adjust very quickly to solar flux changes.”
But, all you are offering is surmise as to that effect. Mental exercises are all fine and good, but when the data tell you your gedanken is flawed, you have to do a little more thinking.
HenryP says:
December 29, 2012 at 10:38 am
there are various reports I can find again SHOWING that the variation in FUV/EUV is considerable
Playing with words. Of course, there is considerable variation in FUV/EUV within each cycle and from day to day, but the amount of EUV/FUV we get scales VERY well with the sunspot number and with F10.7 and with the amplitude of the diurnal variation of the east component of the geomagnetic field, and those parameters SHOW no long-term trend since 1722.
Leif makes a distinction between radiative forcings and stratospheric variation:
Doesn’t change anything. If solar-magnetic effects induce some stratospheric variation that drives climate, that is a mechanism of solar amplification.
I agree with Leif that, the way radiative forcing is defined (as an immediate or near-immediate Top Of the Atmosphere imbalance between energy in and out), the effects of UV-shift on atmospheric circulation, and the resulting effects on cloud formation, which do affect the TOA imbalance, are not rapid enough to be considered “forcings.” But that is purely an artifact of how the artificial categories of forcing and feedback are defined. It is still a possible mechanism by which solar activity drives climate, and one for which there is quite a bit of evidence at this point.
Lots of studies are finding that atmospheric circulation patterns are strongly affected by solar activity, presumably through the UV shift that accompanies solar variation. High activity -> more UV -> more interaction with stratospheric ozone (creation and destruction) warms the stratosphere while at the same time less radiation gets through to warm the surface -> altered atmospheric circulation patterns.
The SOD actually does talk about the TOA imbalances that might result from these processes as RF effects. That bit was quoted in David Hoffer’s post about chapter 11:
The authors only mention regional impacts, but this is only just beginning to be studied and it could well turn out that the various “regional” effects sum to a significant “global” effect. Stephen Wilde has a theory of why the net effect should be global, and it is certainly possible that some such theory will turn out to be correct. A number of research efforts have found strong solar-AMO correlations, and Kodera is pretty positive about the Indian Ocean weather patterns and solar. Kodera’s full abstract, if anyone is interested:
lsvalgaard says:
December 29, 2012 at 10:22 am
……..
The Sun-Earth magnetic link is established by numerous geomagnetic storms (generated by CMEs) during every cycle. In the even-numbered solar cycles the solar magnetic field tends to hit magnetosphere more often with a leading edge that is magnetized north. This opens a breach and loads the magnetosphere with plasma starting a geomagnetic storm .
Thus the Earth magnetic field differentiates between odd and even cycles.
Richard M says:
December 28, 2012 at 1:10 pm
I doubt the warming is even .8°C. With UHI and questionable adjustments the real increase might be much less.
>>>>>>>>>>>>>>>>>>>>>
Alternate view:
Koppen climate Classification using native plants. The decadal boundaries for the twentieth century for the mid west USA (see second map) map 1910 and 1970 were the only two decades different from the ‘pack’ and they were COLDER.
Alec Rawls says:
December 29, 2012 at 11:24 am
Leif makes a distinction between radiative forcings and stratospheric variation
No, Kodera makes that distinction.
Doesn’t change anything. If solar-magnetic effects induce some stratospheric variation that drives climate, that is a mechanism of solar amplification.
Except that the solar parameters that might influence the stratosphere have not shown any long-term trend the past 300 years. That is the key point.
In re: the request for a demonstration of the correlation between cloudiness and GCR. I like to point to the following paper’s graphs.
http://www.atmos-chem-phys.net/8/7373/2008/acp-8-7373-2008.pdf
While it is true that the paper’s authors and the IPCC believe that this is good evidence against the GCR hypothesis, It actually (so far as I can see) provides good evidence for it. see Figure 2 for instance.
Cheers, 🙂
According to Bones:
But as he himself notes, heat transfer in and out of deeper ocean layers can take much longer, and as deeper layers warm, that will reduce the heat loss from the upper ocean layer, causing it to continue to warm in response to a long term increase in forcing. The claim that persistent high levels of forcing won’t cause continued warming is WRONG.
ALEC SAYS
Lots of studies are finding that atmospheric circulation patterns are strongly affected by solar activity, presumably through the UV shift that accompanies solar variation. High activity -> more UV -> more interaction with stratospheric ozone (creation and destruction) warms the stratosphere while at the same time less radiation gets through to warm the surface -> altered atmospheric circulation patterns.
HENRY SAYS
You got it. You figured it out. Just remember it is not only ozone. There are also some peroxides and nitrous oxides involved, which as yet have never even been measured on the TOA….
kalsel3294 says:
December 28, 2012 at 1:40 pm
Dana Nuccitelli and the likes that inhabit that site always respond by grabbing something, anything, that readily comes to mind to rebut a new perspective …. I don’t think any of them have ever exhibited an original thought, being sadly capable of only parroting what they have trained themselves to parrot.
>>>>>>>>>>>>>>>>>>>>>>>>>>>
SkS is a paid propaganda site. Of course they will do anything, say anything to hide the truth. That is what their pay check requires. That is what their ‘world leadership’ goal requires.
If you read between the lines HERE. John Cook who runs SkS is/was a FOR HIRE web programmer. (2010)
It is interesting that another ‘bio’ states John Cook is currently the Climate Communication Fellow for the Global Change Institute at the University of Queensland. =====> The University established the Global Change Institute (GCI), led by world-renowned researcher Professor Ove Hoegh-Guldberg, to provide a vehicle for collaborative research, learning, engagement and advocacy in major global change issues.
So looks like John has landed in clover, lots of GREEN $$tuff
Boy talk about swallowing the Progressive Kool Aid! These guys see themselves as some sort of techno-aristocracy handing down wisdom from on high to the sheeple and saving the world. Must be some head trip to think you will be ruling the world.
This is the reason you will not see these guys climbing down from CAGW. This gives you a glimpse of ‘The Cause’ mentioned in the Climategate e-mails stated in their own words.
I believe that that they also miss attributed that quote from Winston Churchill too. Most say Mark Twain but Charles Hadden Spurgeon did in 1885, contributing the wisdom to “an old proverb”.
In reply to Lief’s comment.
lsvalgaard says:
December 29, 2012 at 8:18 am
William says:
December 29, 2012 at 5:25 am
If I understand the mechanisms the solar magnetic cycle has been interrupted
What does that mean? As I understand the mechanisms the solar magnetic cycle behaves normally, no ‘interruption’ [depending on what you mean by that]
If my understanding of the mechanisms, what happen in the past, and what is currently happening to the sun is correct, solar cycle 24 will lead to an interruption to the solar magnetic cycle. (i.e. This is not a Maunder minimum.) The restart of the solar magnetic cycle is the hypothesized cause of a Heinrich event. You believe based on the assumed standard solar model that it is not possible for the solar magnetic cycle to be interrupted.
As I stated, there is concurrent with the cyclic Heinrich events massive cosmogenic isotope changes, an abrupt drop in planetary temperature, burn marks on the surface of the planet, and abrupt changes to the geomagnetic field. I started a quest 10 years ago looking for a physical explanation as to what causes the cyclic Heinrich event and the glacial/interglacial cycle and become sidetracked with sets of interrelated astronomical anomalies.
There is observational evidence that supports the assertion that there are significant fundamental errors in the standard solar model.
If and when there is unequivocal observational evidence that the solar magnetic cycle has been interrupted or if there are significant unexplained solar observations, there will be a something to discuss. I would expect the solar anomalies to start before there is a drop in planetary temperature. I would be very interested in your comments concerning any anomalous solar observations.
I have looked into each specialist’s deep cavern and pulled out the observational anomalies. The physics of what happens when very, very; large objects collapse is different than what is assumed. Black holes are a theoretical construct; they do not physically exist: the standard accretion disc model does not and cannot explain quasar evolution, quasar magnetic field structure, quasar jets, quasar clustering, structured ejection of material from the central galactic region, and so on. The object that forms is active not passive, it changes with time and affects the evolution and morphology of galaxies. There are 20 years of astronomical papers to support that assertion. The authors of the papers use the word anomaly, paradox, unexplained or missing mechanism to force observations to fit a pattern that should be random based on the standard models, and so on. The papers in question are at the end of the process of observation and analysis and are written by prominent specialists in each subfield.
The observational anomalies can be fit together like a jig saw puzzle, to provide an outline of the missing mechanisms.
The following is observational evidence that indicates there is something fundamental incorrect with the standard solar model.
“The Sun’s heat, generated by nuclear fusion in its core, is transported to the surface by convection in the outer third. However, our understanding of this process is largely theoretical—the Sun is opaque, so convection cannot be directly observed. As a result, theories largely rest on what we know about fluid flow and then applying them to the Sun, which is primarily composed of hydrogen, helium, and plasma.”
“Our current theoretical understanding of magnetic field generation in the Sun relies on these motions being of a certain magnitude,” explained Shravan Hanasoge, an associate research scholar in geosciences at Princeton University and a visiting scholar at NYU’s Courant Institute of Mathematical Sciences. “These convective motions are currently believed to prop up large-scale circulations in the outer third of the Sun that generate magnetic fields.”
“However, our results suggest that convective motions in the Sun are nearly 100 times smaller than these current theoretical expectations,” continued Hanasoge, also a postdoctoral fellow at the Max Plank Institute in Katlenburg-Lindau, Germany. “If these motions are indeed that slow in the Sun, then the most widely accepted theory concerning the generation of solar magnetic field is broken, leaving us with no compelling theory to explain its generation of magnetic fields and the need to overhaul our understanding of the physics of the Sun’s interior.”
http://arxiv.org/pdf/1206.3173.pdf
ANOMALOUSLY WEAK SOLAR CONVECTION (William: Based on observation not theory)
Henry@Gail
You are a yankee?
Henry@richard M
I explained here
http://wattsupwiththat.com/2012/12/28/dana-nuccitellis-holiday-trick-for-sobering-up-quick-put-a-little-less-rum-in-your-egg-nog/#comment-1185110
that the 0.8 degrees warming can be explained by the Gleisberg cycle.
Uselessly-protracted back-&-forth-silliness summary:
“As the sun moves across the sky, yin and yang gradually trade places with each other, revealing what was obscured and obscuring what was revealed.”
http://en.wikipedia.org/wiki/Yin-yang
No valuation placed on frugality.
—
As usual, Bill Illis provides the sensible, concise commentary.
Genuinely appreciated Bill. Thank you.
Bart says:
December 29, 2012 at 11:10 am
“What is that interval?”
That of observation.
For the sunspot number that is 400 years. The result of integration over that interval is a single number.
It is called the “Hale Cycle”. That is because it is named after Hale. If it were Vukcevic’s, it would be called the “Vukcevic Cycle”.
Hale did not assign a negative sign to every other solar cycle. Vuk does. Hence the ‘cycle’ Vuk works with is not Hale’s but Vuk’s.
Alec Rawls says:
December 29, 2012 at 11:24 am
High activity -> more UV -> more interaction with stratospheric ozone (creation and destruction) warms the stratosphere while at the same time less radiation gets through to warm the surface -> altered atmospheric circulation patterns.
The problem with this is that there has been no long-term trend the past 300 years. Another problem is that some recent observations [Jeff Harder] suggests that UV varies in anti-phase with the sunspot cycle [low activity – > more UV].
vukcevic says:
December 29, 2012 at 11:24 am
lsvalgaard says:
Thus the Earth magnetic field differentiates between odd and even cycles.
CMEs don’t behave like that. There is no difference between even and odd cycles: http://www.leif.org/research/Even-Odd-Dst.png
Alec Rawls says:
December 29, 2012 at 11:58 am
The claim that persistent high levels of forcing won’t cause continued warming is WRONG.
If the forcing increases at a step and stays persistently high forever, continued warming stops, i.e. the temperature stops increasing after a while.
William says:
December 29, 2012 at 12:29 pm
If my understanding of the mechanisms, what happen in the past, and what is currently happening to the sun is correct, solar cycle 24 will lead to an interruption to the solar magnetic cycle.
What does that mean? Interruption of what? What is an ‘interruption’?
DirkH says:
December 28, 2012 at 3:29 pm
You had pictures of handcuffed, blindfolded children in trunks of cars on your milk cartons in America in the 80ies?
>>>>>>>>>>>>>>>>>>>>>>>>
ROTFL… No the pictures were the last pictures the parents had of the child. Walmart now has similar pictures posted on the wall behind the checkout counters.
William says:
December 29, 2012 at 12:29 pm
There is observational evidence that supports the assertion that there are significant fundamental errors in the standard solar model. […]
The following is observational evidence that indicates there is something fundamental incorrect with the standard solar model.
I asked Hanasoge about that and he realizes that he went a bit ‘over the top’ and that his comments are confusing:
From: Shravan Hanasoge
I now realize it’s a bit of a confusing statement because it’s a slightly technical concept. The “rapidity” of solar rotation is defined in our context through the Rossby number: the ratio of convective velocity to the speed of rotation. It is largely thought that the Sun, in the context of Rossby number, is a slow rotator, i.e. that Coriolis forces play a very weak role in influencing convective motions. (which is actually true in the case of granulation; see also Miesch 2005, living reviews). However our results show that the convective motions are substantially weaker than previously thought, which means the Rossby number is very low and convection therefore is strongly influenced by rotation and Coriolis forces (much more so than previously thought). In that sense, the Sun is “fast rotator”.
Shravan
There is nothing fundamentally wrong with the standard solar model.
“Helioseismology, through the very accurate identification of oscillation frequencies of acoustic and fundamental modes, has clearly demonstrated that the standard solar models reproduce the behaviour of the Sun with remarkably accuracy, consistent within 1%.”
http://www.leif.org/EOS/1212-5077-Helioseismology.pdf