
Guest post by Alec Rawls
When he argues that a reduction in forcing will cause cooling Dana Nuccitelli is not actually talking about drinking. He is talking about the solar forcing of global temperature, but the drinking analogy is a handy way to understand where his argument goes off the rails.
Mr. Nuccitelli, who blogs for the consensus-approved Skeptical Science website, was writing about Henrik Svensmark’s GCR-cloud theory of indirect solar forcing, where Galactic Cosmic Rays are hypothesized to seed cloud formation. If Svensmark is right then a strong solar wind, by deflecting some GCR from reaching the earth, in-effect blows some of the clouds away, letting more sunlight through to warm the planet’s surface.
That can’t possibly explain late 20th century warming says Nuccitelli, because GCR deflection has been estimated (see the Krivova-Solanki graph above) to have peaked by 1980. The raw data suggests the actual GCR minimum was ten years later, but set that aside. Nuccitelli thinks it is the change in the level of forcing, not the level of forcing, that determines whether the climate system warms or cools:
So, if GCRs really do amplify the solar influence on global temperatures, since 1980 they are amplifying a cooling effect.
Cooling begins when a forcing passes its peak? Fail. Daily temperatures don’t start falling at noon. They continue rising until mid-afternoon. The hottest time of the year isn’t the first day of summer (the summer solstice, after which the days start getting shorter), the hottest time is mid-summer. To think cooling should start when forcing passes its peak is like thinking you can sober up by drinking just a little more slowly.
Here’s a tip for Dana to keep in mind on New Year’s eve: it is the level of alcohol forcing that matters. If you are drinking alcohol faster than you body is excreting it (not exactly the way the earth excretes heat, but similar enough), then your blood alcohol is rising. You are getting drunker, even if you have lowered the rate of your drinking! That’s right, putting a little less rum in your egg nog will not sober you up! Your increasing inebriation will just be a little less rapid, and it is the same for solar forcing.
When the peak level of forcing appears in the rearview mirror, the downward trend in the forcing that begins at that point does not cause cooling. It just causes warming to be a little less rapid. Only when the energy pouring into the climate system falls to the level of the energy escaping back out does the system stop warming. Empirically, that turns out to be mid-afternoon, mid-summer, and approximately the first decade of the 21st century.
Three blind mice
Dana Nuccitelli produced one of three widely cited rebuttals to my suggestion that a new sentence that was added to the Second Order Draft of AR5, a sentence that admits strong evidence for some substantial mechanism of solar amplification, is a “game changer.” That admission is on page 7-43 of the SOD:
Many empirical relationships have been reported between GCR or cosmogenic isotope archives and some aspects of the climate system … The forcing from changes in total solar irradiance alone does not seem to account for these observations, implying the existence of an amplifying mechanism such as the hypothesized GCR-cloud link.
That’s a game changer because the only solar forcing included in the IPCC computer models is the very slight variance in solar irradiance (also known as TSI, or “the solar constant”). If there are other solar forcings in play, working through variables that actually vary substantially as solar activity ramps up and down, that kills the report’s key finding (on page 8-4) that we can have “very high confidence that natural forcing is a small fraction of the anthropogenic forcing.”
The two most widely cited rebuttals, which I answered last week, were both by lead authors from the IPCC. Steven Sherwood, one of 15 lead authors of chapter 7, pretended that the admission of evidence for “an amplifying mechanism” was only about GCR-cloud. He then proceeded to claim that the evidence for GCR-cloud points to a weak mechanism, and used that as a grounds for dismissing the idea that any substantial solar forcing beyond TSI could be at work.
Doesn’t follow. The evidence for “an amplifying mechanism” (emphasis added) is entirely separate from the evidence for the GCR-cloud mechanism. The former is paleo evidence, where numerous studies of the geologic record have found strong correlations between solar activity and climate going back many thousands of years. The evidence for the GCR-cloud mechanism is from cloud-chamber experiments and ongoing observations of cloud micro-physics.
It doesn’t matter how unconvinced Sherwood is by the evidence for the GCR-cloud mechanism. That evidence does nothing to counter the paleo evidence, cited in the draft report, that some mechanism of enhanced solar forcing must be at work. By using his discontent with the GCR-cloud theory as an excuse to dismiss the paleo evidence, Sherwood is inverting the scientific method, and he is lying to the public about what the report says, making him a seriously bad guy.
Apparently weak minds think alike because Nuccitelli did the same thing Sherwood did, only a day earlier. Dana’s post only looks at the GCR-cloud mechanism and completely ignores the draft report’s admission of strong evidence for some mechanism of solar amplification. It is in the context of that more fundamental mistake that Nuccitelli goes on to completely misinterpret the evidence for the GCR-cloud mechanism itself, claiming that anything less than peak forcing causes cooling, arguing in-effect that he can sober up by drinking a little slower. Just tell that to the officer Dana. He won’t even need to give you a breathalyzer.
More evidence that weak minds think alike is the second semi-official rebuttal to my “game change” claim, issued by Joanna Haigh, a lead author of the IPCC’s third report. Haigh proceeds on the same dishonest pretence as Sherwood, telling NewScientist magazine that the new sentence in the draft report is only about GCR-cloud, which she then dismisses with the same drinking-game mistake that Dana makes, claiming that if climate were being driven by solar activity then the planet would have started cooling when solar activity was at its peak:
Haigh points out that the sun actually began dimming slightly in the mid-1980s, if we take an average over its 11-year cycle, so fewer GCRs should have been deflected from Earth and more Earth-cooling clouds should have formed. “If there were some way cosmic rays could be causing global climate change, it should have started getting colder after 1985.”
Sober up Joanna. Have a single shot instead of a double. Works every time.
Which theory has more trouble with flat 21st century temperatures?
It is amusing how Dana Nuccitelli, through sheer incompetence, was able to prefigure the highly credentialed malfeasance of both of these IPCC fraudsters. Still, Nuccitelli has to be credited with at least a bit of misfeasance of his own because he wasn’t satisfied with just assuring his gullible readers that cooling commences when forcing is at its peak. That only supplied an excuse for dismissing a solar explanation for late 20th century warming, leaving the conspicuous lack of 21st century warming still to be dealt with. Dana’s solution? Pretend that the flat 21st century temperature record militates against a solar driver of climate:
In fact, GCRs reaching Earth recently hit record high levels (Figure 4), yet temperatures are still way up.
Temperatures have merely flattened out, they haven’t gone down yet, and no Skeptical Science reader will ever learn that this is just what the discovered correlations between solar activity and climate predict. The strongest temperature response to a change in solar forcing is seen with a lag of about ten years (Usoskin et al. 2005), or one solar cycle (Solheim et al. 2012). The theory that is discomfited by flat 21st century temperatures is the CO2-warming theory, which predicts ever more rapidly increasing temperatures.
Dana might actually think that the flat 21st century temperature record causes trouble for the solar-warming theory but there is no way he can think it causes less trouble for the CO2-warming theory. For him to pretend that 21st century temperatures favor the CO2-warming theory is inexcusably dishonest, but as usual, the professionals are even worse. Note this little gem from the SOD (p. 7-44):
The lack of trend in the cosmic ray intensity over the last 50 years (Agee et al., 2012; McCracken and Beer, 2007) provides another strong argument against the hypothesis of a major contribution of cosmic rays to ongoing climate change.
That’s 15 IPCC lead authors all accepting the crackpot idea that you can only get drunk if your rate of drinking is going up. Steady exposure to the high 1950’s level of solar activity will keep you from warming, just as steady swilling of a high level of booze will keep you stone-cold sober. But where Dana only said that “temperatures are still way up” (implicitly acknowledging that they are no longer going up), the draft report here claims that temperatures are still going up (“ongoing climate change”).
Must be a Steven Sherwood sentence. He needs to look at page 10-3 of the SOD (emphasis added):
While the trend in global mean temperature since 1998 is not significantly different from zero, it is also consistent with natural variability superposed on the long-term anthropogenic warming trends projected by climate models.
Note that the “consistent with natural variability” part is a near call, after NOAA admitted in 2008 that 15 years of no warming would falsify current models. But yeah, let’s pretend it is the solar theory that has trouble with the lack of recent warming.
The Guardian, Andrew Sullivan, DeSmog, Romm etcetera, all pwned by Dana Nuccitelli’s error-filled AR5 post
The ensuing Skeptical Science newsletter bragged about how many eco-propagandists picked up on nutty Nuccitelli’s non-stop nonsense and the list is indeed impressive, a glaring testament to the total absence of due diligence on the part of these “journalists,” none of whom thought to question Dana’s advice on how to sober up quick. Here is the SkS tally of eco-scalps:
This was a very big week for SkS in the news. Dana’s IPCC Draft Report Leaked, Shows Global Warming is NOT Due to the Sun was re-posted and/or linked to by The Guardian, New York Times Green, New York Times Dot Earth, Huffington Post, Climate Progress, Mother Jones, Climate Crocks, Carbon Brief, Grist, Daily Beast, DeSmogBlog, Graham Readfearn, Der Spiegel, Maribo, Learn from Nature, Alternative Energy in the 21st Century, and Motherboard. It was also Tweeted by Michael Mann and Chris Mooney, among many others.
The only “consensus” journalist on this list who showed any integrity was Andrew Revkin, who had already written a post on my leak of the draft report. After updating that post with a link to Nuccitelli, Revkin updated again later with a link to the rebuttal that Jo Nova and I wrote about Seven Sherwood. Thanks Andrew, for being an actual journalist.
To put their “big week” in perspective the folks at Credulous Science reached high for sufficient words:
Winston Churchill once said: “A lie gets halfway around the world before the truth has a chance to get its pants on.” Not this time; we got the truth’s pants on in record time and nipped this myth in the bud before the contrarians were able to misinform the public.
The “truth” in their rendering is whatever patent falsehoods can be used to fool the ignorant into thinking they should fear CO2. No, nutty ones. You did not forge an exception to Churchill’s dictum. You provided a textbook example of it.
Dana is a poster child for those who feel a moral imperative to “believe the scientists”
For the last two years I have had a lot of fun exposing the large number of top climate scientists who claim that it is not the level of forcing that causes warming, but the trend in the forcing. They are all looking at the wrong derivative (one instead of zero).
Given the enormous pressure on the eco-left to accept what these government-funded climatologists are saying it is not surprising that someone like Dana Nuccitelli would swallow the idea that temperature really is driven by the trend in the forcing, and one super-wacky segment in Dana’s post indicates that he really is accepting that this is how physics works. If you leave a pot of water on a steady flame it won’t heat. If you want to heat the water you have to keep turning the flame up. The segment is titled, “Physical Reality Intrudes on Rawls”:
Rawls has argued to the contrary by claiming that the climate is still responding to the increase in solar activity from the early 20th century, and that GCRs are amplifying that solar warming from over 60 years ago. This argument is simply physically wrong. As Figure 2 illustrates, when solar activity rises, temperatures follow suit very soon thereafter. In fact, during the mid-20th century, solar activity and global surface temperatures both flattened out. Are we to believe that the planet suddenly began responding to the pre-1950 solar activity increase in 1975—2012, after not warming 1940—1975? The argument makes no physical sense.
Obviously I never said that late 20th century warming was caused by solar activity from the early 20th century and Dana does not give a citation for what argument of mine he is referring to but its easy to figure out. I have argued many times that if one combines the strong paleo correlations between solar activity and climate with the fact that solar activity was at what Ilya Usoskin calls “grand maximum” levels from 1920 to 2000 then it is certainly plausible that much of 20th century warming, including late 20th century warming, could have been caused by the sun. 80 years of a high level of enhanced solar forcing just might warm the place up a bit (and it only did warm a bit, about 0.8 °C over the century).
If I am attributing late 20th century warming to the high solar activity that persisted through 2000, why does Dana think I am attributing it to solar forcings from 60 years earlier? He must be fixed on the idea that only a change in the level of solar forcing can cause warming. That’s what all of these top scientists have been telling everyone and there was no rise in solar activity after 1950, hence any solar-caused warming would have to stem from the pre-1950 rise in solar activity.
But come on Dana. That is not what I am saying. That is what they are saying, and I have been trying my darnedest to expose it as a blatant misrepresentation. I’m not attributing late 20th century warming to the pre-1950 rise in solar activity. I’m attributing it to the fact that solar activity remained at close to the same high 1950’s level until 2000 (or 2003). It is the level of the forcing that causes warming, not the trend in the forcing.
I have to feel bad for Dana on this point. It isn’t his fault. He has been systematically duped by this parade of so-called scientists all telling him that a persistent high level of forcing can’t cause continued warming. Makes me want to put him on a milk carton. The poor guy isn’t just lost, he was kidnapped. Want a piece of candy little boy? Credulous Science indeed.
First off Bravo Camburn.
We have ocean currents, plate tectonics, volcanoes, cloud cover, winds, and a whole universe to effect us. There are so many variables it would be nearly impossible for one study of science to explain it with a single graph. Worse we seem to have tossed away major mechanisms, for scientific mysticism. We aren’t the only planet in the system experiencing change. Instead of “we don’t know why”, what we hear is “It has to be because I say so” or worse.. “my model or my corrected data says so.” That is not science. Science is fluid and changing, as man knows more, gets closer, observes directly, science progresses. If science becomes consensus, it becomes stagnant.
I do a lot of reading and I keep an open mind.. but nothing turns me away faster then an author that claims to absolutely know anything and models compared to the actual eco system of this planet are like pong on the first computers.. entertaining but primitive. Humans still don’t know how to make a truly closed ecosystem. All of those models have failed.
It is an interesting time, our sun is quiet, our magnetic field is supposedly weakening, and our poles are moving pretty quickly, but even those may have patterns they follow. We wobble after all. Meanwhile the world did not end.. AGAIN.. but maybe we again have overlooked the subtlety of the universe ( the show behind the sun) because we were too busy looking at the end of worlders throwing a fit in the street. We must keep letting our media, politicians and consensus scientists know that we aren’t playing their game anymore. Maybe it will sink in someday.
Right after the title “Three blind mice” you call Mr. Nuccitelli Mr. Nutticelli which comes to my mind too when I read his stuff, but since we sceptics are nice people, you should correct that. Regards from the Swiss mountains, Fred
[Good find. Thank you. Mod]
ggoodknight says:
December 28, 2012 at 6:51 pm
“Steve Mosher, GCR are very well correlated with ocean temps over geologic time. something like a 5C (memory failing me) range of equatorial ocean temps from min to max by Jan Veizer’s oxygen isotope proxies.”
Here:
http://www.phys.huji.ac.il/~shaviv/Ice-ages/GSAToday.pdf
@Freddie
A Freudian slip…?
Yes, I see you have taken up the summer solstice and daily temperature heat lags after a solar radiation peak, as well as the Usoskin paper, I blogged on this on skeptical science (sic) a few years ago, but they didn’t get it of course. Keep at it, a few honest consensus physicists will come out of the woodwork to politely inform them of their gross error sooner or later.
leif svalgaard says
You bet, and much longer than the ‘foreseeable future’.
henry says
To explain weather cycles, before they started with the carbon dioxide nonsense, they did look in the direction of the planets, rightly or wrongly. See here.
http://www.cyclesresearchinstitute.org/cycles-astronomy/arnold_theory_order.pdf
To quote from the above paper:
A Weather Cycle as observed in the Nile Flood cycle, Max rain followed by Min rain, appears discernible with maximums at 1750, 1860, 1950 and minimums at 1670, 1800, 1900 and a minimum at 1990 predicted.
(The 1990 turned out to be 1995 when cooling started!)
Please note: indeed one would expect more condensation (bigger flooding) at the end of a cooling period and minimum flooding at the end of a warm period. This is because when water vapor cools (more) it condensates (more) to water (i.e. more rain).
Now put my sine wave next to those dates?
http://blogs.24.com/henryp/2012/10/02/best-sine-wave-fit-for-the-drop-in-global-maximum-temperatures/
1900- minimum flooding : end of warming
1950 – maximum flooding: end of cooling
1995 – minimum flooding: end of warming
So far, I do not exclude a gravitational or electromagnetic swing/switch that changes the UV coming into earth. In turn this seems to change the chemical reactions of certain chemicals reacting to the UV lying on top of the atmosphere. This change in concentration of chemicals lying on top of us, i.e. O3, HxOx and NxOx, in turn causes more back radiation (when there is more), hence we are now cooling whilst ozone & others are increasing.
Hope this helps a few people.
the dates are important: ozone started declining in 1951 and started rising in 1995
If Leif or somebody can help to correlate that with the observed switch?
Is’nt this the same crowd that thinks that a decrease in the rate of government spending increase is a cut?
Leif writes “The ‘modern maximum’ is an artifact in the sunspot data series.”
Sunspots may be a proxy for TSI but they’re not a proxy for spectral variance. And we now know spectral variance is much greater than first assumed. There is still much we still dont know about how the sun affects our climate.
As to Mosher’s belief that GCRs have no correlation on cloud cover, do you really think a Forbush event is enough to capture that correlation (or lack thereof)? They only last a few days and our cloud data is pretty dodgy.
“Dana Nuccitelli’s holiday trick for sobering up quick: put a little less rum in your egg nog”
Perhaps the sobering would be even quicker with a little less Romm?
In reply to Leif above comments:
lsvalgaard says:
December 29, 2012 at 1:22 am & other comments.
This is where we have common ground. “Something is happening with the Sun”.
I believe we are all going to have an opportunity to observe how the sun causes the cyclic Heinrich events. As others have noted for example Gerald Bond there are massive cosmogenic isotope changes that correlate with the cyclic Heinrich events.There must be a physical explanation for the massive cosmogenic isotope changes, the geomagnetic field changes, and the abrupt cooling that all correlate with the cyclic Heinrich events.
If I understand the mechanisms the solar magnetic cycle has been interrupted which explains why Svensmark’s mechanism (High GCR, creates muons in the upper atmosphere, the muons in turn create ions, which in turn results in an increased in low level clouds at specific latitudes and a reduction in the formation of cirrus clouds. See Tinsley’s paper for details. An increase in low level clouds cools the planet as does a reduction of high latitude cirrus clouds. The cirrus clouds warm the high latitude regions by the greenhouse effect particularly during the winter) and the electroscavening mechanism appears to no longer be functioning.
Electroscavenging is the name Tinsley and others have given for a mechanism by which solar wind bursts create a space charge differential in the ionosphere which removes cloud forming ions.
The electroscavenging mechanism is related to Sprites which form at very high altitudes.
Leif’s power point.
http://www.leif.org/research/Solar-Petaluma–How%20Well%20Do%20We%20Know%20the%20SSN.pdf
Slide 19
“Something is happening with the Sun”
“We don’t know what causes this, but sunspots are becoming more difficult to see or not forming as they used to. There is speculation that this may be what a Maunder-type minimum looks like: magnetic fields still present [cosmic rays still modulated], but just not forming spots. If so, exciting times are ahead.”
William:
As note in the power point presentation, Livingston and Penn have found the magnetic field strength of newly formed sunspots is declining.
The solar large scale magnetic field is also declining.
http://www.solen.info/solar/polarfields/polar.html
http://www.solen.info/solar/
Slide 20
“Sun is perhaps entering a new very low activity Regime
•Fewer sunspots for given F10.7 flux
•Fewer sunspots for given Magnetic Plage Index
•Fewer spots per group
•Fewer small spots
•Less magnetic field per spot
•These changes have been progressive and accelerating since ~1990
•If continuing => possible Maunder Minimum”
William: If the sun causes Heinrich events and the sun is entering the conditions that cause a Heinrich event now, the sun is not entering a Maunder minimum. This will be a true interruption to the solar magnetic cycle. The solar cycle magnetic cycle continued to function during the Maunder minimum (1645 and continuing to about 1715).
http://elf.gi.alaska.edu/#intro
Introduction
Red sprites and blue jets are upper atmospheric optical phenomena associated with thunderstorms that have only recently been documented using low light level television technology.
The first images of a sprite were accidently obtained in 1989 (Franz et al., 1990). Beginning in 1990, about twenty images have been obtained from the space shuttle (Vaughan et al., 1992; Boeck et al., 1994).
Since then, video sequences of well over a thousand sprites have been captured. These include measurements from the ground ( Lyons, 1994; Winckler, 1995) and from aircraft (Sentman and Wescott, 1993; Sentman et al., 1995).
Numerous images have also been obtained from aircraft of blue jets ( Wescott et al., 1995), also a previously unrecorded form of optical activity above thunderstorms. Blue jets appear to emerge directly from the tops of clouds and shoot upward in narrow cones through the stratosphere. Their upward speed has been measured to be about 100 km per second.
Anecdotal reports of “rocket-like” and other optical emissions above thunderstorms go back more than a century (Lyons, 1994), and there have been several pilot reports of similar phenomena (Vaughan and Vonnegut, 1989). Possibly associated gamma ray bursts and TIPPS have also recently reported. Together, these phenomena suggest that thunderstorms exert a much greater influence on the middle and upper atmospheres than was previously suspected.
http://en.wikipedia.org/wiki/Upper-atmospheric_lightning
http://earthobservatory.nasa.gov/Newsroom/view.php?id=29510
Based on the observations, sprites normally begin almost 50 miles high as downward-moving “streamers” that appear spontaneously or at the bottom of a halo — diffuse flashes of light often associated with sprites. The streamers then branch out as they move down. At the same time, a brighter column of light expands both up and down from the starting point, followed by bright streamers that shoot higher into the sky.
http://www.newscientist.com/article/dn8733
“The whole structure develops a lot in one millisecond. So by going with the faster video we really see all the pieces and how they develop in time,” says Steven Cummer, assistant professor of electrical and computer engineering at Duke’s Pratt School of Engineering.
And with so much energy being pumped into a small region, Cummer says sprites may drive atmospheric chemistry that does not normally occur. “The significance at this point lies in what chemical effects these [sprites] may have on the upper atmosphere,” Cummer told New Scientist. The researchers say sprites typically begin at an altitude of about 50 miles (80 kilometres) in the sky in single spots where the electric field creates a spark. Those produce falling “streamers” that branch out as they fall. Much brighter, thicker channels follow, expanding upward from the original spots.
Leif, Could you please pointy out the error in the following train of logic?
1. Leif says:
“Cosmic Ray activity create radioactive isotopes (Carbon 14 and Beryllium 10] which can be found in tree rings and ice cores. The data goes back more than 10,000 years.
Here is how it is done: http://www.leif.org/EOS/Beer-GCRs.pdf ”
2. Leif acknowledges that Be10 and C14 can be used as proxies for determining long-term changes in the level of solar activity.
3. Leif reads the following two papers:
a. Solar influence on the Indian Ocean Monsoon through dynamical processes
Kunihiko Kodera [2004]
https://www.cfa.harvard.edu/~wsoon/Hiremath2012-d/Kodera04-SolarIndianMonsoon-decadal.pdf
b. The speleothem record of climate variability in Southern Arabia
Dominik Fleitmann and Albert Matter [2009]
http://ipac.kacst.edu.sa/eDoc/2010/189600_1.pdf
4. Leif dismisses the observational evidence showing a link between climate systems here on tthe Earth and long-term variations in the level of solar activity.
Climate’s Natural Variability is a direct consequence of the interaction between the Solar magnetic cycles and the geomagnetic input (backed by data from NOAA, SIDC and ETHZ).
– 21.3 years (Hale cycle) period is the primary component in the both solar and Earth magnetic variability
– 16.1 years period is specific to the Earth system, the cause is the Earth’s core-crust internal resonance (possibly triggered by the Hale cycle) equal to the propagation time in either direction (ref: Hide & Dickey) .
16 year period is the strongest component in the Arctic temperature spectrum, while on the opposite side in the Antarctic, its second harmonic (about 8 years) equals the Antarctic’s Circumpolar Wave’s period of oscillation (temperature cycles).
– Two other major ‘components’ the ENSO and AMO are products of cross-modulation.
More here? http://www.vukcevic.talktalk.net/NV.htm
Phillip Bradley: Let me try to be clearer because I think the analogy holds true.
Your statement: “Healthy adults metabolize/excrete alcohol at a constant rate. So if you continue drinking below this rate, you will indeed sober up.”
Statement in the original post: “Only when the energy pouring into the climate system falls to the level of the energy escaping back out does the system stop warming.”
In each case, there is a threshold rate (alcohol consumption/energy input) below which there is a decrease and above which there is an increase.
All analogies are imperfect models, but I can’t see any way in which your statements invalidate the analysis of the original post.
Ninderthana says:
December 29, 2012 at 5:34 am
4. Leif dismisses the observational evidence showing a link between climate systems here on tthe Earth and long-term variations in the level of solar activity.
=========
By similar logic, scientists have not discovered a mechanism by which gravity can affect matter. Until scientists discover such a mechanism it is not possible for gravity to affect matter.
We know the sun’s magnetic fields and solar wind are variable. Much more variable than TSI. We know that Carbon 14 and Beryllium 10 are good proxies for climate, and that these isotopes are not a result of TSI. Rather they are formed by the sun’s magnetic field and the solar wind.
We do not yet know the mechanism by which the sun determines earth’s climate, but we certainly know from the paleo records that it does. To argue that we need a mechanism before we can attribute cause and effect is nonsense.
What is the mechanism underlying Time? What causes time to move? Why is the rate of time affected by motion and acceleration? What is the mechanism?
Gravity and Time. Fundamental aspects of science. Both of which have no known mechanism. Why do scientists not argue that these cannot be affecting the earth? Isn’t this the argument behind climate science? If we don’t know the mechanism, then the sun cannot be affecting the earth’s climate.
ferd berple says
We know the sun’s magnetic fields and solar wind are variable. Much more variable than TSI
henry says
It is not the variation in the TSI as such; it seems (to me) it is the variation in the FUV and/or EUV that causes the differences in the concentration of the ozone and others that affect the energy coming in.
William says:
December 29, 2012 at 5:25 am
If I understand the mechanisms the solar magnetic cycle has been interrupted
What does that mean? As I understand the mechanisms the solar magnetic cycle behaves normally, no ‘interruption’ [depending on what you mean by that]
ferd berple says:
December 29, 2012 at 7:26 am
We know the sun’s magnetic fields and solar wind are variable.
There has been no long-term trend in sun’s magnetic field and solar wind since the 1830s.
We know that Carbon 14 and Beryllium 10 are good proxies for climate
Climate influences the deposition of 14C and 10Be, so there is some correlation there, but it goes in the opposite direction.
and that these isotopes are not a result of TSI. Rather they are formed by the sun’s magnetic field and the solar wind.
Variations in the solar wind AND in TSI are caused by the Sun’s magnetic field.
O/T
Someone should be taking screen shots over at SS. Ron King is asking pertinent questions addressed to Dana’s post http://skepticalscience.com/news.php?n=1791. If SS follows its normal behavior, Mr. King will soon be banned and his posts modified.
lsvalgaard says:
December 29, 2012 at 1:41 am
“Which are based on obsolete datasets of solar activity. Before you make such conclusions, it might be a good idea to examine the evidence: http://www.leif.org/research/Solar-Petaluma–How%20Well%20Do%20We%20Know%20the%20SSN.pdf”
Leif, your (peer reviewed?) poster session falsifies all the research that have shown a correlation between solar activity and climate? And I was supposed to have had examined THE evidence that you presented 4 weeks ago? Are you serious?
HenryP says:
December 29, 2012 at 8:11 am
It is not the variation in the TSI as such; it seems (to me) it is the variation in the FUV and/or EUV that causes the differences in the concentration of the ozone
The UV creates the ionosphere. Movement of this conduction layer [due to the day-night cycle] results in a dynamo electrical current. The magnetic effect from that current can be measured on the ground [George Graham discovered this in 1722] and those magnetic effects have been measured ever since. The result is that there has been no long-term change in FUV since 1722.
Ninderthana says:
December 29, 2012 at 5:34 am
Leif, Could you please pointy out the error in the following train of logic?
E.g. the Kodera paper states that the effects are not due to solar radiative forcing, but “The present analysis demonstrated that the regional impact of Indian Ocean is related to stratospheric variation”.
vukcevic says:
December 29, 2012 at 6:55 am
– 21.3 years (Hale cycle) period is the primary component in the both solar and Earth magnetic variability
Solar activity [by any of the many measures] does not have a ~21 year cycle. The period is ~11 years. Your ‘Hale cycle’ is made up by putting a negative sign on every other 11-yr cycle. This is unphysical.
Chris Schoneveld says:
December 29, 2012 at 8:54 am
Leif, your (peer reviewed?) poster session falsifies all the research that have shown a correlation between solar activity and climate? And I was supposed to have had examined THE evidence that you presented 4 weeks ago? Are you serious?
Yes, I am serious.
[snip. Go away. — mod.]
A standard simplified model for temperature of an object heated by an external forcing is
dT/dt = -T/tau + F
where T is temperature, tau is a thermal time constant, and F is the forcing. It is, of course, a natural characteristic of this equation that the temperature will continue to rise when the forcing levels out for short intervals relative to tau.
If one is looking at the system over a very short timeline relative to tau, the equation becomes approximately
dT/dt := F
Various commenters on these boards over the years have pointed out that, if you integrate various solar indices, you get a very clear and pronounced correlation between Earthly temperatures and solar activity. So, you might consider performing such a comparison in your plot at the top of this article, using a model of the form
dT/dt = k*(CRC – CRC_eq)
where CRC is the cosmic ray count, CRC_eq is an equilibrium count to be determined, and k is a coupling constant, also TBD. The effect of solar forcing is cumulative across timelines which could easily be as long as centuries, and that is where the simpleminded analyses of Messrs. Nuccitelli, Sherwood, et al. go astray.
lsvalgaard says:
December 29, 2012 at 9:26 am
vukcevic says:
December 29, 2012 at 6:55 am
– 21.3 years (Hale cycle) period is the primary component in the both solar and Earth magnetic variability
Solar activity [by any of the many measures] does not have a ~21 year cycle. The period is ~11 years. Your ‘Hale cycle’ is made up by putting a negative sign on every other 11-yr cycle. This is unphysical.
…………….
No it is not.
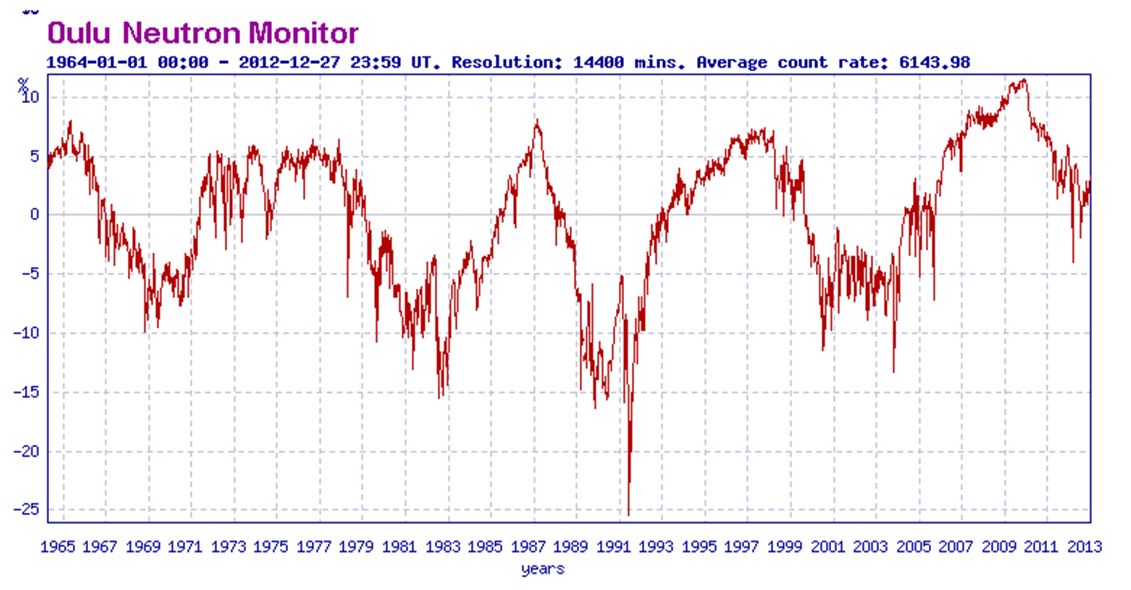
The Earth’s magnetic field differentiates between odd and even cycles.
How do we know that?
By different shape of neutron count during the even cycles to the shape of the NC for the odd cycles.
http://i191.photobucket.com/albums/z36/AlecRawls/Environment%20and%20climate/NeutronCount_Oulu_1964-2012_large_zps7997e229.png
Anyway, one can use SSN as proxy for solar polar field, since there are only three cycles of the PF available.
Your argument is invalid