
Guest post by Alec Rawls
When he argues that a reduction in forcing will cause cooling Dana Nuccitelli is not actually talking about drinking. He is talking about the solar forcing of global temperature, but the drinking analogy is a handy way to understand where his argument goes off the rails.
Mr. Nuccitelli, who blogs for the consensus-approved Skeptical Science website, was writing about Henrik Svensmark’s GCR-cloud theory of indirect solar forcing, where Galactic Cosmic Rays are hypothesized to seed cloud formation. If Svensmark is right then a strong solar wind, by deflecting some GCR from reaching the earth, in-effect blows some of the clouds away, letting more sunlight through to warm the planet’s surface.
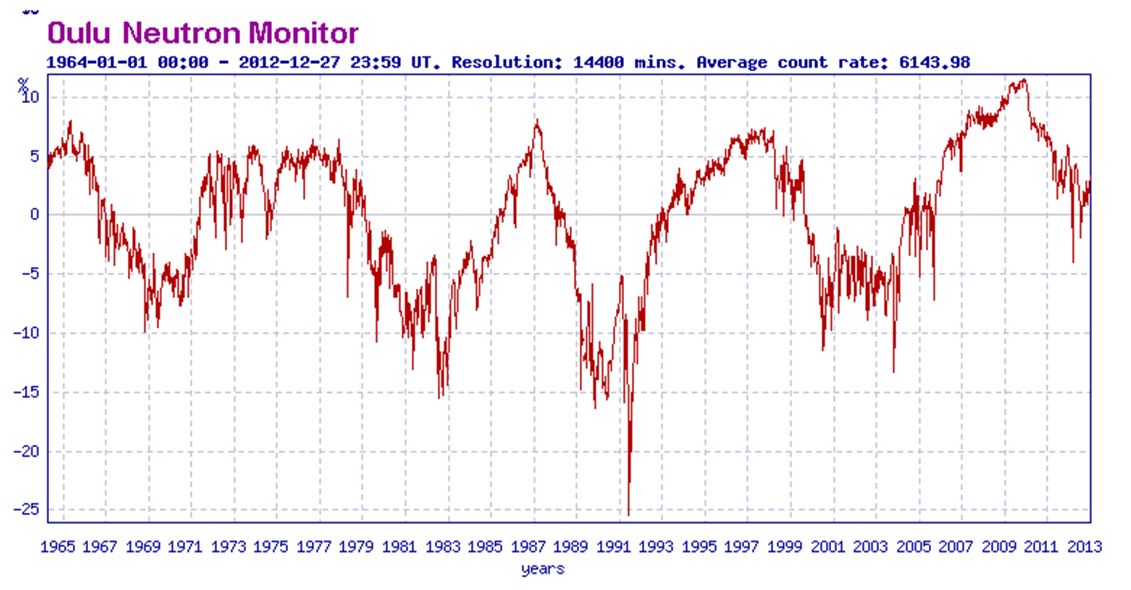
That can’t possibly explain late 20th century warming says Nuccitelli, because GCR deflection has been estimated (see the Krivova-Solanki graph above) to have peaked by 1980. The raw data suggests the actual GCR minimum was ten years later, but set that aside. Nuccitelli thinks it is the change in the level of forcing, not the level of forcing, that determines whether the climate system warms or cools:
So, if GCRs really do amplify the solar influence on global temperatures, since 1980 they are amplifying a cooling effect.
Cooling begins when a forcing passes its peak? Fail. Daily temperatures don’t start falling at noon. They continue rising until mid-afternoon. The hottest time of the year isn’t the first day of summer (the summer solstice, after which the days start getting shorter), the hottest time is mid-summer. To think cooling should start when forcing passes its peak is like thinking you can sober up by drinking just a little more slowly.
Here’s a tip for Dana to keep in mind on New Year’s eve: it is the level of alcohol forcing that matters. If you are drinking alcohol faster than you body is excreting it (not exactly the way the earth excretes heat, but similar enough), then your blood alcohol is rising. You are getting drunker, even if you have lowered the rate of your drinking! That’s right, putting a little less rum in your egg nog will not sober you up! Your increasing inebriation will just be a little less rapid, and it is the same for solar forcing.
When the peak level of forcing appears in the rearview mirror, the downward trend in the forcing that begins at that point does not cause cooling. It just causes warming to be a little less rapid. Only when the energy pouring into the climate system falls to the level of the energy escaping back out does the system stop warming. Empirically, that turns out to be mid-afternoon, mid-summer, and approximately the first decade of the 21st century.
Three blind mice
Dana Nuccitelli produced one of three widely cited rebuttals to my suggestion that a new sentence that was added to the Second Order Draft of AR5, a sentence that admits strong evidence for some substantial mechanism of solar amplification, is a “game changer.” That admission is on page 7-43 of the SOD:
Many empirical relationships have been reported between GCR or cosmogenic isotope archives and some aspects of the climate system … The forcing from changes in total solar irradiance alone does not seem to account for these observations, implying the existence of an amplifying mechanism such as the hypothesized GCR-cloud link.
That’s a game changer because the only solar forcing included in the IPCC computer models is the very slight variance in solar irradiance (also known as TSI, or “the solar constant”). If there are other solar forcings in play, working through variables that actually vary substantially as solar activity ramps up and down, that kills the report’s key finding (on page 8-4) that we can have “very high confidence that natural forcing is a small fraction of the anthropogenic forcing.”
The two most widely cited rebuttals, which I answered last week, were both by lead authors from the IPCC. Steven Sherwood, one of 15 lead authors of chapter 7, pretended that the admission of evidence for “an amplifying mechanism” was only about GCR-cloud. He then proceeded to claim that the evidence for GCR-cloud points to a weak mechanism, and used that as a grounds for dismissing the idea that any substantial solar forcing beyond TSI could be at work.
Doesn’t follow. The evidence for “an amplifying mechanism” (emphasis added) is entirely separate from the evidence for the GCR-cloud mechanism. The former is paleo evidence, where numerous studies of the geologic record have found strong correlations between solar activity and climate going back many thousands of years. The evidence for the GCR-cloud mechanism is from cloud-chamber experiments and ongoing observations of cloud micro-physics.
It doesn’t matter how unconvinced Sherwood is by the evidence for the GCR-cloud mechanism. That evidence does nothing to counter the paleo evidence, cited in the draft report, that some mechanism of enhanced solar forcing must be at work. By using his discontent with the GCR-cloud theory as an excuse to dismiss the paleo evidence, Sherwood is inverting the scientific method, and he is lying to the public about what the report says, making him a seriously bad guy.
Apparently weak minds think alike because Nuccitelli did the same thing Sherwood did, only a day earlier. Dana’s post only looks at the GCR-cloud mechanism and completely ignores the draft report’s admission of strong evidence for some mechanism of solar amplification. It is in the context of that more fundamental mistake that Nuccitelli goes on to completely misinterpret the evidence for the GCR-cloud mechanism itself, claiming that anything less than peak forcing causes cooling, arguing in-effect that he can sober up by drinking a little slower. Just tell that to the officer Dana. He won’t even need to give you a breathalyzer.
More evidence that weak minds think alike is the second semi-official rebuttal to my “game change” claim, issued by Joanna Haigh, a lead author of the IPCC’s third report. Haigh proceeds on the same dishonest pretence as Sherwood, telling NewScientist magazine that the new sentence in the draft report is only about GCR-cloud, which she then dismisses with the same drinking-game mistake that Dana makes, claiming that if climate were being driven by solar activity then the planet would have started cooling when solar activity was at its peak:
Haigh points out that the sun actually began dimming slightly in the mid-1980s, if we take an average over its 11-year cycle, so fewer GCRs should have been deflected from Earth and more Earth-cooling clouds should have formed. “If there were some way cosmic rays could be causing global climate change, it should have started getting colder after 1985.”
Sober up Joanna. Have a single shot instead of a double. Works every time.
Which theory has more trouble with flat 21st century temperatures?
It is amusing how Dana Nuccitelli, through sheer incompetence, was able to prefigure the highly credentialed malfeasance of both of these IPCC fraudsters. Still, Nuccitelli has to be credited with at least a bit of misfeasance of his own because he wasn’t satisfied with just assuring his gullible readers that cooling commences when forcing is at its peak. That only supplied an excuse for dismissing a solar explanation for late 20th century warming, leaving the conspicuous lack of 21st century warming still to be dealt with. Dana’s solution? Pretend that the flat 21st century temperature record militates against a solar driver of climate:
In fact, GCRs reaching Earth recently hit record high levels (Figure 4), yet temperatures are still way up.
Temperatures have merely flattened out, they haven’t gone down yet, and no Skeptical Science reader will ever learn that this is just what the discovered correlations between solar activity and climate predict. The strongest temperature response to a change in solar forcing is seen with a lag of about ten years (Usoskin et al. 2005), or one solar cycle (Solheim et al. 2012). The theory that is discomfited by flat 21st century temperatures is the CO2-warming theory, which predicts ever more rapidly increasing temperatures.
Dana might actually think that the flat 21st century temperature record causes trouble for the solar-warming theory but there is no way he can think it causes less trouble for the CO2-warming theory. For him to pretend that 21st century temperatures favor the CO2-warming theory is inexcusably dishonest, but as usual, the professionals are even worse. Note this little gem from the SOD (p. 7-44):
The lack of trend in the cosmic ray intensity over the last 50 years (Agee et al., 2012; McCracken and Beer, 2007) provides another strong argument against the hypothesis of a major contribution of cosmic rays to ongoing climate change.
That’s 15 IPCC lead authors all accepting the crackpot idea that you can only get drunk if your rate of drinking is going up. Steady exposure to the high 1950’s level of solar activity will keep you from warming, just as steady swilling of a high level of booze will keep you stone-cold sober. But where Dana only said that “temperatures are still way up” (implicitly acknowledging that they are no longer going up), the draft report here claims that temperatures are still going up (“ongoing climate change”).
Must be a Steven Sherwood sentence. He needs to look at page 10-3 of the SOD (emphasis added):
While the trend in global mean temperature since 1998 is not significantly different from zero, it is also consistent with natural variability superposed on the long-term anthropogenic warming trends projected by climate models.
Note that the “consistent with natural variability” part is a near call, after NOAA admitted in 2008 that 15 years of no warming would falsify current models. But yeah, let’s pretend it is the solar theory that has trouble with the lack of recent warming.
The Guardian, Andrew Sullivan, DeSmog, Romm etcetera, all pwned by Dana Nuccitelli’s error-filled AR5 post
The ensuing Skeptical Science newsletter bragged about how many eco-propagandists picked up on nutty Nuccitelli’s non-stop nonsense and the list is indeed impressive, a glaring testament to the total absence of due diligence on the part of these “journalists,” none of whom thought to question Dana’s advice on how to sober up quick. Here is the SkS tally of eco-scalps:
This was a very big week for SkS in the news. Dana’s IPCC Draft Report Leaked, Shows Global Warming is NOT Due to the Sun was re-posted and/or linked to by The Guardian, New York Times Green, New York Times Dot Earth, Huffington Post, Climate Progress, Mother Jones, Climate Crocks, Carbon Brief, Grist, Daily Beast, DeSmogBlog, Graham Readfearn, Der Spiegel, Maribo, Learn from Nature, Alternative Energy in the 21st Century, and Motherboard. It was also Tweeted by Michael Mann and Chris Mooney, among many others.
The only “consensus” journalist on this list who showed any integrity was Andrew Revkin, who had already written a post on my leak of the draft report. After updating that post with a link to Nuccitelli, Revkin updated again later with a link to the rebuttal that Jo Nova and I wrote about Seven Sherwood. Thanks Andrew, for being an actual journalist.
To put their “big week” in perspective the folks at Credulous Science reached high for sufficient words:
Winston Churchill once said: “A lie gets halfway around the world before the truth has a chance to get its pants on.” Not this time; we got the truth’s pants on in record time and nipped this myth in the bud before the contrarians were able to misinform the public.
The “truth” in their rendering is whatever patent falsehoods can be used to fool the ignorant into thinking they should fear CO2. No, nutty ones. You did not forge an exception to Churchill’s dictum. You provided a textbook example of it.
Dana is a poster child for those who feel a moral imperative to “believe the scientists”
For the last two years I have had a lot of fun exposing the large number of top climate scientists who claim that it is not the level of forcing that causes warming, but the trend in the forcing. They are all looking at the wrong derivative (one instead of zero).
Given the enormous pressure on the eco-left to accept what these government-funded climatologists are saying it is not surprising that someone like Dana Nuccitelli would swallow the idea that temperature really is driven by the trend in the forcing, and one super-wacky segment in Dana’s post indicates that he really is accepting that this is how physics works. If you leave a pot of water on a steady flame it won’t heat. If you want to heat the water you have to keep turning the flame up. The segment is titled, “Physical Reality Intrudes on Rawls”:
Rawls has argued to the contrary by claiming that the climate is still responding to the increase in solar activity from the early 20th century, and that GCRs are amplifying that solar warming from over 60 years ago. This argument is simply physically wrong. As Figure 2 illustrates, when solar activity rises, temperatures follow suit very soon thereafter. In fact, during the mid-20th century, solar activity and global surface temperatures both flattened out. Are we to believe that the planet suddenly began responding to the pre-1950 solar activity increase in 1975—2012, after not warming 1940—1975? The argument makes no physical sense.
Obviously I never said that late 20th century warming was caused by solar activity from the early 20th century and Dana does not give a citation for what argument of mine he is referring to but its easy to figure out. I have argued many times that if one combines the strong paleo correlations between solar activity and climate with the fact that solar activity was at what Ilya Usoskin calls “grand maximum” levels from 1920 to 2000 then it is certainly plausible that much of 20th century warming, including late 20th century warming, could have been caused by the sun. 80 years of a high level of enhanced solar forcing just might warm the place up a bit (and it only did warm a bit, about 0.8 °C over the century).
If I am attributing late 20th century warming to the high solar activity that persisted through 2000, why does Dana think I am attributing it to solar forcings from 60 years earlier? He must be fixed on the idea that only a change in the level of solar forcing can cause warming. That’s what all of these top scientists have been telling everyone and there was no rise in solar activity after 1950, hence any solar-caused warming would have to stem from the pre-1950 rise in solar activity.
But come on Dana. That is not what I am saying. That is what they are saying, and I have been trying my darnedest to expose it as a blatant misrepresentation. I’m not attributing late 20th century warming to the pre-1950 rise in solar activity. I’m attributing it to the fact that solar activity remained at close to the same high 1950’s level until 2000 (or 2003). It is the level of the forcing that causes warming, not the trend in the forcing.
I have to feel bad for Dana on this point. It isn’t his fault. He has been systematically duped by this parade of so-called scientists all telling him that a persistent high level of forcing can’t cause continued warming. Makes me want to put him on a milk carton. The poor guy isn’t just lost, he was kidnapped. Want a piece of candy little boy? Credulous Science indeed.
@ShrNfr:
Nice catch on the cosmic side… Looks like a somewhat ‘cooked’ series in that the neutron count has 4 roughly equal peaks while the above graph, or the same period, as 2 and ends low.
On the temperature side, they use GISS, which is an ‘outlier high’ anyway, but it is based on GHCN where they have now moved more of the ‘adjusting the past cooler’.
This series looks at GHCN version1 vs version3 for the same time interval. Supposedly this is THE SAME data set:
https://chiefio.wordpress.com/v1vsv3/
and just the ‘fixing’ of it introduces a warming trend.
So the basic data, warmed, pruned, and adjusted; with added TOBS and ‘wrong way UHI’ and an “MMTS cooling bias adjustment” that was really locking in place an ‘aging paint on Stevenson Screens false warming” all bundled in, gets run through GIStemp to make the above basic “pasteurized data food product”.
Yet even that isn’t enough. They put an 11 year average on it. That means the last 11 years of data don’t show the recent trend correctly. “Smoothing” hides inflection points, especially at the ends. ( A simple moving average worse than most, but we don’t know what method was used).
Personally, I’ll take the snow cover as my guide. As of now, we’ve got more % snow cover in the USA than last year and we’ve only just started winter.
We’ve go snow all the way down to Dallas, Texas. We’ve got glaciers growing on Mt. Shasta. We’ve got Russia and China in a frozen meat locker. We’ve got N. Hemisphere snow above the ‘climatology’ average. ( I’m sure we’re going to be told “But it’s a WARM snow!” 😉
http://moe.met.fsu.edu/snow/
doesn’t even have the latest on it (two days old right now) and we’re already “coloring outside the lines”…
So that temperature line on the graph is bogus at every possible step.
(And no, I’m not blaming you Alec! You are just using the graph they did… which gives us ‘target practice’ 😉
So given that both lines are bogus on the graph, I’m not surprised their arguments are broken too…
BTW: I fully followed the argument and the drinking analogy. It is correct. We need to drop below the level of balance to see reduction. For booze, it’s about “one drink / hour” (depends on the person, though) and it only changes how fast you get drunk when over that 1/hr. This is what is taught in traffic school (don’t ask 😉 and I’ve tested it and proven it ( 6 pack fast is effective, 6 pack 1 / hour does nothing… 3/ hour is intermediate…)
The extreme AGW paradigm pushers have painted themselves into a corner. There are cycles of warming and cooling in the paleoclimatic record that correlate with cosmogenic isotope changes. There is smoking gun evidence that the sun is a serial climate changer. The answer to how the sun serially changes climate is more complicated and interesting than changes to the solar heliosphere that modulate GCR.
I have seen no discussion electroscavenging in the general media or at Real Climate, except for my postings.
There is peer reviewed published papers concerning a reduction in planetary cloud cover that correlates with the 20th century warming. The questions are: 1) Why was there a reduction in planetary cover (see below for details) and 2) will the cloud cover return (yes).
Note the reduction in cloud cover is at the same latitude as predicted by Tinsley’s electroscavenging mechanism. (The continuation of the suppression of cloud cover – post 2006 – is due to a third mechanism.)
The following is another paper by Tinsley that explains the electroscavenging mechanism. Solar wind bursts create a space charge differential in the ionosphere. The space charge differential removes cloud forming ions.
The electroscavenging mechanism explains why there was a reduction in planetary clouds when GCR has high, as there were solar wind bursts during the declining period of the solar cycle caused by coronal holes on the solar surface.
http://www.atmos-chem-phys.org/5/1721/2005/acp-5-1721-2005.html
Analysis of the decrease in the tropical mean outgoing shortwave radiation at the top of atmosphere for the period 1984–2000
All cloud types show a linearly decreasing trend over the study period, with the low-level clouds having the largest trend, equal to −3.9±0.3% in absolute values or −9.9±0.8% per decade in relative terms. Of course, there are still some uncertainties, since the changes in low-level clouds derived from the ISCCP-D2 data, are not necessarily consistent with changes derived from the second Stratospheric Aerosols and Gas Experiment (SAGE II, Wang et al., 2002) and synoptic observations (Norris, 1999). Nevertheless, note that SAGE II tropical clouds refer to uppermost opaque clouds (with vertical optical depth greater than 0.025 at 1.02μm), while the aforementioned synoptic cloud observations are taken over oceans only. The midlevel clouds decreased by 1.4±0.2% in absolute values or by 6.6±0.8% per decade in relative terms, while the high-level ones also decreased by 1.2±0.4% or 3±0.9% per decade in relative terms, i.e. less than low and middle clouds. Thus, the VIS/IR mean tropical (30_ S–30_ N) low-level clouds are found to have undergone the greatest decrease during the period 1984–2000, in agreement with the findings of Chen et al. (2002) and Lin et al. (2004).
http://www.utdallas.edu/physics/faculty/tinsley/Role%20of%20Global%20Circuit.pdf
Tinsley et al.
The role of the global electric circuit in solar and internal forcing of clouds and climate
Look at figure 12 in the attached which shows the number of solar magnetic storms per year, from 1865 to present and the solar cycle number. There is a roughly 20 times increase in the number of magnetic storms at the end of the solar cycles, when comparing the 20th century to the 19th century. It is not just the number, but the magnitude of the solar storms.
http://www.geomag.bgs.ac.uk/earthmag.html#_Toc2075558
http://sait.oat.ts.astro.it/MSAIt760405/PDF/2005MmSAI..76..969G.pdf
Once again about global warming and solar activity
K. Georgieva1, C. Bianchi2 and B. Kirov1
The real terrestrial impact of the different solar drivers depends not only on the average
geoeffectiveness of a single event but also on the number of events. Figure 5 presents the
yearly number of CHs, CMEs and MCs in the period 1992-2002. On the descending phase
of the sunspot cycle, the greatest part of high speed solar wind streams affecting the Earth comes from coronal holes (Figure 5), in this period their speed is higher than the speed of the solar wind originating from other regions, and their geoeffectiveness is the highest. Therefore, when speaking about the influence Fig. 4. Solar cycle variations of the average geoeffectiveness of solar wind from CHs, MCs and CMEs. Fig. 5. Yearly number of CHs, MCs and CMEs of solar activity on the Earth, we cannot neglect the contribution of the solar wind originating from coronal holes. However, these open magnetic field regions are not connected in any way to sunspots, so their contribution is totally neglected when we use the sunspot number as a measure of solar activity.
The second peak, related to high speed solar wind from coronal holes, seems to have
increased relative to the first one, related to sunspots (CMEs) but, as already mentioned, this type of solar activity is not accounted for by the sunspot number. In Figure 6 the long-term variations in global temperature are compared to the long-term variations in geomagnetic activity as expressed by the ak-index (Nevanlinna and Kataja 2003). The correlation between the two quantities is 0.85 with p<0.01 for the whole period studied.
William says:
December 28, 2012 at 7:45 pm
The majority of the 20th century warming has caused by solar modulation of planetary cloud cover.
That and all the rest fly in the face of the fact that solar modulation has not had any long-term trend the past 300 years.
Ninderthana says:
December 28, 2012 at 7:53 pm
As per usual, the main characters in the shadow-debate here completely miss the central point. Alec Rawls is arguing that there is some (unknown) amplification factor that increases the impact of changes in the level of solar activity on the Earth’s climate.
Since solar activity has not had any long-term trend the past 300 years, then Earth’s climate would not have either.
E.M.Smith says: December 28, 2012 at 9:18 pm
“…I’ve tested it and proven it ( 6 pack fast is effective, 6 pack 1 / hour does nothing… 3/ hour is intermediate…)…”
With all these models and adjusted charts, isn’t it marvelous to see there are still dedicated and meticulous scientists who will get in and do essential basic research!? 🙂
William says:
December 28, 2012 at 7:45 pm
See this paper by Brian Tinsley and Fangqun Yu
Tinsley partially relies on an effect [the Wilcox effect] of which I was a co-discoverer. This effect has long been discredited and is no longer considered valid by the [still living] discoverers.
The solar heliosphere stretches out about 20 light hours (near the orbit of Uranus.)
No, it stretches five times farther.
global temperature are compared to the long-term variations in geomagnetic activity
Geomagnetic activity has had no trend since 1844: http://www.leif.org/research/Ap-1844-now.png
The Svensmark cosmic ray-temperature link ( to the extent that there may be one), is a bit more complex than say just in phase or out of phase. Some have mentioned an 11 year variability, as if the effect was solar cycle linkage. If solar magnetism reverses each 11 years, while earth magnetism doesn’t, the resultant near earth magnetic field, would have some sort of 22 year cyclic variation. Since CRs result in charged particle showers, such particles can be steered by the net field, resulting in a redistribution from equator to poles (magnetic), and with more moisture in the tropics, than the polar regions, any effect of cloud formation, would be more effective if charged particles aren’t routed to the magnetic polar regions (by spiralling around the field lines).
So magnetic redistribution of CR charged particles, might have more effect than simple change in cr counts.
Of course it woult take actual data to determine if this is another butterfly wing effect, or is of observable magnitude.
I’m not equipped to follow on that; but presumably Svensmark is.
Thanks for the electrical circuit stuff William. Hopefully I can get around to the Tinsley and Yu paper. Looks interesting.
George E. Smith says:
December 28, 2012 at 9:51 pm
the resultant near earth magnetic field, would have some sort of 22 year cyclic variation.
It does, but not the way you think. The polarity change [at solar maximum] introduces a slight variation of the SHAPE of the solar modulation. You can see that here: http://www.leif.org/research/Neutron-Monitors-Real-Time.htm
Scroll to the last page and look at the red curve for Hermanus. You might notice that every other peak is sharp, while the intervening peaks are broader. The reason for this is well-understood and has to do with a polarity-dependent drift of GCRs.
In reply to lsvalgaard says:
December 28, 2012 at 9:33 pm
The portion of the heliosphere that deflects GCR extends to the orbit of Uranus. The heliosphere does extend roughly 5 times further.
The geomagnetic field parameter that correlates with the planetary temperature change is AK. I quoted a published paper that notes the correlation. Did you look at the paper?
http://www.agu.org/pubs/crossref/2009/2009JA014342.shtml
If the Sun is so quiet, why is the Earth ringing? A comparison of two solar minimum intervals.
Observations from the recent Whole Heliosphere Interval (WHI) solar minimum campaign are compared to last cycle’s Whole Sun Month (WSM) to demonstrate that sunspot numbers, while providing a good measure of solar activity, do not provide sufficient information to gauge solar and heliospheric magnetic complexity and its effect at the Earth. The present solar minimum is exceptionally quiet, with sunspot numbers at their lowest in 75 years and solar wind magnetic field strength lower than ever observed. Despite, or perhaps because of, a global weakness in the heliospheric magnetic field, large near-equatorial coronal holes lingered even as the sunspots disappeared. Consequently, for the months surrounding the WHI campaign, strong, long, and recurring high-speed streams in the solar wind intercepted the Earth in contrast to the weaker and more sporadic streams that occurred around the time of last cycle’s WSM campaign.
(Sorry this link does not copy. Google “Once again about global warming and solar activity” and have a look at the paper.)
http://sait.oat.ts.astro.it/MSAIt760405/PDF/2005MmSAI..76..969G.pdf
Once again about global warming and solar activity K. Georgieva, C. Bianchi, and B. Kirov
We show that the index commonly used for quantifying long-term changes in solar activity, the sunspot number, accounts for only one part of solar activity and using this index leads to the underestimation of the role of solar activity in the global warming in the recent decades. A more suitable index is the geomagnetic activity which reflects all solar activity, and it is highly correlated to global temperature variations in the whole period for which we have data.
In Figure 6 the long-term variations in global temperature are compared to the long-term variations in geomagnetic activity as expressed by the ak-index (Nevanlinna and Kataja 2003). The correlation between the two quantities is 0.85 with p<0.01 for the whole period studied.It could therefore be concluded that both the decreasing correlation between sunspot number and geomagnetic activity, and the deviation of the global temperature long-term trend from solar activity as expressed by sunspot index are due to the increased number of high-speed streams of
solar wind on the declining phase and in the minimum of sunspot cycle in the last decades.
Alec Rawls
Regarding “levels” vs “trends”, recommend comparing David Stockwell’s Solar Accumulation Theory and Solar Supersensitivity.
Note especially the differences between I(1) and I(2).
And thanks to Leif for his warning on the limitations of Tinsley and Yu.
There are published papers from specialists that support the assertion that the sun was unusually active in the later part of the 20th century and there are published papers to support the electroscavening mechanism. (There is an observed change in cloud cover and precipitation changes.)
It is natural for there to be disagreement among specialists. It is very common for one side to believe it is impossible for the other side to be correct.
As it appears the solar magnetic cycle has been interrupted we can resolve this discussion by direct observation rather than by models or predictions. I would most certainly be interested in your comments concerning anomalous solar observations which I would expect should start in 2013.
http://www.solen.info/solar/images/comparison_recent_cycles.png
Doubling Sun’s Coronal Magnetic Field in Last 100 years
http://www.nature.com/nature/journal…/399437a0.html
The solar wind is an extended ionized gas of very high electrical conductivity, and therefore drags some magnetic flux out of the Sun to fill the heliosphere with a weak interplanetary magnetic field1,2. Magnetic reconnection—the merging of oppositely directed magnetic fields—between the interplanetary field and the Earth’s magnetic field allows energy from the solar wind to enter the near-Earth environment. The Sun’s properties, such as its luminosity, are related to its magnetic field, although the connections are still not well understood3,4. Moreover, changes in the heliospheric magnetic field have been linked with changes in total cloud cover over the Earth, which may influence global climate5. Here we show that measurements of the near-Earth interplanetary magnetic field reveal that the total magnetic flux leaving the Sun has risen by a factor of 1.4 since 1964: surrogate measurements of the interplanetary magnetic field indicate that the increase since 1901 has been by a factor of 2.3. This increase may be related to chaotic changes in the dynamo that generates the solar magnetic field. We do not yet know quantitatively how such changes will influence the global environment.
http://www.utdallas.edu/physics/pdf/Atmos_060302.pdf
5. The Global Electric Circuit and Electroscavenging
5a. Modulation of Jz in the global circuit.
The global electric circuit was illustrated pictorially in Figure 3.1, and a schematic circuit diagram is given in Figure 5.1. General properties of the circuit have been reviewed by Bering et al. [1998[. Earlier comprehensive reviews have been given by NAS [1986] and Israël [1973]. The polar potential pattern is superimposed on the thunderstorm-generated potentials. In a given high latitude region the overhead ionospheric potential, Vi is the sum of the thunderstorm-generated potential and the superimposed magnetosphere-ionosphere generated potential for that geomagnetic latitude and geomagnetic local time. During magnetic storms the changes in Vi from the mean can be as high as 30% within regions extending up to 30ーof latitude out from the geomagnetic poles [Tinsley et al.1998].
As indicated in Figure 5.1, horizontal potential differences of order 100 kV are generated, high on the dawn side and low on the dusk side, producing corresponding changes in Vi and Jz. The dawn-dusk potential difference has a strong dependency on the product of the solar wind velocity, vsw, and the Bz(GSM) north-south solar wind magnetic field component [Boyle et al., 1997].
http://www.ann-geophys.net/27/2045/2009/angeo-27-2045-2009.pdf
On the long term change in the geomagnetic activity during the 20th century
The analysis of the aa index series presented in this paper clearly shows that during the last century (1900 to 2000) the number of quiet days (Aa<20 nT) drastically diminished from a mean annual value greater than 270 days per year at the end of the nineteenth century to a mean value of 160 quiet days per year one hundred years later. This decrease is mainly due to the decrease of the number of very quiet days (Aa<13 nT). We show that the so-evidenced decrease in the number of quiet days cannot be accounted for by drift in the aa baseline resulting in a systematic underestimation of aa during the first quarter of the century: a 2–
3 nT overestimation in the aa increase during the 20th century would lead to a 20–40% overestimation in the decrease of the number of quiet days during the same period.
The quiet days and very quiet days correspond to periods during which the Earth encounters slow solar wind streams flowing in the heliosheet during the period where the solar magnetic field has a dipolar geometry. Therefore, the observed change in the number of quiet days is the signature of a long term evolution of the solar coronal field topology. It may be interpreted in terms of an increase in the magnitude of the solar dipole, the associated decrease of the heliosheet thickness accounting for the observed decrease in the number of quiet days.
http://www.agu.org/pubs/crossref/2009/2009JA014342.shtml
If the Sun is so quiet, why is the Earth ringing? A comparison of two solar minimum intervals.
The Unique Solution Syndrome: there is one and only one “correct” interpretation to any observation. All others, by definition, must be wrong. As soon as you find “an” answer that suffices, your job is finished.
Geologists know that there are many ways to account for a series of observations that are bound by a common rule in the general sense, but uniquely determined by non-common details in the specific. The barrier island develops by long-shore deposition of sands originating from an upstream river source in general, but it develops HERE, for THIS LENGTH and FOR THIS LONG and with THIS SHAPE because the shelf-shore has a certain pattern, and the winter winds comes from a certain direction for a certain length of time, etc. etc. We create an answer as best we can as to exactly how it works, because the Corps of Engineers and others need to understand what to expect in the future, but what we really do is create an answer that is internally consistent with the facts and theories we have.
We know there are other, similarly sufficient answers: that is why each generation of geologists does not put out of work the following generation of geologists. Our answers often are like the suit that is said to fit where it touches: good-looking and useful from the angle we are looking from today, but not so much from where we are, tomorrow.
Geology is most correct in the general sense, less correct in its details. The geologist knows this even though he is paid to make a specific statement today. Climate science, in contrast, is held as a science with a unique solution to any situation, more of an engineering study.
The details are what determine the characteristics of the outcome in geology. If you don`t have the details right you don`t have a mine or an oil field where you dig. It looks the same with climatology, but you`d never know that from the Global Warming fiasco.
The really weird thing about climatology as practiced by the IPCC is that the science is said to be settled, so what happens is really an engineering project to determine, but the range of outcomes by 2100 has not reduced in the last 24 years of study. If you were to use even a probability function and then compare it to observation, you would feel it necessary to change the probability distribution after 24 years. Even if the change was to admit you didn`t KNOW what the probability distribution should be.
Seems Dana’s never head of latent heat, has he?
Sorry, never heard…
One of my favourite stories from popular science history is about an incident that took place during World War 2. At some point in ’42 or 43, the British, who’s pioneering use of radar had saved them from the Luftwaffe in 1940 got an awful scare when one morning their screens showed nothing but fuzz. For the first time since the outbreak of war they were effectively blinded. Certain that the Germans had invented a jamming device they immediately got their finest boffins on the job an alerted their coastal defences to expect a massive air attack.
It was mid morning before an astute technician noticed that the source of interference was steadily climbing into the sky…by lunchtime, to their immense relief, they realised that its source was The Sun!
This was one of the first times in history that the sun’s output had been detected by radio sensitive equipment.
So you can understand now why it is that I see a chart recording Cosmic Ray Activity starting in 1880!!!! I just feel like laughing
By putting the Gleisberg solar cycle into a chart, as I have done, (and others can follow and copy??),
http://blogs.24.com/henryp/2012/10/02/best-sine-wave-fit-for-the-drop-in-global-maximum-temperatures/
I think it is possible for me to estimate that all observed warming is natural or very nearly completely natural. Please correct me if you think I am wrong.
Consider the fact that we really do not have a global temp. record to speak of since at least around 1925. In those days they just manufactured thermometers, never realizing that after time they need to be re-calibrated…..I have challenged anyone to bring me the calibration certificates of thermometers used in weather stations from before that time, with no response.
This means that if we look at my global sine wave chart above for energy in
(not to be confused with energy-out)
we must rather look at the absolute value of the increase in the heat coming through the top of the atmosphere from 1927 (85 years ago) until 1950. This means an increase of ca. 0.037/2 (roughly integrated) x 23 = 0.43 degrees K.
In the next period from 1950 to 1995, when records were firmly established we are seeing the warming that everyone started to fear, namely 0.037/2 (roughly integrated) x 45 = 0.83 degrees K. From 1995 until 2012 it looks we went down on the maxima by ca. 0.037/2 x 17 = 0.31
So I have 0.43 + 0.83 – 0.31= 0.95 degrees K up on the maxima since 1927
I have had a look now at CET maxima and found it rising by 0.0105 degree K per annum from 1927 – 2012. A total of 0.89 K from 1927 which again confirms the correctness of my global estimate.
I also had a look now at the increase of CET means and found it increasing by 0.0088 degree C per annum since 1927. This means the ratio of maxima/means is therefore estimated as 1.19.
This leaves me with an estimate of 0.95/1.19 = 0.8 up on the means which even is 0.1 K higher than the actual observed increase, as here,
http://www.woodfortrees.org/plot/hadcrut4gl/from:1927/to:2013/plot/hadcrut4gl/from:1927/to:2013/trend/plot/hadcrut3vgl/from:1927/to:2013/plot/hadcrut3vgl/from:1927/to:2013/trend/plot/rss/from:1927/to:2013/plot/rss/from:1927/to:2013/trend/plot/gistemp/from:1927/to:2013/plot/gistemp/from:1927/to:2013/trend/plot/hadsst2gl/from:1927/to:2013/plot/hadsst2gl/from:1927/to:2013/trend
I think an error of +0.1 is not that bad, for a rough estimate, so all of this leaves me with no warming caused by human beings, as I had suspected, from the very beginning,
http://blogs.24.com/henryp/2011/08/11/the-greenhouse-effect-and-the-principle-of-re-radiation-11-aug-2011/
Let’s look at what Dana is saying from another angle:
Case 1: CO2 level stays steady for the next 30 years at 400 ppmv. According to Dana, temps will not change.
Case 2: CO2 levels drop by 2 ppmv/yr for the next 15 years (from 400 to 370). According to Dana, temps will drop.
Anyone willing to bet Dana will agree with the above two cases?
Climate’s Natural Variability appear to be a direct consequence of the interaction between the Solar magnetic cycles and the geomagnetic input; results of my finding are briefly summarised her:
http://www.vukcevic.talktalk.net/NV.htm
Dr. Svalgaard in the past has vehemently denied any scientific validity to the above finding, and I assume he will do so in the foreseeable future.
It is pointless going over the same ground again, the most recent exchange can be found on the Haigh-Anxiety
William says:
December 28, 2012 at 11:19 pm
It is natural for there to be disagreement among specialists. It is very common for one side to believe it is impossible for the other side to be correct.
The papers you refer to are already out-of-date. This is a rapidly developing area of research. Both the sunspot number and the Ak-index [extension of the Aa-index] are subject to updates and revision. I am leader of a team of specialists examining the evidence http://www.leif.org/research/Svalgaard_ISSI_Proposal_Base.pdf
Charles Gerard Nelson says:
December 28, 2012 at 11:43 pm
So you can understand now why it is that I see a chart recording Cosmic Ray Activity starting in 1880!!!! I just feel like laughing
You shouldn’t. Cosmic Ray Activity create radioactive isotopes (Carbon 14 and Beryllium 10] which can be found in tree rings and ice cores. The data goes back more than 10,000 years.
Here is how it is done: http://www.leif.org/EOS/Beer-GCRs.pdf
Leif claims (his usual line):
“since solar activity has not had any long-term trend the past 300 years, then Earth’s climate would not have either.”
Yet there is a wealth of research that does show a link. For example:
De Jager, C. and Duhau, S. The variable solar dynamo and the forecast of solar activity;
effects on terrestrial surface temperature; in J. M. Cossia (ed), Proceedings of the global
warming in the 21th century. NOVA science publishers, Hauppauge, NY, 2010; 77.
They concluded: “We studied the relation between average terrestrial surface temperature and solar variability for the period 1610 – 1970. During this period the average terrestrial surface temperatures are correlated both with the equatorial as well as the polar solar magnetic field components. The correlation with the equatorial field can fully be explained. It is due to the gradual increase of the Total Solar irradiance and the consequent feedback by evaporated gases. The explanation of the polar correlation is still open.”
Joanne Haigh has just been made a CBE for ‘Services to physics’. What!
@Phillip Bratby
You beat me to it! I was about to report that here also.
vukcevic says:
December 29, 2012 at 1:06 am
Climate’s Natural Variability appear to be a direct consequence of the interaction between the Solar magnetic cycles and the geomagnetic input […]
Dr. Svalgaard in the past has vehemently denied any scientific validity to the above finding, and I assume he will do so in the foreseeable future.
You bet, and much longer than the ‘foreseeable future’.
Chris Schoneveld says:
December 29, 2012 at 1:30 am
“since solar activity has not had any long-term trend the past 300 years, then Earth’s climate would not have either.”
Yet there is a wealth of research that does show a link.
Which are based on obsolete datasets of solar activity. Before you make such conclusions, it might be a good idea to examine the evidence: http://www.leif.org/research/Solar-Petaluma–How%20Well%20Do%20We%20Know%20the%20SSN.pdf