
Guest post by Alec Rawls
When he argues that a reduction in forcing will cause cooling Dana Nuccitelli is not actually talking about drinking. He is talking about the solar forcing of global temperature, but the drinking analogy is a handy way to understand where his argument goes off the rails.
Mr. Nuccitelli, who blogs for the consensus-approved Skeptical Science website, was writing about Henrik Svensmark’s GCR-cloud theory of indirect solar forcing, where Galactic Cosmic Rays are hypothesized to seed cloud formation. If Svensmark is right then a strong solar wind, by deflecting some GCR from reaching the earth, in-effect blows some of the clouds away, letting more sunlight through to warm the planet’s surface.
That can’t possibly explain late 20th century warming says Nuccitelli, because GCR deflection has been estimated (see the Krivova-Solanki graph above) to have peaked by 1980. The raw data suggests the actual GCR minimum was ten years later, but set that aside. Nuccitelli thinks it is the change in the level of forcing, not the level of forcing, that determines whether the climate system warms or cools:
So, if GCRs really do amplify the solar influence on global temperatures, since 1980 they are amplifying a cooling effect.
Cooling begins when a forcing passes its peak? Fail. Daily temperatures don’t start falling at noon. They continue rising until mid-afternoon. The hottest time of the year isn’t the first day of summer (the summer solstice, after which the days start getting shorter), the hottest time is mid-summer. To think cooling should start when forcing passes its peak is like thinking you can sober up by drinking just a little more slowly.
Here’s a tip for Dana to keep in mind on New Year’s eve: it is the level of alcohol forcing that matters. If you are drinking alcohol faster than you body is excreting it (not exactly the way the earth excretes heat, but similar enough), then your blood alcohol is rising. You are getting drunker, even if you have lowered the rate of your drinking! That’s right, putting a little less rum in your egg nog will not sober you up! Your increasing inebriation will just be a little less rapid, and it is the same for solar forcing.
When the peak level of forcing appears in the rearview mirror, the downward trend in the forcing that begins at that point does not cause cooling. It just causes warming to be a little less rapid. Only when the energy pouring into the climate system falls to the level of the energy escaping back out does the system stop warming. Empirically, that turns out to be mid-afternoon, mid-summer, and approximately the first decade of the 21st century.
Three blind mice
Dana Nuccitelli produced one of three widely cited rebuttals to my suggestion that a new sentence that was added to the Second Order Draft of AR5, a sentence that admits strong evidence for some substantial mechanism of solar amplification, is a “game changer.” That admission is on page 7-43 of the SOD:
Many empirical relationships have been reported between GCR or cosmogenic isotope archives and some aspects of the climate system … The forcing from changes in total solar irradiance alone does not seem to account for these observations, implying the existence of an amplifying mechanism such as the hypothesized GCR-cloud link.
That’s a game changer because the only solar forcing included in the IPCC computer models is the very slight variance in solar irradiance (also known as TSI, or “the solar constant”). If there are other solar forcings in play, working through variables that actually vary substantially as solar activity ramps up and down, that kills the report’s key finding (on page 8-4) that we can have “very high confidence that natural forcing is a small fraction of the anthropogenic forcing.”
The two most widely cited rebuttals, which I answered last week, were both by lead authors from the IPCC. Steven Sherwood, one of 15 lead authors of chapter 7, pretended that the admission of evidence for “an amplifying mechanism” was only about GCR-cloud. He then proceeded to claim that the evidence for GCR-cloud points to a weak mechanism, and used that as a grounds for dismissing the idea that any substantial solar forcing beyond TSI could be at work.
Doesn’t follow. The evidence for “an amplifying mechanism” (emphasis added) is entirely separate from the evidence for the GCR-cloud mechanism. The former is paleo evidence, where numerous studies of the geologic record have found strong correlations between solar activity and climate going back many thousands of years. The evidence for the GCR-cloud mechanism is from cloud-chamber experiments and ongoing observations of cloud micro-physics.
It doesn’t matter how unconvinced Sherwood is by the evidence for the GCR-cloud mechanism. That evidence does nothing to counter the paleo evidence, cited in the draft report, that some mechanism of enhanced solar forcing must be at work. By using his discontent with the GCR-cloud theory as an excuse to dismiss the paleo evidence, Sherwood is inverting the scientific method, and he is lying to the public about what the report says, making him a seriously bad guy.
Apparently weak minds think alike because Nuccitelli did the same thing Sherwood did, only a day earlier. Dana’s post only looks at the GCR-cloud mechanism and completely ignores the draft report’s admission of strong evidence for some mechanism of solar amplification. It is in the context of that more fundamental mistake that Nuccitelli goes on to completely misinterpret the evidence for the GCR-cloud mechanism itself, claiming that anything less than peak forcing causes cooling, arguing in-effect that he can sober up by drinking a little slower. Just tell that to the officer Dana. He won’t even need to give you a breathalyzer.
More evidence that weak minds think alike is the second semi-official rebuttal to my “game change” claim, issued by Joanna Haigh, a lead author of the IPCC’s third report. Haigh proceeds on the same dishonest pretence as Sherwood, telling NewScientist magazine that the new sentence in the draft report is only about GCR-cloud, which she then dismisses with the same drinking-game mistake that Dana makes, claiming that if climate were being driven by solar activity then the planet would have started cooling when solar activity was at its peak:
Haigh points out that the sun actually began dimming slightly in the mid-1980s, if we take an average over its 11-year cycle, so fewer GCRs should have been deflected from Earth and more Earth-cooling clouds should have formed. “If there were some way cosmic rays could be causing global climate change, it should have started getting colder after 1985.”
Sober up Joanna. Have a single shot instead of a double. Works every time.
Which theory has more trouble with flat 21st century temperatures?
It is amusing how Dana Nuccitelli, through sheer incompetence, was able to prefigure the highly credentialed malfeasance of both of these IPCC fraudsters. Still, Nuccitelli has to be credited with at least a bit of misfeasance of his own because he wasn’t satisfied with just assuring his gullible readers that cooling commences when forcing is at its peak. That only supplied an excuse for dismissing a solar explanation for late 20th century warming, leaving the conspicuous lack of 21st century warming still to be dealt with. Dana’s solution? Pretend that the flat 21st century temperature record militates against a solar driver of climate:
In fact, GCRs reaching Earth recently hit record high levels (Figure 4), yet temperatures are still way up.
Temperatures have merely flattened out, they haven’t gone down yet, and no Skeptical Science reader will ever learn that this is just what the discovered correlations between solar activity and climate predict. The strongest temperature response to a change in solar forcing is seen with a lag of about ten years (Usoskin et al. 2005), or one solar cycle (Solheim et al. 2012). The theory that is discomfited by flat 21st century temperatures is the CO2-warming theory, which predicts ever more rapidly increasing temperatures.
Dana might actually think that the flat 21st century temperature record causes trouble for the solar-warming theory but there is no way he can think it causes less trouble for the CO2-warming theory. For him to pretend that 21st century temperatures favor the CO2-warming theory is inexcusably dishonest, but as usual, the professionals are even worse. Note this little gem from the SOD (p. 7-44):
The lack of trend in the cosmic ray intensity over the last 50 years (Agee et al., 2012; McCracken and Beer, 2007) provides another strong argument against the hypothesis of a major contribution of cosmic rays to ongoing climate change.
That’s 15 IPCC lead authors all accepting the crackpot idea that you can only get drunk if your rate of drinking is going up. Steady exposure to the high 1950’s level of solar activity will keep you from warming, just as steady swilling of a high level of booze will keep you stone-cold sober. But where Dana only said that “temperatures are still way up” (implicitly acknowledging that they are no longer going up), the draft report here claims that temperatures are still going up (“ongoing climate change”).
Must be a Steven Sherwood sentence. He needs to look at page 10-3 of the SOD (emphasis added):
While the trend in global mean temperature since 1998 is not significantly different from zero, it is also consistent with natural variability superposed on the long-term anthropogenic warming trends projected by climate models.
Note that the “consistent with natural variability” part is a near call, after NOAA admitted in 2008 that 15 years of no warming would falsify current models. But yeah, let’s pretend it is the solar theory that has trouble with the lack of recent warming.
The Guardian, Andrew Sullivan, DeSmog, Romm etcetera, all pwned by Dana Nuccitelli’s error-filled AR5 post
The ensuing Skeptical Science newsletter bragged about how many eco-propagandists picked up on nutty Nuccitelli’s non-stop nonsense and the list is indeed impressive, a glaring testament to the total absence of due diligence on the part of these “journalists,” none of whom thought to question Dana’s advice on how to sober up quick. Here is the SkS tally of eco-scalps:
This was a very big week for SkS in the news. Dana’s IPCC Draft Report Leaked, Shows Global Warming is NOT Due to the Sun was re-posted and/or linked to by The Guardian, New York Times Green, New York Times Dot Earth, Huffington Post, Climate Progress, Mother Jones, Climate Crocks, Carbon Brief, Grist, Daily Beast, DeSmogBlog, Graham Readfearn, Der Spiegel, Maribo, Learn from Nature, Alternative Energy in the 21st Century, and Motherboard. It was also Tweeted by Michael Mann and Chris Mooney, among many others.
The only “consensus” journalist on this list who showed any integrity was Andrew Revkin, who had already written a post on my leak of the draft report. After updating that post with a link to Nuccitelli, Revkin updated again later with a link to the rebuttal that Jo Nova and I wrote about Seven Sherwood. Thanks Andrew, for being an actual journalist.
To put their “big week” in perspective the folks at Credulous Science reached high for sufficient words:
Winston Churchill once said: “A lie gets halfway around the world before the truth has a chance to get its pants on.” Not this time; we got the truth’s pants on in record time and nipped this myth in the bud before the contrarians were able to misinform the public.
The “truth” in their rendering is whatever patent falsehoods can be used to fool the ignorant into thinking they should fear CO2. No, nutty ones. You did not forge an exception to Churchill’s dictum. You provided a textbook example of it.
Dana is a poster child for those who feel a moral imperative to “believe the scientists”
For the last two years I have had a lot of fun exposing the large number of top climate scientists who claim that it is not the level of forcing that causes warming, but the trend in the forcing. They are all looking at the wrong derivative (one instead of zero).
Given the enormous pressure on the eco-left to accept what these government-funded climatologists are saying it is not surprising that someone like Dana Nuccitelli would swallow the idea that temperature really is driven by the trend in the forcing, and one super-wacky segment in Dana’s post indicates that he really is accepting that this is how physics works. If you leave a pot of water on a steady flame it won’t heat. If you want to heat the water you have to keep turning the flame up. The segment is titled, “Physical Reality Intrudes on Rawls”:
Rawls has argued to the contrary by claiming that the climate is still responding to the increase in solar activity from the early 20th century, and that GCRs are amplifying that solar warming from over 60 years ago. This argument is simply physically wrong. As Figure 2 illustrates, when solar activity rises, temperatures follow suit very soon thereafter. In fact, during the mid-20th century, solar activity and global surface temperatures both flattened out. Are we to believe that the planet suddenly began responding to the pre-1950 solar activity increase in 1975—2012, after not warming 1940—1975? The argument makes no physical sense.
Obviously I never said that late 20th century warming was caused by solar activity from the early 20th century and Dana does not give a citation for what argument of mine he is referring to but its easy to figure out. I have argued many times that if one combines the strong paleo correlations between solar activity and climate with the fact that solar activity was at what Ilya Usoskin calls “grand maximum” levels from 1920 to 2000 then it is certainly plausible that much of 20th century warming, including late 20th century warming, could have been caused by the sun. 80 years of a high level of enhanced solar forcing just might warm the place up a bit (and it only did warm a bit, about 0.8 °C over the century).
If I am attributing late 20th century warming to the high solar activity that persisted through 2000, why does Dana think I am attributing it to solar forcings from 60 years earlier? He must be fixed on the idea that only a change in the level of solar forcing can cause warming. That’s what all of these top scientists have been telling everyone and there was no rise in solar activity after 1950, hence any solar-caused warming would have to stem from the pre-1950 rise in solar activity.
But come on Dana. That is not what I am saying. That is what they are saying, and I have been trying my darnedest to expose it as a blatant misrepresentation. I’m not attributing late 20th century warming to the pre-1950 rise in solar activity. I’m attributing it to the fact that solar activity remained at close to the same high 1950’s level until 2000 (or 2003). It is the level of the forcing that causes warming, not the trend in the forcing.
I have to feel bad for Dana on this point. It isn’t his fault. He has been systematically duped by this parade of so-called scientists all telling him that a persistent high level of forcing can’t cause continued warming. Makes me want to put him on a milk carton. The poor guy isn’t just lost, he was kidnapped. Want a piece of candy little boy? Credulous Science indeed.
Other_Andy,
Different organizations use different baselines. Some use zero, or tenths of a degree, both indicating an anomaly chart, and some use a specific temperature line, such as 14ºC. The point is that if you are showing a trend, you should use a trend line chart. That eliminates the [alarming, but non-existent] hockey stick shape.
Here [note the long term, declining green trend line], and here, and here [0.35ºC rise per century, with no acceleration] are examples of trend line charts. You can see that the long term global warming trend remains unchanged since the end of the LIA. There is no recent acceleration of global warming, despite the fact that CO2 has risen ≈40%. In fact, global warming has stalled for the time being; maybe temporarily, maybe permanently. But despite rising CO2, global warming has stopped.
You ask why there are no explanations with many of the charts. I believe the reason is that it is intended to show a scary rise in temperature — a hockey stick — rather than to inform. All U.S. government agencies [NOAA, GISS, USHCN, etc.] use zero baseline charts when showing the long term natural global warming trend. They know exactly what they are doing, and why. Their budgets would be impacted if they told the truth: that there is no measurable, testable scientific evidence proving that human CO2 emissions cause global warming. So they bury the truth with fictitious charts that show rapid, but non-existent, global warming.
Before you start talking about temperature try to get a temperature chart that shows what actually happens to it. An 11-year averaged temperature chart is worthless because it hides important aspects of the real temperature curve. The El Ninos and La Ninas are homogenized when they are actual parts of the temperature curve and not something to be hidden. The entire instrumental temperature curve is a concatenation of alternating El Nino peaks and La Nina valleys, interrupted from time to time by oceanic irregularities, such as the super El Nino of 1998 and the twenty-first century high, or by rapid starts of warming and cooling as happened in the early twentieth century. These are breakpoints where physical changes occurred and they must not
be eliminated by computer processing. The worst part of that NASA curve is that it totally erases the true temperature of the satellite era. I don’t feel like explaining it all but from 1979 to 1997 the global mean temperature was constant. There were five El Nino peaks in that interval, and the middle one, the 1988 El Nino, is the one that Hansen called global warming peak in 1988. Six months later a La Nina dropped global temperature by 0.4 degrees Celsius. What he is now doing is showing that entire period as a smooth temperature rise called “late twentieth century warming.” it is a complete fake. Read my book and find out more.
Why wouldn’t continued input of solar energy at the same level be capable of raising temperatures on Earth ?
The only way a steady input of solar radiation is NOT capable of raising temperatures on Earth is if the Earth is at it’s blackbody maximum temperature for the insolation – just like letting the water heat on the gas till it boils without continually increasing the gas.
Of course, Dana Nuccitelli and his fellow nut jobs think this is waht they calculate when they falsely believe it is OK to hypothesise the Earth is flat with the Sun shining 24 hours a day at one quarter power – a simple hypothesis easily demonstrated as wrong by observing the Moon.
The minus 18 degrees C Earth radiating temperature is completely different to the heating under the noonday sun on a clear day at almost all latitudes on Earth from 75 N to 75 S.
The real blackbody temperature the solar radiation is capable of causing is never achieved on Earth because of water evaporating and the atmosphere convecting.
These simpletons continue to cling to their mistaken belief they have not made a simple fundamental error.
What is really funny though is one of SKS’s explanations about backradiation – they now claim it is the Sun that heats the Earth when trying to defend “backradiation” – of course conveniently forgetting that in all their other arguments they claim the Sun can’t be responsible.
What a joke SKS is, what a joke academia is becoming !
Elftone writes about Dana Nuccitelli’s argument:
Agreed. Anyone who thinks that it is the trend rather than the level of the temperature forcing that causes warming must be assuming, at least implicitly, that the system has already equilibrated to the forcing. But the idea that our planet’s climate system, with its vast ocean heat sinks, equilibrates rapidly to changes in forcing is highly implausible and certainly requires at least an attempt at a justification. Neither Dana nor any of the “consensus” scientists who make these implicit assumptions provide any scientific support for their radical assumptions. The only time they offer any justification at all is when I press them on it. Near the end of my post on Isaac Held’s 2-box model of ocean equilibration I provided a short summary of the variety of off-the-cuff attempts to justify a rapid equilibrium assumptions that I have been offered. None of them stand up to the least bit of scrutiny.
GCR are un correlated with cloud cover. Any one of you can go get hourly data from CRN stations, and GCR data and see that for yourselves. No need to use a temperature record you dont trust, use CRN which Anthony endorses. No correlation. Zip, nada. And the argument about lags in temp is utterly beside the point. Just look for a correlation between GCR and cloud cover.
easy peasy. You wont find one.
@ur momisugly Gary Pearse
I think you meant to say they should raise historical global avg temp back to 15c from current 14c they started using sometime in late 1998. I believe current “accepted” avg temp is something like 14.63c. Nice trick lower the avg temp and get global warming. But no they say it’s the trend that’s important. With a little more warming we’ll be back to normal.
Steven:
I agree 100%….don’t think it is there. That does NOT preclude another forcing that is not recognized.
WE know that the temperature has varied…..we have to figure out why. We sure as heck don’t know now.
The whole premise of what the models are based on needs to be examined.
“Near-zero and even negative trends are common for intervals of a decade or less in the simulations, due to the model’s internal climate variability. The simulations rule out (at the 95% level) zero trends for intervals of 15 yr or more, suggesting that an observed absence of warming of this duration is needed to create a discrepancy with the expected present-day warming rate.”
http://www1.ncdc.noaa.gov/pub/data/cmb/bams-sotc/climate-assessment-2008-lo-rez.pdf
“
Katio1505 says:
December 28, 2012 at 5:34 pm
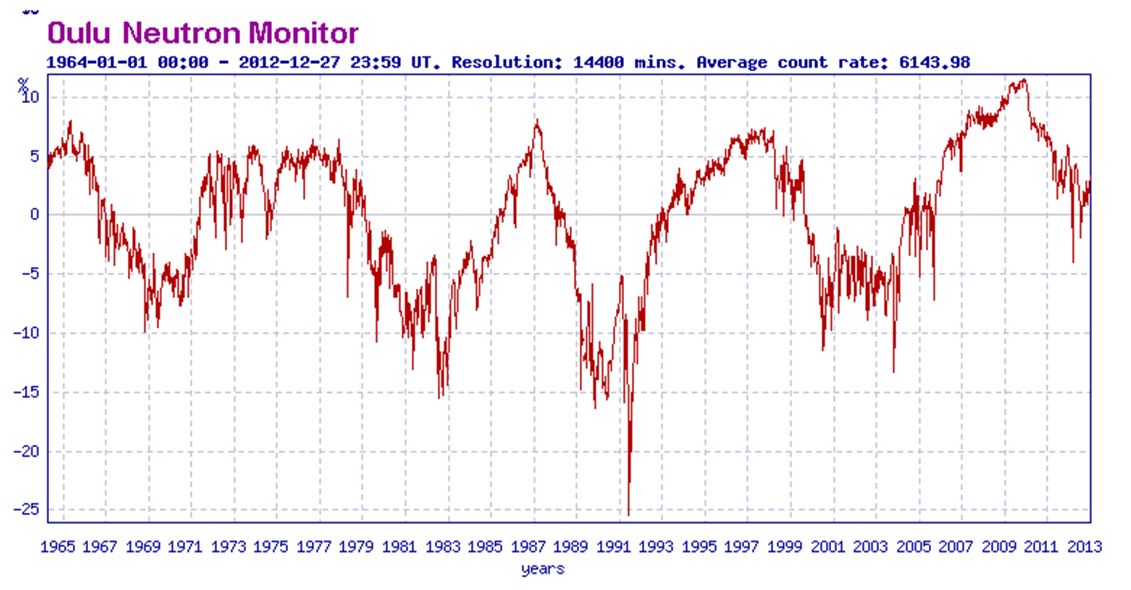
Svensmark proposes that it is only the high energy cosmic rays that cause the cloud seeding. What energy range is used in the graph derived from Krivova and Solanki in the above figure?
The neutron monitor data [and the 10Be production] is mostly around 2 GeV. The GCRs that Svensmark talk about are more energetic than 10 GeV [which are only very weakly modulated by solar activity]. Some stations [e.g. Oulu] show an increase in low and medium energy GCRs which are not effective [most stations do not]. In addition, some stations [e.g. Oulu] have changed their geomagnetic latitude in such a way as to record more GCRs [Oulu is just near the edge of the polar region where the geomagnetic cutoff ends]. In any event all these changes are tiny.
As Mosher says above, the (non-existent) cloud cover datasets don’t match the CGR data.
On the other hand, it would be nice if we has an actual cloud cover dataset. There is only fake climate model data and Hansen’s ISCCP data which noone believes.
Steve Mosher, GCR are very well correlated with ocean temps over geologic time. something like a 5C (memory failing me) range of equatorial ocean temps from min to max by Jan Veizer’s oxygen isotope proxies. And then there’s the Svensmark paper finding a nice swing of 7% of the amount of water in low level clouds over the oceans in the wake of strong Forbush decreases, just six days after the event.
There is an undeniable link.
What follows is complicated. My apologies for that but spin is only as complicated in its unraveling as it was in its raveling.
I followed the whole AR5 WG2 leak and backlash story quite closely. There was so much spin in Dana’s SkS post and in the comments there that I was stunned into inaction- I didn’t know where to start tackling this avalanche of absurdities. Some issues like the graphs have been raised here. I do regret not doing anything until now because there was one glaring problem with Dana’s reading of Rawls, or rather his lack of rigor in doing Rawls the courtesy of reading through all the evidence he was presenting. I haven’t seen this point made anywhere in the blogs or the media:
The evidence presented to support Rawls’ concerns about AR5 chapter 7 came from the original WUWT post announcing the leak. And not just the post itself but, crucially, the links embedded therein. I read that original post and considered it a responsibility to myself, without a readership of millions, to click the links in turn, getting the fullest picture possible of what Alec was saying. The most pertinent link in that post was highlighted “omitted variable fraud”. By not reading this link (or choosing not to cite the killer argument in it) Dana set in train a media frenzy that compounded one misunderstanding after another. His take was in turn pounced upon by one of the chapter 7 authors, Sherwood, as a way out of a tight fix. Sherwood surely must have suspected that Alec Rawls was saying more than Dana was letting on. Either that or Sherwood had actually read the cogent arguments of Rawls’ “omitted variable fraud” link and declined to disabuse all those reporters of their simplistic take on the issue.
This traduced Rawls’ real concerns behind the newly added sentence in AR5: the sentence was only the last straw, the admission that there must be some mechanism over and above the TSI affecting solar forcing. But if we look at this admission in the light of the undressing that Rawls gives the chapter 7 authors in the crucial link, (see capitalised heading below for details) we are in fact marrying that admission to their bald acknowledgments that there are papers pointing to the existence of a strong GCR/Climate correlation. Papers that are good enough to be cited in AR5 by apparently widely respected climatologists are good enough to be presented with the full import of all salient information they contain including an acknowledgment of the quality of the strong correlations they discovered. This was not done. Instead they cast over the GCR/cloud mechanism setting it up as the straw man to discredit these papers further and, because this was a wholly tangential argument, the credibilty of the three papers remains fully intact. This is why the admission in the newly added sentence (in AR5 WG2) is such a game-changer: it is an admission of a strong, yes strong, correlation between GCR and climate, the exact mechanism of which has not yet been established.
Any of the arguments we heard from Sherwood or Dana accusing Rawls of not reading to the end of the paragraph 4.3 which clearly states that they believe the additional solar forcing is insignificant, has to be viewed in the light of the above. Of course, they can reiterate it as much as they like, but it will only be believed if Sherwood can base it on a sound basis of evidence-based argument. Right now it is not, but what remains is his admission of the “existence of an amplifying mechanism” along with three papers cited by him (also an admission by their inclusion) showing a significant correlation between this amplification he admits to, and climate change. That is why Alec Rawls point is intellectually sound: two assertions, in fact two admissions by the chapter 7 authors that dovetail perfectly were crudely de-coupled by a straw man. When the straw man is banished, the two dovetailed admissions remain and they come from the pen of Sherwood and co.
It’s true that some of these points were bandied about over the course of the controversy but nowhere was it laid out as clearly and fully, all in one place, as in the “omitted variable fraud” link.
THE OMITTED VARIABLE FRAUD LINK IN MORE DETAIL
The “omitted variable fraud” link took me to a previous WUWT post by Rawls from February 2012. This post shadowed all the issues in the December leak post apart from one thing- he was referring to the Working Group 1 (WG1) draft copy whereas the December post was referring to the WG2 draft. The only difference between the two was the addition of the much-cited sentence that referred to data “implying the existence of an amplifying mechanism” in the later draft. In his February post, Rawls already appeared to be on the brink of leaking even the WG1 judging by his rightful indignation at the contents. But he wasn’t complaining about the new sentence because it wasn’t there yet. He was concerned that the authors of Chapter 7 were cleverly setting a gameplay whereby they acknowledged the existence of three papers showing “many empirical relationships” between GCR and climate and then, by sleight of hand, trashing them with a spurious tangential argument about the inconclusive results on GCR cloud seeding. This tangential argument was a straw man, set up to shoot down the validity of the three papers despite 1) the fact that they were primarily presenting “empirical relationships”, not hard-and-fast mechanisms 2) by extension they were not concerned with GCR alone 3) the fact that, despite showing only correlations, those correlations were very strong. Crucially, Rawls included quotes from the three papers showing the strength of the correlations. (He also described why this was “omitted variable fraud”- if you eliminate one culprit of GW you can attribute all the warming to your pet culprit, AGW. GCR was an omitted variable and omitted fraudulently).
Although Rawls touches on the three papers in his December post, he does not go into the detail of the February post on this one narrow topic. It is only by reading the February post (by following the “variable fraud” link) that the true subtlety of the AR5 chapter 7 authors’ sleight of hand is revealed. (I tried to capture it in essence above but it doesn’t do it any justice) In fact, as you continue reading the December post after reading the February post it is clear that Rawls is assuming you are up to speed on the issues regarding the February post. You can see him glossing, just a little, over this crucial aspect- and understandably because it isn’t glossing if his readers are up to speed with the facts that he directed them to only just a minute ago.
In conclusion, if Dana and, by extension, a bevy of international media outlets cannot be bothered to read through all the evidence presented to support somebody’s actions and arguments, they should publish precisely nothing. Either that, or publish the bare facts that a leak has been made and by who, along with a link to that person’s full explanation.
Scute
Philip Bradley
December 28, 2012 at 5:11 pm
###
Typical leftie conflation of unrelated things.
You did it twice. You conflated drinking of watered wine or beer at dinner with social drinking. Then you conflated a continuing raise in BAC with alcoholic stupor. Those Europeans (and Americans, the colonists were beer drinkers also) drinking throughout the day were getting drunker as they drank, just not very fast. Another point is that the lack of display of the typical signs of drunkenness is not a good indication that a person is not drunk. When I was still an alcoholic, I could ( and had) passed a police roadside sobriety check while being quite toasted. Some people have a very high tolerance to alcohol.
It takes a bit over an hour to eliminate the alcohol from one glass of beer, once it is in the system. It takes about a half hour for alcohol to get into the system. This is under optimum conditions. So my contention still stands, that a person drinking socially, even moderately will be getting drunker as the night wears on. Note that the initial point was in the context of social drinking.
Thank you again for your insight and your willingness to spend any time at SS and to respond as you have to certain critics of your thinking.
Tonight, for the first time, I visited SS. I was appalled. I expected a Public Relations Spin site and instead I found a Propaganda Machine (aptly named SS) specifically designed to find the best misleading alarmist argument possible to refute any logic employed anyone holding a challenging viewpoint about the models and their results. Talk about turning science on its head.
This site in its entirety seems focused on crushing and humiliating anyone with a challenge to their “science”. Science is based on skepticism. This site impales that and attempts to turn “Science” around to crush contrary thinking about a predetermined outcome.
What nerve these folk have to refer to themselves as “Scientists”.
Policy Guy,
Now you can see why Anthony puts SkS in it’s own “Unreliable” category. I would have been less charitable, categorizing them as “Deceptive Propagandists”.
Try posting some verifiable scientific facts there. Be as reasonable and polite as possible. But if your comment questions their catastrophic AGW narrative, it will never see the light of day.
It is a given that any blog that deletes wholesale all scientific views contrary to it’s narrative is being dishonest. SkS constantly deletes — or worse, mendaciously changes the meaning of — skeptics’ comments. SkS is run by pathological liars, and I include Nuccitelli along with Cook. The truth is not in them.
While skimming down through the comments, speed-reading to get a gist of what the many views were covering, (which is, in terms of scope, wonderful and amazing,) I skimmed through one comment and thought to myself, “that sounds like Leif Svalgaard.” So I put on the brakes and checked back to see the name, and sure enough it was he.
Leif, for a man who is excellent, when it comes to the narrow range of your expertise, you seem unaware of worlds outside your canyon.
The majority of the 20th century warming has caused by solar modulation of planetary cloud cover. Note however that there is three rather than one mechanism by which solar magnetic cycle changes modulate planetary cloud cover. I am currently investigating the physics and cosmological implications of the third mechanism and have found an extensive set of astronomical papers to support its existence and to define the mechanism.
if and when there is unexplained planetary cooling, I will have an in depth explanation of the third mechanism and can explain in detail what to expect next. There is a fourth mechanism.
The solar magnetic cycle affects cloud cover by three mechanisms 1) Changes to the solar heliosphere changes the number of Galactic Cosmic Rays (GCR) and the energy content of the GCR that strike the earth’s atmosphere and 2) Electroscavenging where solar wind bursts remove cloud forming ions. The following is a summary. See this paper by Brian Tinsley and Fangqun Yu “Atmospheric Ionization and Clouds as Links Between Solar Activity and Climate” for details, 3) abrupt changes to solar magnetic cycle which creates an imbalance of charge, the earth and other planets in the solar cycle attempt to reach equilibrium with the sun which results in an increase in volcanic activity and atmospheric activity (see massive new atmospheric spot, Saturn for example). (The third process also removes cloud forming ions from the atmosphere.)
(See Tinsley and Yu’s review paper for a review of the first two mechanisms.)
http://www.utdallas.edu/physics/pdf/Atmos_060302.pdf
General
The net effect of planetary clouds (all levels) is a reflection into space of 27.7 W/m2 (i.e. Clouds cool the planet by 27.7 W/m2.) [Hartmann, 1993] A mechanism that increases or decreases the total amount of planetary cloud cover will change the planet’s temperature.
Cloud Modulation by GCR
Microscope cloud nuclei are created by the electrons that are produced when the GCR strike the upper atmosphere. (GCR create muons. The muons reach lower levels in the atmosphere and create free electrons.) Svensmark has confirmed the processes in a lab test. Two additional tests are planned. One in a deep under ground mine, to test the process in the absence of natural muons and the second with CERN, where CERN will be used to create a known modulated artificial GCR source.
GCR Modulation by Solar Heliosphere
Pieces of magnetic flux from the sun are carried out into the solar heliosphere. The solar heliosphere stretches out about 20 light hours (near the orbit of Uranus.) The pieces of magnetic flux deflect GCR so that deflected GCR does not strike the earth. As the solar cycle progresses there is an observed change in the amount of Galactic Cosmic Ray (GCR) particles that strike the earth. Tracking the change in the number of GCR is a change in total planetary cloud cover. This is shown by satellite data in Palle’s paper and also in Tinsley and Yu’s paper (figure 2.1.).
Electroscavenging
High speed solar winds that are created by coronal holes (for example) remove cloud forming ions by the process of electroscavenging. The high speed solar wind creates a space charge in the earth’s ionosphere. The charge differential in the ionosphere creates a potential difference between the ionosphere and the lower atmosphere which removes cloud forming ions, from the lower atmosphere. (See figure 3.1 and figure 5.3 in Tinsley and Yu’s paper.) The ionosphere space charge is latitude specific (see figure 5.3.) Palle’s satellite analysis shows a significant reduction in clouds at the latitudes, as predicted by Tinsley and Yu.
The planetary cloud cover closely tracks GCR through two solar cycles. Around 1999 there is a gradual reduction in the earth’s total cloud cover and a reduction in the earth’s albedo based on the earthshine albedo data and satellite data. This reduction in cloud cover occurs when there is an increase in solar wind bursts due to coronal holes moving to the solar equator at the end of the solar cycle.
As noted in Enric Palle’s paper there is close correlation of GCR and planetary cloud cover for the period 1983 to 1994. Post 1994 the second mechanism electroscavenging removes cloud forming ions, therefore even though GCR is high there is no increase or reduction in clouds for the period. The third mechanism also removes cloud forming ions and due to the abrupt slow down in the solar magnetic cycle. The third mechanism is interesting as it fundamental to the explanation of a host of cosmological anomalies and paradoxes related to quasar and spiral galaxy formation and evolution with redshift. The same mechanism explains the peculiar axial ejection of blue stragglers and the equatorial ejection of blue stragglers from the Milky Way. The same mechanism explains the evolution of bulgeless spiral disc galaxies and the formation of bars in spiral disc galaxies. The same mechanism explains why quasar periodic variance doe not exhibit time dilation with redshift, why quasar spectrum does not exhibit evolution of metallicity with redshift, explains why there is an unexplained gradual reduction of maximum quasar luminosity with redshift and so on. The basic mechanism is due to what happens when very, very, large objects collapse.
http://www.solen.info/solar/images/comparison_recent_cycles.png
http://solar.njit.edu/preprints/palle1264.pdf
The correlation between annual mean low cloud and the ionization level at 2 km altitude exceeds the 99% significance level over mid-latitude oceans and globally over the period 1983–1994.
The second process, considered by Tinsley and Yu (2003), namely electroscavenging, depends on the action of the global electrical circuit (see review by Rycroft et al. (2000)). The transport of charge by rapidly rising convective currents in the tropics and over continental land masses leads to a _200 kV positive charge of the ionosphere compared to Earth. This large voltage difference, in turn, necessitates a return current which must pass through the regions of the atmosphere where clouds are formed. As cosmic rays are the principal agent of ionization in the atmosphere above 1 km altitude, any modulation of the GCR flux due to solar activity is likely to affect the transport of charge to complete the global electrical circuit. Tinsley and Yu (2003) discuss how the build up of electrostatic charge at the tops and bottoms of clouds could affect the scavenging of ice forming nuclei (IFN) and cloud condensation nuclei (CCN) by droplets, and how this can lead to greater rates of precipitation and a reduction in cloud cover. They find that the electroscavenging process is likely to be more important over oceanic rather than continental regions and that it leads to a positive correlation between clouds and cosmic rays at higher latitudes and a negative correlation at low latitudes. Thus the electroscavenging process can explain several of the most striking features of Fig. 5, namely: (1) the peak in significant positive correlations at latitudes around 50 degrees North and South (Fig. 5a); (2) the tendency for a less significant but nonetheless evident trend to negative correlation coefficients at low latitudes (Fig. 5a); and (3) the location of the peak in correlation over one of the principal oceans, namely over the North and South Atlantic (Fig. 5c).
http://www.agu.org/pubs/crossref/2009/2009JA014342.shtml
If the Sun is so quiet, why is the Earth ringing? A comparison of two solar minimum intervals.
Observations from the recent Whole Heliosphere Interval (WHI) solar minimum campaign are compared to last cycle’s Whole Sun Month (WSM) to demonstrate that sunspot numbers, while providing a good measure of solar activity, do not provide sufficient information to gauge solar and heliospheric magnetic complexity and its effect at the Earth. The present solar minimum is exceptionally quiet, with sunspot numbers at their lowest in 75 years and solar wind magnetic field strength lower than ever observed. Despite, or perhaps because of, a global weakness in the heliospheric magnetic field, large near-equatorial coronal holes lingered even as the sunspots disappeared. Consequently, for the months surrounding the WHI campaign, strong, long, and recurring high-speed streams in the solar wind intercepted the Earth in contrast to the weaker and more sporadic streams that occurred around the time of last cycle’s WSM campaign.
2005 paper by Georgieva, Bianchi, & Kirov “Once again about global warming and solar activity”
http://www.google.ca/url?sa=t&rct=j&q=&esrc=s&frm=1&source=web&cd=1&cad=rja&ved=0CEAQFjAA&url=http%3A%2F%2Fsait.oat.ts.astro.it%2FMSAIt760405%2FPDF%2F2005MmSAI..76..969G.pdf&ei=0VzeUKqnOcTVigKukoG4Dw&usg=AFQjCNE1HIIaQdO213fgDBS9nT2fvY3-Rg&sig2=fJJcGWaLuAqjFMD5nxoivQ&bvm=bv.1355534169,d.cGE
“It could therefore be concluded that both the decreasing correlation between sunspot number and geomagnetic activity, and the deviation of the global temperature temperature long-term trend from solar activity as expressed by the sunspot index are due to the increased number of high speed streams of solar wind on the decreasing phase and the minimum of sunspot in the last decade.”
It has been noted that in the last century the correlation between sunspot number and geomagnetic activity has been steadily decreasing from – 0.76 in the period 1868-1890 to 0.35 in the period 1960-1982, … According to Echer et al (2004), the probable cause seems to be related to the double peak structure of geomagnetic activity. The second peak, related to high speed solar wind from coronal holes (my comment: For example coronal hole 254 that produced the Dec 16, 2006 peak in solar wind, during a sun spot minimum, see attached link to Solar Observation Data), seems to have increased relative to the first one, related to sunspots (CMEs) but, as already mentioned, this type of solar activity is not accounted for by sunspot number. In figure 6 long term variations in global temperature are compared to the long-term variations in geomagnetic activity as expressed by the ak-index (Nevanlinna and Kataga 2003). The correlation between the two quantities is 0.85 with p< 0.01."
Steven Mosher, could you kindly provide an amplification of your remarks concerning no correlation between clouds and GCR?
Svensmark claims no correlation between GCR and middle (3.2 – 6.5 km) and high (>6.5 km) clouds but excellent correlation between GCR and low clouds (<3.2 km).
Caleb says:
December 28, 2012 at 7:39 pm
Leif, for a man who is excellent, when it comes to the narrow range of your expertise, you seem unaware of worlds outside your canyon.
When people come into my canyon I tell them the facts. And how do you justify to state that my range of expertise is ‘narrow’? as compared to many commenters here who have no expertise.
As per usual, the main characters in the shadow-debate here completely miss the central point. Alec Rawls is arguing that there is some (unknown) amplification factor that increases the impact of changes in the level of solar activity on the Earth’s climate. It is this claim that people should be addressing.
It’s as though there is a fight between Jo Frasier and Mohammad Ali and Jo has jumped out of the ring and beating the living-%$#782 out of one of the spectators in the back row.
Thanks to Scute for reading through the links and for coming, it seems, to a real understanding of the issues I have tried to raise. Just one correction: both my February comments on the First Order Draft of AR5 and my recent comments on the SOD of AR5 are to the Working Group 1 part of the report (“The Scientific Basis”).
Mr. Rawls,
I think the proxy divergence issue has been handled in the literature – and clear precedent was set on how to handle such a divergence. Make us a stick!.
Steven Mosher says:
December 28, 2012 at 6:20 pm
=======
“….use CRN which Anthony endorses.”
———–
How did Anthony enter into the equation ?
Alec Rawls said of Dana’s view of the physics involved: [Dana’s view is that] If you leave a pot of water on a steady flame it won’t heat. If you want to heat the water you have to keep turning the flame up….. ”
Very nice analogy …. and Dana has to acknowledge this is one freaking big pot of water……. and that he keeps telling how small is the solar forcing, but posits a theory of instant response.
Sometimes it’s OK to gauge warming just from surface temperature, and sometimes it’s not…
http://www.skepticalscience.com/global-warming-lesson-for-monckton-and-co.html
This is why Pielke Sr. also argued that global warming “is best diagnosed by changes in upper ocean heat content”. We don’t quite agree — we believe that global warming is best diagnosed by considering all warming measurements including both surface warming and ocean heat content,