
Guest post by Alec Rawls
When he argues that a reduction in forcing will cause cooling Dana Nuccitelli is not actually talking about drinking. He is talking about the solar forcing of global temperature, but the drinking analogy is a handy way to understand where his argument goes off the rails.
Mr. Nuccitelli, who blogs for the consensus-approved Skeptical Science website, was writing about Henrik Svensmark’s GCR-cloud theory of indirect solar forcing, where Galactic Cosmic Rays are hypothesized to seed cloud formation. If Svensmark is right then a strong solar wind, by deflecting some GCR from reaching the earth, in-effect blows some of the clouds away, letting more sunlight through to warm the planet’s surface.
That can’t possibly explain late 20th century warming says Nuccitelli, because GCR deflection has been estimated (see the Krivova-Solanki graph above) to have peaked by 1980. The raw data suggests the actual GCR minimum was ten years later, but set that aside. Nuccitelli thinks it is the change in the level of forcing, not the level of forcing, that determines whether the climate system warms or cools:
So, if GCRs really do amplify the solar influence on global temperatures, since 1980 they are amplifying a cooling effect.
Cooling begins when a forcing passes its peak? Fail. Daily temperatures don’t start falling at noon. They continue rising until mid-afternoon. The hottest time of the year isn’t the first day of summer (the summer solstice, after which the days start getting shorter), the hottest time is mid-summer. To think cooling should start when forcing passes its peak is like thinking you can sober up by drinking just a little more slowly.
Here’s a tip for Dana to keep in mind on New Year’s eve: it is the level of alcohol forcing that matters. If you are drinking alcohol faster than you body is excreting it (not exactly the way the earth excretes heat, but similar enough), then your blood alcohol is rising. You are getting drunker, even if you have lowered the rate of your drinking! That’s right, putting a little less rum in your egg nog will not sober you up! Your increasing inebriation will just be a little less rapid, and it is the same for solar forcing.
When the peak level of forcing appears in the rearview mirror, the downward trend in the forcing that begins at that point does not cause cooling. It just causes warming to be a little less rapid. Only when the energy pouring into the climate system falls to the level of the energy escaping back out does the system stop warming. Empirically, that turns out to be mid-afternoon, mid-summer, and approximately the first decade of the 21st century.
Three blind mice
Dana Nuccitelli produced one of three widely cited rebuttals to my suggestion that a new sentence that was added to the Second Order Draft of AR5, a sentence that admits strong evidence for some substantial mechanism of solar amplification, is a “game changer.” That admission is on page 7-43 of the SOD:
Many empirical relationships have been reported between GCR or cosmogenic isotope archives and some aspects of the climate system … The forcing from changes in total solar irradiance alone does not seem to account for these observations, implying the existence of an amplifying mechanism such as the hypothesized GCR-cloud link.
That’s a game changer because the only solar forcing included in the IPCC computer models is the very slight variance in solar irradiance (also known as TSI, or “the solar constant”). If there are other solar forcings in play, working through variables that actually vary substantially as solar activity ramps up and down, that kills the report’s key finding (on page 8-4) that we can have “very high confidence that natural forcing is a small fraction of the anthropogenic forcing.”
The two most widely cited rebuttals, which I answered last week, were both by lead authors from the IPCC. Steven Sherwood, one of 15 lead authors of chapter 7, pretended that the admission of evidence for “an amplifying mechanism” was only about GCR-cloud. He then proceeded to claim that the evidence for GCR-cloud points to a weak mechanism, and used that as a grounds for dismissing the idea that any substantial solar forcing beyond TSI could be at work.
Doesn’t follow. The evidence for “an amplifying mechanism” (emphasis added) is entirely separate from the evidence for the GCR-cloud mechanism. The former is paleo evidence, where numerous studies of the geologic record have found strong correlations between solar activity and climate going back many thousands of years. The evidence for the GCR-cloud mechanism is from cloud-chamber experiments and ongoing observations of cloud micro-physics.
It doesn’t matter how unconvinced Sherwood is by the evidence for the GCR-cloud mechanism. That evidence does nothing to counter the paleo evidence, cited in the draft report, that some mechanism of enhanced solar forcing must be at work. By using his discontent with the GCR-cloud theory as an excuse to dismiss the paleo evidence, Sherwood is inverting the scientific method, and he is lying to the public about what the report says, making him a seriously bad guy.
Apparently weak minds think alike because Nuccitelli did the same thing Sherwood did, only a day earlier. Dana’s post only looks at the GCR-cloud mechanism and completely ignores the draft report’s admission of strong evidence for some mechanism of solar amplification. It is in the context of that more fundamental mistake that Nuccitelli goes on to completely misinterpret the evidence for the GCR-cloud mechanism itself, claiming that anything less than peak forcing causes cooling, arguing in-effect that he can sober up by drinking a little slower. Just tell that to the officer Dana. He won’t even need to give you a breathalyzer.
More evidence that weak minds think alike is the second semi-official rebuttal to my “game change” claim, issued by Joanna Haigh, a lead author of the IPCC’s third report. Haigh proceeds on the same dishonest pretence as Sherwood, telling NewScientist magazine that the new sentence in the draft report is only about GCR-cloud, which she then dismisses with the same drinking-game mistake that Dana makes, claiming that if climate were being driven by solar activity then the planet would have started cooling when solar activity was at its peak:
Haigh points out that the sun actually began dimming slightly in the mid-1980s, if we take an average over its 11-year cycle, so fewer GCRs should have been deflected from Earth and more Earth-cooling clouds should have formed. “If there were some way cosmic rays could be causing global climate change, it should have started getting colder after 1985.”
Sober up Joanna. Have a single shot instead of a double. Works every time.
Which theory has more trouble with flat 21st century temperatures?
It is amusing how Dana Nuccitelli, through sheer incompetence, was able to prefigure the highly credentialed malfeasance of both of these IPCC fraudsters. Still, Nuccitelli has to be credited with at least a bit of misfeasance of his own because he wasn’t satisfied with just assuring his gullible readers that cooling commences when forcing is at its peak. That only supplied an excuse for dismissing a solar explanation for late 20th century warming, leaving the conspicuous lack of 21st century warming still to be dealt with. Dana’s solution? Pretend that the flat 21st century temperature record militates against a solar driver of climate:
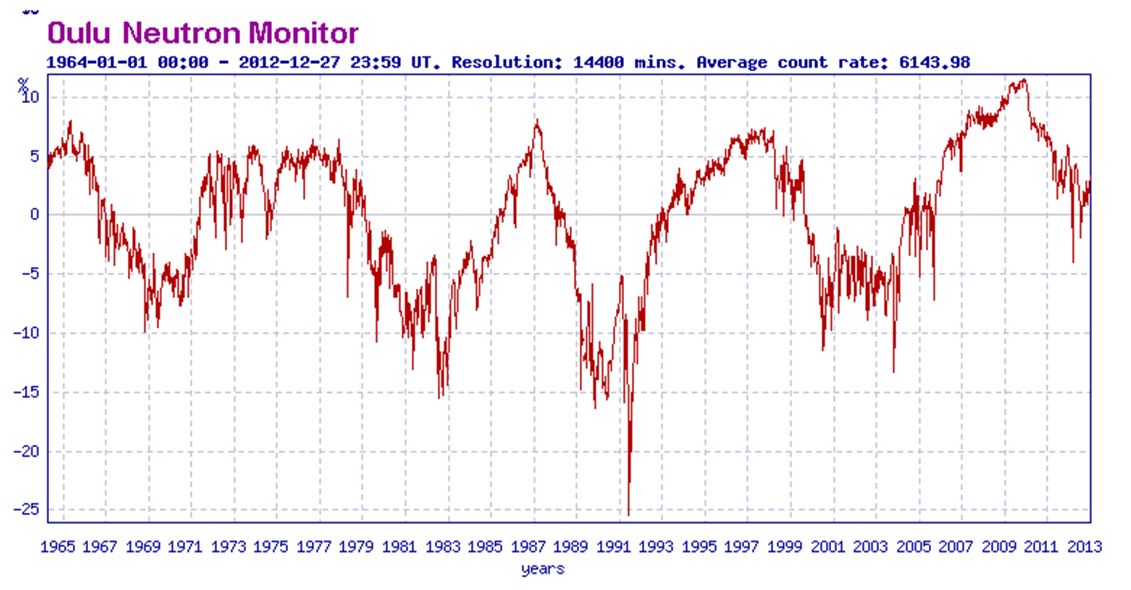
In fact, GCRs reaching Earth recently hit record high levels (Figure 4), yet temperatures are still way up.
Temperatures have merely flattened out, they haven’t gone down yet, and no Skeptical Science reader will ever learn that this is just what the discovered correlations between solar activity and climate predict. The strongest temperature response to a change in solar forcing is seen with a lag of about ten years (Usoskin et al. 2005), or one solar cycle (Solheim et al. 2012). The theory that is discomfited by flat 21st century temperatures is the CO2-warming theory, which predicts ever more rapidly increasing temperatures.
Dana might actually think that the flat 21st century temperature record causes trouble for the solar-warming theory but there is no way he can think it causes less trouble for the CO2-warming theory. For him to pretend that 21st century temperatures favor the CO2-warming theory is inexcusably dishonest, but as usual, the professionals are even worse. Note this little gem from the SOD (p. 7-44):
The lack of trend in the cosmic ray intensity over the last 50 years (Agee et al., 2012; McCracken and Beer, 2007) provides another strong argument against the hypothesis of a major contribution of cosmic rays to ongoing climate change.
That’s 15 IPCC lead authors all accepting the crackpot idea that you can only get drunk if your rate of drinking is going up. Steady exposure to the high 1950’s level of solar activity will keep you from warming, just as steady swilling of a high level of booze will keep you stone-cold sober. But where Dana only said that “temperatures are still way up” (implicitly acknowledging that they are no longer going up), the draft report here claims that temperatures are still going up (“ongoing climate change”).
Must be a Steven Sherwood sentence. He needs to look at page 10-3 of the SOD (emphasis added):
While the trend in global mean temperature since 1998 is not significantly different from zero, it is also consistent with natural variability superposed on the long-term anthropogenic warming trends projected by climate models.
Note that the “consistent with natural variability” part is a near call, after NOAA admitted in 2008 that 15 years of no warming would falsify current models. But yeah, let’s pretend it is the solar theory that has trouble with the lack of recent warming.
The Guardian, Andrew Sullivan, DeSmog, Romm etcetera, all pwned by Dana Nuccitelli’s error-filled AR5 post
The ensuing Skeptical Science newsletter bragged about how many eco-propagandists picked up on nutty Nuccitelli’s non-stop nonsense and the list is indeed impressive, a glaring testament to the total absence of due diligence on the part of these “journalists,” none of whom thought to question Dana’s advice on how to sober up quick. Here is the SkS tally of eco-scalps:
This was a very big week for SkS in the news. Dana’s IPCC Draft Report Leaked, Shows Global Warming is NOT Due to the Sun was re-posted and/or linked to by The Guardian, New York Times Green, New York Times Dot Earth, Huffington Post, Climate Progress, Mother Jones, Climate Crocks, Carbon Brief, Grist, Daily Beast, DeSmogBlog, Graham Readfearn, Der Spiegel, Maribo, Learn from Nature, Alternative Energy in the 21st Century, and Motherboard. It was also Tweeted by Michael Mann and Chris Mooney, among many others.
The only “consensus” journalist on this list who showed any integrity was Andrew Revkin, who had already written a post on my leak of the draft report. After updating that post with a link to Nuccitelli, Revkin updated again later with a link to the rebuttal that Jo Nova and I wrote about Seven Sherwood. Thanks Andrew, for being an actual journalist.
To put their “big week” in perspective the folks at Credulous Science reached high for sufficient words:
Winston Churchill once said: “A lie gets halfway around the world before the truth has a chance to get its pants on.” Not this time; we got the truth’s pants on in record time and nipped this myth in the bud before the contrarians were able to misinform the public.
The “truth” in their rendering is whatever patent falsehoods can be used to fool the ignorant into thinking they should fear CO2. No, nutty ones. You did not forge an exception to Churchill’s dictum. You provided a textbook example of it.
Dana is a poster child for those who feel a moral imperative to “believe the scientists”
For the last two years I have had a lot of fun exposing the large number of top climate scientists who claim that it is not the level of forcing that causes warming, but the trend in the forcing. They are all looking at the wrong derivative (one instead of zero).
Given the enormous pressure on the eco-left to accept what these government-funded climatologists are saying it is not surprising that someone like Dana Nuccitelli would swallow the idea that temperature really is driven by the trend in the forcing, and one super-wacky segment in Dana’s post indicates that he really is accepting that this is how physics works. If you leave a pot of water on a steady flame it won’t heat. If you want to heat the water you have to keep turning the flame up. The segment is titled, “Physical Reality Intrudes on Rawls”:
Rawls has argued to the contrary by claiming that the climate is still responding to the increase in solar activity from the early 20th century, and that GCRs are amplifying that solar warming from over 60 years ago. This argument is simply physically wrong. As Figure 2 illustrates, when solar activity rises, temperatures follow suit very soon thereafter. In fact, during the mid-20th century, solar activity and global surface temperatures both flattened out. Are we to believe that the planet suddenly began responding to the pre-1950 solar activity increase in 1975—2012, after not warming 1940—1975? The argument makes no physical sense.
Obviously I never said that late 20th century warming was caused by solar activity from the early 20th century and Dana does not give a citation for what argument of mine he is referring to but its easy to figure out. I have argued many times that if one combines the strong paleo correlations between solar activity and climate with the fact that solar activity was at what Ilya Usoskin calls “grand maximum” levels from 1920 to 2000 then it is certainly plausible that much of 20th century warming, including late 20th century warming, could have been caused by the sun. 80 years of a high level of enhanced solar forcing just might warm the place up a bit (and it only did warm a bit, about 0.8 °C over the century).
If I am attributing late 20th century warming to the high solar activity that persisted through 2000, why does Dana think I am attributing it to solar forcings from 60 years earlier? He must be fixed on the idea that only a change in the level of solar forcing can cause warming. That’s what all of these top scientists have been telling everyone and there was no rise in solar activity after 1950, hence any solar-caused warming would have to stem from the pre-1950 rise in solar activity.
But come on Dana. That is not what I am saying. That is what they are saying, and I have been trying my darnedest to expose it as a blatant misrepresentation. I’m not attributing late 20th century warming to the pre-1950 rise in solar activity. I’m attributing it to the fact that solar activity remained at close to the same high 1950’s level until 2000 (or 2003). It is the level of the forcing that causes warming, not the trend in the forcing.
I have to feel bad for Dana on this point. It isn’t his fault. He has been systematically duped by this parade of so-called scientists all telling him that a persistent high level of forcing can’t cause continued warming. Makes me want to put him on a milk carton. The poor guy isn’t just lost, he was kidnapped. Want a piece of candy little boy? Credulous Science indeed.
Leif writes “Which you had a hard time believing. But it is not yet sure that the [correlation] is real: these [are difficult] measurements and need to be confirmed first.”
WTF? I pointed it out to you mate. If you look in the RC thread you’ll see my comments in there on this topic from over two years ago.
http://www.realclimate.org/index.php/archives/2010/10/solar-spectral-stumper/
This, incidentally, could be your start point on looking at the SIM data and early findings Henry.
The point is though Leif, while you harp on about how TSI doesn’t change much and Grand Solar Maximums or lack thereof, you’re ignoring an effect that could be at least partly the cause of the recent warming beyond what “TSI” could produce.
Yes, we dont have much SIM data and yes its difficult to form any definite conclusions beyond the fact we just dont know any more.
TimTheToolMan says:
January 2, 2013 at 1:11 am
WTF? I pointed it out to you mate.
You said:
“And nobody noticed this correlation prior to the SIM data? I find that very hard to believe.”
So, you find it hard to believe that nobody noticed this correlation prior to the SIM data.
you’re ignoring an effect that could be at least partly the cause of the recent warming beyond what “TSI” could produce
Here you can see: slide 3 of http://www.leif.org/research/The%20long-term%20variation%20of%20solar%20activity.pdf the minuscule effect of the changes in UV and Visible related to the Harder ‘effect’.
What is SIM? If anyone can tell me: Is TSI measured on TOA or is at measured at sea level, below the atmosphere, (on a cloudless day?)
How is TSI measured? if on TOA, how do they prevent deterioration of the sensor?
TSI is measured out in space [no atmosphere] by measuring the heating of the sensor when exposed to direct sunlight. There is degradation, but it is measured and corrected for.
vukcevic says:
January 1, 2013 at 5:28 am
“Hi doc
Did you mean this
http://www.leif.org/EOS/1990MNRAS247.pdf
?”
Or this: http://www.leif.org/EOS/92RG01571-Aurorae.pdf
Ulric Lyons says:
January 2, 2013 at 6:41 am
Or this: http://www.leif.org/EOS/92RG01571-Aurorae.pdf
Or this: http://meetings.copernicus.org/www.cosis.net/abstracts/EGU2007/02571/EGU2007-J-02571.pdf
or this: http://www.leif.org/EOS/Eddy/2007SP_prairie.pdf by Foukal and Eddy
“The historical eclipse observations described here seem to require the presence of even the bright network structures, and thus of substantial solar photospheric magnetism during at least the last decade of the Maunder Minimum. Hence, the red-flash observations would argue against a climatologically important decrease in TSI during that period of time.”
I have argued with Dana on this topic and other topics as well on Yahoo answers for years. I think he got most of his climate science training in the Global Warming Section Forum on Yahoo answers, he is the top answerer that’s why he is a little confused, lol.
http://answers.yahoo.com/dir/index?link=list&sid=2115500306
Leif
TSI for those two sunspot values were 1361.367 and 1361.442, an increase of 0.0055% resulting in a temperature increase of 0.004 degrees. THAT is basic.
The averageing-over-156-years basic, fine. And suddenly there is no water on this planet, fine.
The ocean heat content still has not recovered from the LIA (and probably not even from the last glacial because of the ice feedback). Even if there were 50 years of present day solar activity in the middle of LIA it wouldn’t make much difference. The ocean (and the ice) is a low pass filter for the solar input.
Tim the Toolman quotes:
Conceivably, there might be another missing element (such as a cosmic-ray/cloud connection) that would counteract this physics and restore the expected sign of the change, but no-one has succeeded in finding any mechanism that would quantitatively give anything close the size of effect that would now be required (see our previous posts on the subject).
Henry says
I already observed that in a cooling period such as the current 1995 -2040 in certain places there are more clouds/rain/snow etc.
http://blogs.24.com/henryp/2012/10/02/best-sine-wave-fit-for-the-drop-in-global-maximum-temperatures/#comment-198
but it is purely due to physical reasons:
http://blogs.24.com/henryp/2012/10/02/best-sine-wave-fit-for-the-drop-in-global-maximum-temperatures/#comment-192
nothing to do with cosmic rays…
lgl says:
January 2, 2013 at 9:31 am
Even if there were 50 years of present day solar activity in the middle of LIA it wouldn’t make much difference.
So, even if there were a Modern Grand Maximum is wouldn’t make much difference by your argument. I think I could agree with that.
Applying your argument once more: even if there were a 70-yr drop in solar activity, it would not make much difference. Again, that I could agree with.
lsvalgaard says:
January 2, 2013 at 7:11 am
“Hence, the red-flash observations would argue against a climatologically important decrease in TSI during that period of time.”
Yet another diversion from the man who says the solar wind speed does not matter with Aurora.
No Leif, the Aurora were at a very low ebb in the late 17th Century, as they were in the Dalton minimum too.
http://www.leif.org/EOS/92RG01571-Aurorae.pdf
Ulric Lyons says:
January 2, 2013 at 10:38 am
Yet another diversion from the man who says the solar wind speed does not matter with Aurora.
In the auroral zones there are aurorae ALL THE TIME, every day, every minute, regardless of solar wind speed.
Whether you observe an aurorae at mid- or low-latitude depends the occurrence of a geomagnetic storm depending much more on the magnetic field and its orientation. The Ap [or even better the Dst] index is a decent indicator of the chance of auroral sighting at mid-latitudes.
No Leif, the Aurora were at a very low ebb in the late 17th Century, as they were in the Dalton minimum too
And, as Silverman points out, also during the low activity around and just after 1900. Yet in 1900 the solar wind did not go away. It was, in fact, comparable to recent solar activity.
Ulric Lyons says:
January 2, 2013 at 10:38 am
the solar wind speed does not matter with Aurora.
In the auroral zones there are aurorae ALL THE TIME, every day, every minute, regardless of solar wind speed. Observing aurorae at mid- and low-latitudes requires geomagnetic storms where the real determinant is the solar wind magnetic field strength and [especially] direction.
the Aurora were at a very low ebb in the late 17th Century, as they were in the Dalton minimum too.
And as Silverman points out also at the beginning of the 20th century, where activity was as low as in recent times. Yet the solar wind is still blowing with the same ‘strength’ now and back then and back during the Maunder Minimum. During the 17 century many large comets with conspicuous ion tails were observed. Such tails require a significant solar wind.
lsvalgaard said:
“In the auroral zones there are aurorae ALL THE TIME, every day, every minute, regardless of solar wind speed.”
SHOUTING won’t help you. I’ll go with the graphs from the paper thanks, they are the results from many locations and show a large decrease in sighted Aurora through Maunder and Dalton.
“And, as Silverman points out, also during the low activity around and just after 1900. Yet in 1900 the solar wind did not go away. It was, in fact, comparable to recent solar activity.”
And there have been some record cold periods recently precisely when the solar wind was slow (who said anything about it going away?).
“During the 17 century many large comets with conspicuous ion tails were observed. Such tails require a significant solar wind.”
And what about the comets that were not noticed? there is no such record, unlike cold periods that exactly coincide with a lack of Aurora. The comet observations are undated and therefore of no particular value. For all we know the comet observations were during warmer seasons in Maunder when the SW was faster.
Ulric Lyons says:
January 2, 2013 at 1:08 pm
I’ll go with the graphs from the paper thanks
So, you deny that there are aurorae all the time, every day, every minute…
And there have been some record cold periods recently precisely when the solar wind was slow (who said anything about it going away?).
And there has been some recent hot periods as well. Temperature is not correlated with Solar wind speed: http://www.leif.org/research/Correlation-Ap-Temp-Not.png
The comet observations are undated and therefore of no particular value.
All observed comets are very precisely dated. Educate yourself.
Leif reminds us of the conversation ““And nobody noticed this correlation prior to the SIM data? I find that very hard to believe.”
So, you find it hard to believe that nobody noticed this correlation prior to the SIM data.”
But the point I was trying to make was that you thought the ionisation energies show that there is no long term change in UV levels but I dont think thats a good measure because when the previous solar spectral model was put together (with little variation) they could have correlated visible at the earth’s suface with ionisation energies as a proxy for UV and found this relationship before the SIM data. They didn’t (although its one of those obvious things to look at when formulating a spectral model) and hence ionisation energies as we’ve been measuring in the past aren’t a good enough proxy for UV and your belief in UV having no trend over the long term is faulty IMO.
Leif writes “Here you can see: slide 3 of http://www.leif.org/research/The%20long-term%20variation%20of%20solar%20activity.pdf the minuscule effect of the changes in UV and Visible related to the Harder ‘effect’.”
And exactly what is the long term trend in the UV and Visible (not TSI), Leif?
TimTheToolMan says:
January 2, 2013 at 1:32 pm
But the point I was trying to make was that you thought the ionisation energies show that there is no long term change in UV levels but I dont think thats a good measure
No, the UV creates the ionosphere. The higher the UV level, the more ions are created. The ions move across the Earth’s magnetic field and an electric current results by induction. The magnetic effects of that current has been measured at ground-level since 1722 when the effect was discovered, so we know what the level of UV has been since then. The physics of this is very well understood:
” In the dynamo region of the ionosphere (100–150 km altitude), atmospheric tides dominate the wind system. These tides generate electromotive forces and drive electric currents by moving the electrically conducting air in the ionosphere through the Earth’s magnetic field [e.g., Richmond, 1979, 1989]. Model calculations of the ionospheric wind-dynamo currents can quantitatively explain the daily variation of the geomagnetic field at middle and low geomagnetic latitudes (below 60º) [e.g., Richmond and Roble, 1987].”
Richmond, A. D. (1979), Ionospheric wind dynamo theory: A review, J. Geomagn. Geoelectr., 31, 287–310.
Richmond, A. D. (1989), Modeling the ionosphere wind dynamo: A review, Pure Appl. Geophys., 47, 413–435.
Richmond, A. D., and R. G. Roble (1987), Electrodynamic effects of the thermospheric winds from the NCAR thermospheric general circulation model, J. Geophys. Res., 92(A11), 12,365–12,376.
TimTheToolMan says:
January 2, 2013 at 1:39 pm
And exactly what is the long term trend in the UV and Visible (not TSI), Leif?
Slide 53 of http://www.leif.org/research/HAO-Seminar,%20How%20Well%20Do%20We%20Know%20the%20SSN.pdf shows UV back to 1782, Tim
lsvalgaard said:
“So, you deny that there are aurorae all the time, every day, every minute…”
Not at all, I deny that the solar wind was at typical levels through Maunder.
“Temperature is not correlated with Solar wind speed”
That depends on what temperature you measure (e.g. land or ocean) and at what time scale.
“All observed comets are very precisely dated. Educate yourself.”
There are no dates given in the paper you linked to:
http://meetings.copernicus.org/www.cosis.net/abstracts/EGU2007/02571/EGU2007-J-02571.pdf
Ulric Lyons says:
January 2, 2013 at 2:46 pm
Not at all, I deny that the solar wind was at typical levels through Maunder.
On what is that denial based?
That depends on what temperature you measure (e.g. land or ocean) and at what time scale.
not at all.
There are no dates given in the paper you linked to:
http://meetings.copernicus.org/www.cosis.net/abstracts/EGU2007/02571/EGU2007-J-02571.pdf
Are there dates in your link to auroral data. Any knowledgeable person would know about the well-observed comets during the Maunder Minimum, e.g. Halley’s Comet: http://en.wikipedia.org/wiki/Halley's_Comet
Leif writes “And exactly what is the long term trend in the UV and Visible (not TSI), Leif?
Slide 53 of http://www.leif.org/research/HAO-Seminar,%20How%20Well%20Do%20We%20Know%20the%20SSN.pdf shows UV back to 1782, Tim”
And Visible? And that still doesn’t answer why the correlation was never spotted until very recently between UV and Visible. If ionisation is a good proxy for UV then it should have stood out reasonably clearly. And if it turns out there is no clear correlation then its worse. That means for any value of TSI, you cant tell what the corresponding UV and Visible components actually are and so cant be specific about the atmospheric forcings. You’re shooting in the dark.
lsvalgaard said:
“On what is that denial based?”
Obviously the lack of Aurorae,
“not at all.”
Yes very much so as El Nino’s are a negative feedback to cooling from lower SW speeds, so there no point in comparing to say monthly global temperatures or whatever you have used in your scatter plot.
“Are there dates in your link to auroral data. Any knowledgeable person would know about the well-observed comets during the Maunder Minimum, e.g. Halley’s Comet: http://en.wikipedia.org/wiki/Halley's_Comet ”
One comet in a fairly average September tells us nothing. For all you know Halley’s tail may be well defined and visible with SW speeds less than 300kps, you just don’t know.
TimTheToolMan says:
January 2, 2013 at 3:17 pm
And Visible? And that still doesn’t answer why the correlation was never spotted until very recently between UV and Visible.
Because we have not had any direct measurements of UV as a function of wave length before
If ionisation is a good proxy for UV then it should have stood out reasonably clearly. And if it turns out there is no clear correlation then its worse.
The integrated UV stands out extremely clearly. What we don’r have is any measurements of TSI before 1978.
That means for any value of TSI, you cant tell what the corresponding UV and Visible components actually are and so cant be specific about the atmospheric forcings.
As far as we know about the physics, the magnetic field which is responsible both variations of both UV and TSI does not result in different dependencies.
You’re shooting in the dark.
And you are not? But, no, we are not shooting in the dark as far as UV is concerned. TSI is another story.
Ulric Lyons says:
January 2, 2013 at 3:28 pm
Obviously the lack of Aurorae
There was that lack at the beginning of the 20th century, yet the solar wind speed was still about 400 km/s
Yes very much so as El Nino’s are a negative feedback to cooling from lower SW speeds
This is your unsubstantiated belief.
One comet in a fairly average September tells us nothing. For all you know Halley’s tail may be well defined and visible with SW speeds less than 300kps, you just don’t know.
We know the dates for all the comets the past 2000 years and some even earlier than that.
Not knowing works both ways. What we do know from the early 1900s when there also were very few aurorae is that the solar wind speed then was around 400 km/s. We can even measure that directly by looking as tail disconnects, e.g. Comet Morehouse in 1908, see. slide 9 of http://www.leif.org/research/On-Becoming-a-Scientist.ppt
lsvalgaard said:
“There was that lack at the beginning of the 20th century, yet the solar wind speed was still about 400 km/s”
Looking at the low in the Ap index around 1902, I don’t believe that for a moment:
http://www.leif.org/research/Ap-1844-now.png
“This is your unsubstantiated belief.”
It is an astute observation.
“What we do know from the early 1900s when there also were very few aurorae is that the solar wind speed then was around 400 km/s. We can even measure that directly by looking as tail disconnects, e.g. Comet Morehouse in 1908,”
Not valid, Ap was up again by then.
Leif writes “The integrated UV stands out extremely clearly. What we don’r have is any measurements of TSI before 1978.”
I mean stand out clearly when compared to Visible as a correlation.
Leif writes “As far as we know about the physics, the magnetic field which is responsible both variations of both UV and TSI does not result in different dependencies.”
As far as who knows? The fact is that unless proven wrong, the magnetic field which is responsible both variations of both UV and Visible according to the SIM data does result in different dependencies because it was originally thought to have a positive correlation with TSI and it turns out to have been measured to have a negative correlation in the case of Visible. This was unexpected. Obviously its (almost certainly) not new physics but its definitely a different dependency.
Leif writes “And you are not? But, no, we are not shooting in the dark as far as UV is concerned. TSI is another story.”
Once again for luck, its not TSI that necessarily matters as far as atmospheric warming goes, its the components that make it up and if TSI is “unknown”, then those components are very unknown. If the variations are out of phase with the solar cycle (as they seem to be), then there will be some pretty serious head scratching as to the implications and how to deal with that.
Ulric Lyons says:
January 2, 2013 at 5:22 pm
Looking at the low in the Ap index around 1902, I don’t believe that for a moment
Comet Moorehouse was just an example. Every comet has tail disconnections. But there are other ways of measuring solar wind speed back then:
http://www.leif.org/research/2007JA012437.pdf
For 2009 the average speed was 367 km/s for an Ap of 4.0;
for 1901-1902 the average speed was 308 km/s for an Ap of 4.4.
The differences are not significant.
TimTheToolMan says:
January 2, 2013 at 7:41 pm
As far as who knows? The fact is that unless proven wrong, the magnetic field which is responsible both variations of both UV and Visible according to the SIM data does result in different dependencies because it was originally thought to have a positive correlation with TSI and it turns out to have been measured to have a negative correlation in the case of Visible. This was unexpected. Obviously its (almost certainly) not new physics but its definitely a different dependency.
If that dependency is found in all solar cycles, then nothing changes. If it is only for the last cycle, then we don’t need to invoke it for all the past cycles. And it is not clear that the data is any good.
If the variations are out of phase with the solar cycle (as they seem to be), then there will be some pretty serious head scratching as to the implications and how to deal with that.
People have scratched and the difference is minute, so the implications are not significant, e.g. slide 3 of http://www.leif.org/research/The%20long-term%20variation%20of%20solar%20activity.pdf