
Guest post by Alec Rawls
When he argues that a reduction in forcing will cause cooling Dana Nuccitelli is not actually talking about drinking. He is talking about the solar forcing of global temperature, but the drinking analogy is a handy way to understand where his argument goes off the rails.
Mr. Nuccitelli, who blogs for the consensus-approved Skeptical Science website, was writing about Henrik Svensmark’s GCR-cloud theory of indirect solar forcing, where Galactic Cosmic Rays are hypothesized to seed cloud formation. If Svensmark is right then a strong solar wind, by deflecting some GCR from reaching the earth, in-effect blows some of the clouds away, letting more sunlight through to warm the planet’s surface.
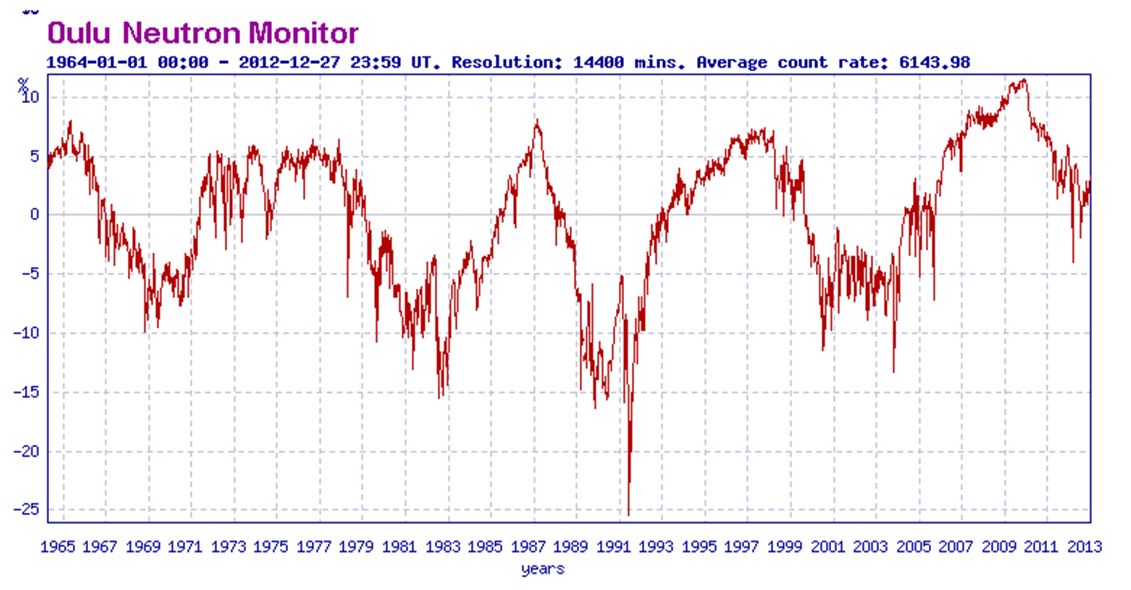
That can’t possibly explain late 20th century warming says Nuccitelli, because GCR deflection has been estimated (see the Krivova-Solanki graph above) to have peaked by 1980. The raw data suggests the actual GCR minimum was ten years later, but set that aside. Nuccitelli thinks it is the change in the level of forcing, not the level of forcing, that determines whether the climate system warms or cools:
So, if GCRs really do amplify the solar influence on global temperatures, since 1980 they are amplifying a cooling effect.
Cooling begins when a forcing passes its peak? Fail. Daily temperatures don’t start falling at noon. They continue rising until mid-afternoon. The hottest time of the year isn’t the first day of summer (the summer solstice, after which the days start getting shorter), the hottest time is mid-summer. To think cooling should start when forcing passes its peak is like thinking you can sober up by drinking just a little more slowly.
Here’s a tip for Dana to keep in mind on New Year’s eve: it is the level of alcohol forcing that matters. If you are drinking alcohol faster than you body is excreting it (not exactly the way the earth excretes heat, but similar enough), then your blood alcohol is rising. You are getting drunker, even if you have lowered the rate of your drinking! That’s right, putting a little less rum in your egg nog will not sober you up! Your increasing inebriation will just be a little less rapid, and it is the same for solar forcing.
When the peak level of forcing appears in the rearview mirror, the downward trend in the forcing that begins at that point does not cause cooling. It just causes warming to be a little less rapid. Only when the energy pouring into the climate system falls to the level of the energy escaping back out does the system stop warming. Empirically, that turns out to be mid-afternoon, mid-summer, and approximately the first decade of the 21st century.
Three blind mice
Dana Nuccitelli produced one of three widely cited rebuttals to my suggestion that a new sentence that was added to the Second Order Draft of AR5, a sentence that admits strong evidence for some substantial mechanism of solar amplification, is a “game changer.” That admission is on page 7-43 of the SOD:
Many empirical relationships have been reported between GCR or cosmogenic isotope archives and some aspects of the climate system … The forcing from changes in total solar irradiance alone does not seem to account for these observations, implying the existence of an amplifying mechanism such as the hypothesized GCR-cloud link.
That’s a game changer because the only solar forcing included in the IPCC computer models is the very slight variance in solar irradiance (also known as TSI, or “the solar constant”). If there are other solar forcings in play, working through variables that actually vary substantially as solar activity ramps up and down, that kills the report’s key finding (on page 8-4) that we can have “very high confidence that natural forcing is a small fraction of the anthropogenic forcing.”
The two most widely cited rebuttals, which I answered last week, were both by lead authors from the IPCC. Steven Sherwood, one of 15 lead authors of chapter 7, pretended that the admission of evidence for “an amplifying mechanism” was only about GCR-cloud. He then proceeded to claim that the evidence for GCR-cloud points to a weak mechanism, and used that as a grounds for dismissing the idea that any substantial solar forcing beyond TSI could be at work.
Doesn’t follow. The evidence for “an amplifying mechanism” (emphasis added) is entirely separate from the evidence for the GCR-cloud mechanism. The former is paleo evidence, where numerous studies of the geologic record have found strong correlations between solar activity and climate going back many thousands of years. The evidence for the GCR-cloud mechanism is from cloud-chamber experiments and ongoing observations of cloud micro-physics.
It doesn’t matter how unconvinced Sherwood is by the evidence for the GCR-cloud mechanism. That evidence does nothing to counter the paleo evidence, cited in the draft report, that some mechanism of enhanced solar forcing must be at work. By using his discontent with the GCR-cloud theory as an excuse to dismiss the paleo evidence, Sherwood is inverting the scientific method, and he is lying to the public about what the report says, making him a seriously bad guy.
Apparently weak minds think alike because Nuccitelli did the same thing Sherwood did, only a day earlier. Dana’s post only looks at the GCR-cloud mechanism and completely ignores the draft report’s admission of strong evidence for some mechanism of solar amplification. It is in the context of that more fundamental mistake that Nuccitelli goes on to completely misinterpret the evidence for the GCR-cloud mechanism itself, claiming that anything less than peak forcing causes cooling, arguing in-effect that he can sober up by drinking a little slower. Just tell that to the officer Dana. He won’t even need to give you a breathalyzer.
More evidence that weak minds think alike is the second semi-official rebuttal to my “game change” claim, issued by Joanna Haigh, a lead author of the IPCC’s third report. Haigh proceeds on the same dishonest pretence as Sherwood, telling NewScientist magazine that the new sentence in the draft report is only about GCR-cloud, which she then dismisses with the same drinking-game mistake that Dana makes, claiming that if climate were being driven by solar activity then the planet would have started cooling when solar activity was at its peak:
Haigh points out that the sun actually began dimming slightly in the mid-1980s, if we take an average over its 11-year cycle, so fewer GCRs should have been deflected from Earth and more Earth-cooling clouds should have formed. “If there were some way cosmic rays could be causing global climate change, it should have started getting colder after 1985.”
Sober up Joanna. Have a single shot instead of a double. Works every time.
Which theory has more trouble with flat 21st century temperatures?
It is amusing how Dana Nuccitelli, through sheer incompetence, was able to prefigure the highly credentialed malfeasance of both of these IPCC fraudsters. Still, Nuccitelli has to be credited with at least a bit of misfeasance of his own because he wasn’t satisfied with just assuring his gullible readers that cooling commences when forcing is at its peak. That only supplied an excuse for dismissing a solar explanation for late 20th century warming, leaving the conspicuous lack of 21st century warming still to be dealt with. Dana’s solution? Pretend that the flat 21st century temperature record militates against a solar driver of climate:
In fact, GCRs reaching Earth recently hit record high levels (Figure 4), yet temperatures are still way up.
Temperatures have merely flattened out, they haven’t gone down yet, and no Skeptical Science reader will ever learn that this is just what the discovered correlations between solar activity and climate predict. The strongest temperature response to a change in solar forcing is seen with a lag of about ten years (Usoskin et al. 2005), or one solar cycle (Solheim et al. 2012). The theory that is discomfited by flat 21st century temperatures is the CO2-warming theory, which predicts ever more rapidly increasing temperatures.
Dana might actually think that the flat 21st century temperature record causes trouble for the solar-warming theory but there is no way he can think it causes less trouble for the CO2-warming theory. For him to pretend that 21st century temperatures favor the CO2-warming theory is inexcusably dishonest, but as usual, the professionals are even worse. Note this little gem from the SOD (p. 7-44):
The lack of trend in the cosmic ray intensity over the last 50 years (Agee et al., 2012; McCracken and Beer, 2007) provides another strong argument against the hypothesis of a major contribution of cosmic rays to ongoing climate change.
That’s 15 IPCC lead authors all accepting the crackpot idea that you can only get drunk if your rate of drinking is going up. Steady exposure to the high 1950’s level of solar activity will keep you from warming, just as steady swilling of a high level of booze will keep you stone-cold sober. But where Dana only said that “temperatures are still way up” (implicitly acknowledging that they are no longer going up), the draft report here claims that temperatures are still going up (“ongoing climate change”).
Must be a Steven Sherwood sentence. He needs to look at page 10-3 of the SOD (emphasis added):
While the trend in global mean temperature since 1998 is not significantly different from zero, it is also consistent with natural variability superposed on the long-term anthropogenic warming trends projected by climate models.
Note that the “consistent with natural variability” part is a near call, after NOAA admitted in 2008 that 15 years of no warming would falsify current models. But yeah, let’s pretend it is the solar theory that has trouble with the lack of recent warming.
The Guardian, Andrew Sullivan, DeSmog, Romm etcetera, all pwned by Dana Nuccitelli’s error-filled AR5 post
The ensuing Skeptical Science newsletter bragged about how many eco-propagandists picked up on nutty Nuccitelli’s non-stop nonsense and the list is indeed impressive, a glaring testament to the total absence of due diligence on the part of these “journalists,” none of whom thought to question Dana’s advice on how to sober up quick. Here is the SkS tally of eco-scalps:
This was a very big week for SkS in the news. Dana’s IPCC Draft Report Leaked, Shows Global Warming is NOT Due to the Sun was re-posted and/or linked to by The Guardian, New York Times Green, New York Times Dot Earth, Huffington Post, Climate Progress, Mother Jones, Climate Crocks, Carbon Brief, Grist, Daily Beast, DeSmogBlog, Graham Readfearn, Der Spiegel, Maribo, Learn from Nature, Alternative Energy in the 21st Century, and Motherboard. It was also Tweeted by Michael Mann and Chris Mooney, among many others.
The only “consensus” journalist on this list who showed any integrity was Andrew Revkin, who had already written a post on my leak of the draft report. After updating that post with a link to Nuccitelli, Revkin updated again later with a link to the rebuttal that Jo Nova and I wrote about Seven Sherwood. Thanks Andrew, for being an actual journalist.
To put their “big week” in perspective the folks at Credulous Science reached high for sufficient words:
Winston Churchill once said: “A lie gets halfway around the world before the truth has a chance to get its pants on.” Not this time; we got the truth’s pants on in record time and nipped this myth in the bud before the contrarians were able to misinform the public.
The “truth” in their rendering is whatever patent falsehoods can be used to fool the ignorant into thinking they should fear CO2. No, nutty ones. You did not forge an exception to Churchill’s dictum. You provided a textbook example of it.
Dana is a poster child for those who feel a moral imperative to “believe the scientists”
For the last two years I have had a lot of fun exposing the large number of top climate scientists who claim that it is not the level of forcing that causes warming, but the trend in the forcing. They are all looking at the wrong derivative (one instead of zero).
Given the enormous pressure on the eco-left to accept what these government-funded climatologists are saying it is not surprising that someone like Dana Nuccitelli would swallow the idea that temperature really is driven by the trend in the forcing, and one super-wacky segment in Dana’s post indicates that he really is accepting that this is how physics works. If you leave a pot of water on a steady flame it won’t heat. If you want to heat the water you have to keep turning the flame up. The segment is titled, “Physical Reality Intrudes on Rawls”:
Rawls has argued to the contrary by claiming that the climate is still responding to the increase in solar activity from the early 20th century, and that GCRs are amplifying that solar warming from over 60 years ago. This argument is simply physically wrong. As Figure 2 illustrates, when solar activity rises, temperatures follow suit very soon thereafter. In fact, during the mid-20th century, solar activity and global surface temperatures both flattened out. Are we to believe that the planet suddenly began responding to the pre-1950 solar activity increase in 1975—2012, after not warming 1940—1975? The argument makes no physical sense.
Obviously I never said that late 20th century warming was caused by solar activity from the early 20th century and Dana does not give a citation for what argument of mine he is referring to but its easy to figure out. I have argued many times that if one combines the strong paleo correlations between solar activity and climate with the fact that solar activity was at what Ilya Usoskin calls “grand maximum” levels from 1920 to 2000 then it is certainly plausible that much of 20th century warming, including late 20th century warming, could have been caused by the sun. 80 years of a high level of enhanced solar forcing just might warm the place up a bit (and it only did warm a bit, about 0.8 °C over the century).
If I am attributing late 20th century warming to the high solar activity that persisted through 2000, why does Dana think I am attributing it to solar forcings from 60 years earlier? He must be fixed on the idea that only a change in the level of solar forcing can cause warming. That’s what all of these top scientists have been telling everyone and there was no rise in solar activity after 1950, hence any solar-caused warming would have to stem from the pre-1950 rise in solar activity.
But come on Dana. That is not what I am saying. That is what they are saying, and I have been trying my darnedest to expose it as a blatant misrepresentation. I’m not attributing late 20th century warming to the pre-1950 rise in solar activity. I’m attributing it to the fact that solar activity remained at close to the same high 1950’s level until 2000 (or 2003). It is the level of the forcing that causes warming, not the trend in the forcing.
I have to feel bad for Dana on this point. It isn’t his fault. He has been systematically duped by this parade of so-called scientists all telling him that a persistent high level of forcing can’t cause continued warming. Makes me want to put him on a milk carton. The poor guy isn’t just lost, he was kidnapped. Want a piece of candy little boy? Credulous Science indeed.
Leif
“An definite integral involves an interval over which the integral is taken. What is your interval?”
Isn’t the next strong variation (above the 11yr cycle) around 100 years? The interval must be well above 100 years, but less than the oceans equilibrium time (which I do not know)
lgl says:
December 31, 2012 at 11:55 am
Isn’t the next strong variation (above the 11yr cycle) around 100 years? The interval must be well above 100 years, but less than the oceans equilibrium time (which I do not know)
So you don’t know what the integral looks like. Perhaps integrating over 156 years, which will divide the last 312 years [where we have data] into two halves. The integral over the first half is 53 and over the 2nd half it is 60, hardly a Grand Maximum.
Now what people call the Modern Grand Maximum is illustrated in the two small inserts on this plot of sunspot activity since 1700: http://www.leif.org/research/Modern-Grand-Maximum-NOT.png
It should be clear that there is no MGM.
HenryP
Yes, I’m using mean temp and I see no reason why means and maxima should have different cycle times, do you? Also I doubt we will continue to cool longer that until 2035
http://virakkraft.com/Hadcrut4-Nino34-detrended.png 🙂
Reblogged this on Standard Climate.
lgl says:
December 31, 2012 at 11:55 am
The interval must be well above 100 years, but less than the oceans equilibrium time (which I do not know)
Whether there is a SOLAR MGM does not depend on the oceans.
lsvalgaard says:
December 29, 2012 at 12:44 pm
“The result of integration over that interval is a single number.”
Wow. It really hadn’t occurred to you that the integration is a running sum?
“Hale did not assign a negative sign to every other solar cycle.”
Cycles at about 20 and 24 years are rectified in the SSN, producing apparent cycles at approximately 12 years, 10 years, 11 years, and 120 years. The sign is determined relative to magnetic polarity. As the Wiki article notes:
Climate may not be “insensitive to magnetic polarity.”
vukcevic says:
December 30, 2012 at 12:57 am
“The agenda that sun doesn’t affect climate, one way or the other, whatever the mechanism/s may be, is becoming less and less convincing.”
Just wanted to give you moral support, buddy. I’ve personally given up on Leif. Whatever the breadth of his knowledge, it is not mathematically deep, and it is pointless to argue with him.
Bart says:
December 31, 2012 at 12:51 pm
Wow. It really hadn’t occurred to you that the integration is a running sum?
Precision in word and expression is a prerequisite in science. If you mean a ‘running sum’, call it a running sum.
Leif
Maybe there isn’t a power maximum but there is a energy maximum. The oceans make that an important distinction.
lgl says
I see no reason why means and maxima should have different cycle times, do you? Also I doubt we will continue to cool longer than until 2035
henry says
big difference.
Earth stores energy in its oceans, waters, vegetations, chemicals, even in currents and weather, etc. On top of that we have earth’s own volcanic actions which also provides heating/cooling, whatever. Ice, more or less of it, also becomes a factor. I also found that earth’s inner core, molten hot iron, also changes position sometimes, creating more heat in one place and less in another. So whatever comes out as average temp. is bound to be very confusing.
Maxima is a much better parameter to look at as it gives us a sense of energy in.
Depending on the factors, there could be a lag of five years or an enhancement of 5 years.
So true, 2035 is very possible. As will be 2045.
Leif: I took a look at the Harder paper to see if it really says the opposite of what the SOD claims, and Harder’s abstract does seems to confirm your interpretation, that in his examination of the SOURCE data, wavelengths above a certain energy level rise rather than fall when solar activity declines:
Higher brightness temperatures mean shorter wavelengths, right? So he seems to be saying that there is less radiation at the shortest wavelengths when solar activity declines (a downward rather than upward uv-shift, at least for wavelengths at a high enough energy level).
But the paper goes on to present the opposite relationship between brightness temperature and wavelength. Don’t know how it all works, but he has a graph (figure 2) that shows wavelengths as getting longer as brightness temperature goes up, and his graphs of how radiation in individual wavelength ranges changed between 2004 and 2007 as solar activity declined shows that that in all uv ranges (figures 1b and 1c), radiation did decline.
The paper doesn’t actually seem to be saying anything about this uv shift being larger or smaller than expected, so I really don’t know what the SOD is talking about. (Maybe Harder just reported the data and OTHER people then noted that the uv-shift was much larger than expected. It would make sense for the SOD to still attribute this finding Harder. Or maybe there is as second Harder 2009 that notes the unexpected size of the shift.)
The abstract of the linked Harder paper just takes AR4 to task for looking at TSI variation without taking into account the effects of spectral shift. I think AR4 did discuss spectral shift, but that’s not the same thing as taking it into account. Here Harder is correct, the “consensus” computer models used in both AR4 and the draft AR5 only take TSI variation into account. As the Harder-mentioning paragraph notes (SOD p. 11-57), no RF effects from spectral shift are included in the models cited by AR5.
Can anyone explain how higher brightness temperatures can correspond to longer wavelengths in the Harder paper? Sure seems backwards to me.
lgl says:
December 31, 2012 at 12:58 pm
Maybe there isn’t a power maximum but there is a energy maximum. The oceans make that an important distinction.
apart from the nonsense above not being power but energy, the oceans do not determine if the Sun has a MGM. The ‘Running Sum’ [where each data point is the sum of the 156 years before it] looks like this http://www.leif.org/research/The-Running-Sum.png
Happy New Year, Leif!
I do not have any experience that could merit any meaningful scientific contribution, but, whilst many may disagree, I do appreciate your fortitude and resilience. Now’t ever wrong in making people think, especially as it provides us all with the opportunity to do the same.
Also Happy New Year to all who contribute, I find this subject amazing and bewildering, thank you for allowing me to be “caveat emptor”
Alec Rawls says:
December 31, 2012 at 1:35 pm
so I really don’t know what the SOD is talking about
The whole Harder affair is misinterpretation upon misinterpretation by many people [including Harder :-)]. First there is the question about calibration of the data [the spectral irradiance is much harder [no pun intended] to measure because when you split the whole spectrum into many small bins there are fewer photons in each bin and noise and difficulty explodes], then there is the question about if the Harder ‘effect’ is unique for the time over which it was measured or is a general feature of every cycle. The jury is still out, so one shouldn’t hang too much on this.
There is also confusion about what people think of as ‘variability’. Is that of level or of fluctuations?
My take on it is that what Harder is trying to say is that he finds that there is less UV but more Visible and Infrared in the Total, than what people thought. The deficit UV and the excess Visible+IR cancelling out so that total TSI is less variable that its parts. But this is not a ‘fact’ yet as more data is needed to decide the issue conclusively.
HenryP
big difference
Don’t think so. From the link Green Sand kindly provided max and mean for the UK are virtually identical (shape of course) and the long term trends are clearly set by the cloud cover.
http://virakkraft.com/max-mean-sunshine-UK.png
Is it possible to generate a solar modulation index without using sunspots at all? Shapiro et al. 2011 calibrate the 10be record using both sunspots and neutron counts, but it seems they might be able to do it using just the neutron counts. From their paper (via WUWT):
Is that enough overlap to get a decent calibration? What are the results when only neutrons are used (how does the modern era, post 1930) look compared to earlier solar levels?
Final thought from 2012:
Does solar magnetic cycle drive the oceans SST ?
http://www.vukcevic.talktalk.net/SSNvsCOS.htm
Graph compares the AMO (N. Atlantic SST) with:
– Geosolar cycle obtained by using sunspot magnetic cycle (blue curve)
– quasi ‘Geosolar’ cycle obtained by using simple Cosine instead sunspot magnetic cycle (green curve)
Happy New Year to all.
henry@lgl
Certain countries, i.e. Holland, England, USA east coast etc. go into a warmer mode due to being at the receiving end of the increase in clouds caused by the cooling period. It is the GH effect, you know…
http://blogs.24.com/henryp/2012/10/02/best-sine-wave-fit-for-the-drop-in-global-maximum-temperatures/#comment-198
Alec Rawls says:
December 31, 2012 at 2:27 pm
Is it possible to generate a solar modulation index without using sunspots at all?
Yes and no. The main problem using cosmic rays is that we measure in ice cores depends on weather and climate too, and we don’t know how to separate that dependence from a true solar dependence. The GCR proxies show a very strong modulation during the Maunder Minimum [slide 28 of http://www.leif.org/research/Solar%20Wind%20During%20the%20Maunder%20Minimum.pdf
What that means is unclear. My own take is that the solar dynamo was still going strong and the heliosphere and solar wind was not much different from today. Why we couldn’t see the spots is the puzzle [that may have a solution].
Is that enough overlap to get a decent calibration? What are the results when only neutrons are used (how does the modern era, post 1930) look compared to earlier solar levels?
There is not enough for as decent calibration. Me have muon data 1935-1956 and neutron data from 1952 on, but the muon data [‘ion-chamber data] does not have an absolute calibration and there is controversy about how to ‘splice’ the two series together. This is, in fact, one of the main [still unresolved] issues of the ISSI 233 workshop that I’m leading http://www.leif.org/research/Svalgaard_ISSI_Proposal_Base.pdf
See also slide 47.
P.S. About Harder, Slide 3 of http://www.leif.org/research/The%20long-term%20variation%20of%20solar%20activity.pdf shows one modeller’s view of the situation: UV has an upwards trend while Visible has a downward trend, while Infrared has no trend. Really just shows the confusion. In any case the temperature changes predicted as minute.
Alec Rawls says:
December 31, 2012 at 2:27 pm
Is it possible to generate a solar modulation index without using sunspots at all?
My cryptic reference to ‘slide 47’ should be ‘see also slide 43-47 of’:
http://www.leif.org/research/Solar%20Wind%20During%20the%20Maunder%20Minimum.pdf
Thanks for showing the MGM Leif
If you use the Steinhilber data and go back to say 1500 you will see it dropping all the way, congratulations. And the ocean determine that power over time is the important parameter, not the instant power. x watts does not tell you how much 1 liter of water will warm. x watts for y seconds will. Shouldn’t be that difficult to understand.
lgl says:
December 31, 2012 at 2:55 pm
Thanks for showing the MGM
It takes a real believer to think that the plot shows a MGM, but then you are one.
And again: the oceans do not determine if the Sun has a MGM.
Your power/energy thing is misleading. If the integration [summation] interval is constant there is strict proportionality between power and energy with the number of seconds being the proportionality constant. So, the power and energy vary exactly the same way. Shouldn’t be that difficult to understand.
About Steinhilber: we do not have a good calibration of the GCR flux. The fluctuations called Maunder, Dalton, etc minima are likely to a large degree determined by the climate rather than the Sun, but go on dreaming…
lsvalgaard says:
December 31, 2012 at 3:05 pm
About Steinhilber: we do not have a good calibration of the GCR flux. The fluctuations called Maunder, Dalton, etc minima are likely to a large degree determined by the climate rather than the Sun, but go on dreaming…
http://arxiv.org/ftp/arxiv/papers/1004/1004.2675.pdf
“We have made other tests of the correspondence between the 10Be predictions and the ice core
measurements which lead to the same conclusion, namely that other influences on the ice core measurements, as large as or larger than the production changes themselves, are occurring. These influences could be climatic or instrumentally based”
As I have said before, it is the shift within TSI that causes the warming and cooling periods each of 44 years. The spectrum of water should also be looked at again, to see exactly where in the UV band it absorbs.
Anyway, it is new year here. . wishing you all God’s richest wisdom for 2013.
By the way, a negative PDO explains the slight cooling between ~1945-1975, countering the effect of concurrent high solar activity.
The subsequent jump in warming between ~1978-1998 co-incided with a positive PDO between about ~1970-2000, with concurrent high solar activity, so Nuccitelli’s comment that the jump in warming in the late 20th century “doesnt make sense” based on solar trends shows he simply doesn’t understand the effect of the PDO COUPLED with solar activity throughout the 20th century to explain the temperature trends, and mostly because he isn’t looking at natural variability in any depth in the first place.
Also, the flat temperature since ~2000 also neatly fits in with a negative PDO, and with the sun’s high activity now waning, and the solar heat lag after 1996 probably close to being reached by now, the earth’s temperature might well drop between now and ~2035, before the next positive PDO (and the small effect from C02), meaning the IPCC’s models will become more and more laughable.
Wonder what the alarmists will do if the earth doesn’t warm in the next 20 years?, go back to their day jobs I expect. It will take some truly Enron style accounting from the alarmists to explain away things if the earth doesn’t warm in the next 20 years.
thingadonta:
http://climaterealists.com/index.php?id=1302
“The Real Link Between Solar Energy, Ocean Cycles and Global Temperature”
And note the link to Alec’s article of around the same time:
http://errortheory.blogspot.co.uk/2008/04/ocean-oscillations-are-not-masking.html