
Guest post by Alec Rawls
When he argues that a reduction in forcing will cause cooling Dana Nuccitelli is not actually talking about drinking. He is talking about the solar forcing of global temperature, but the drinking analogy is a handy way to understand where his argument goes off the rails.
Mr. Nuccitelli, who blogs for the consensus-approved Skeptical Science website, was writing about Henrik Svensmark’s GCR-cloud theory of indirect solar forcing, where Galactic Cosmic Rays are hypothesized to seed cloud formation. If Svensmark is right then a strong solar wind, by deflecting some GCR from reaching the earth, in-effect blows some of the clouds away, letting more sunlight through to warm the planet’s surface.
That can’t possibly explain late 20th century warming says Nuccitelli, because GCR deflection has been estimated (see the Krivova-Solanki graph above) to have peaked by 1980. The raw data suggests the actual GCR minimum was ten years later, but set that aside. Nuccitelli thinks it is the change in the level of forcing, not the level of forcing, that determines whether the climate system warms or cools:
So, if GCRs really do amplify the solar influence on global temperatures, since 1980 they are amplifying a cooling effect.
Cooling begins when a forcing passes its peak? Fail. Daily temperatures don’t start falling at noon. They continue rising until mid-afternoon. The hottest time of the year isn’t the first day of summer (the summer solstice, after which the days start getting shorter), the hottest time is mid-summer. To think cooling should start when forcing passes its peak is like thinking you can sober up by drinking just a little more slowly.
Here’s a tip for Dana to keep in mind on New Year’s eve: it is the level of alcohol forcing that matters. If you are drinking alcohol faster than you body is excreting it (not exactly the way the earth excretes heat, but similar enough), then your blood alcohol is rising. You are getting drunker, even if you have lowered the rate of your drinking! That’s right, putting a little less rum in your egg nog will not sober you up! Your increasing inebriation will just be a little less rapid, and it is the same for solar forcing.
When the peak level of forcing appears in the rearview mirror, the downward trend in the forcing that begins at that point does not cause cooling. It just causes warming to be a little less rapid. Only when the energy pouring into the climate system falls to the level of the energy escaping back out does the system stop warming. Empirically, that turns out to be mid-afternoon, mid-summer, and approximately the first decade of the 21st century.
Three blind mice
Dana Nuccitelli produced one of three widely cited rebuttals to my suggestion that a new sentence that was added to the Second Order Draft of AR5, a sentence that admits strong evidence for some substantial mechanism of solar amplification, is a “game changer.” That admission is on page 7-43 of the SOD:
Many empirical relationships have been reported between GCR or cosmogenic isotope archives and some aspects of the climate system … The forcing from changes in total solar irradiance alone does not seem to account for these observations, implying the existence of an amplifying mechanism such as the hypothesized GCR-cloud link.
That’s a game changer because the only solar forcing included in the IPCC computer models is the very slight variance in solar irradiance (also known as TSI, or “the solar constant”). If there are other solar forcings in play, working through variables that actually vary substantially as solar activity ramps up and down, that kills the report’s key finding (on page 8-4) that we can have “very high confidence that natural forcing is a small fraction of the anthropogenic forcing.”
The two most widely cited rebuttals, which I answered last week, were both by lead authors from the IPCC. Steven Sherwood, one of 15 lead authors of chapter 7, pretended that the admission of evidence for “an amplifying mechanism” was only about GCR-cloud. He then proceeded to claim that the evidence for GCR-cloud points to a weak mechanism, and used that as a grounds for dismissing the idea that any substantial solar forcing beyond TSI could be at work.
Doesn’t follow. The evidence for “an amplifying mechanism” (emphasis added) is entirely separate from the evidence for the GCR-cloud mechanism. The former is paleo evidence, where numerous studies of the geologic record have found strong correlations between solar activity and climate going back many thousands of years. The evidence for the GCR-cloud mechanism is from cloud-chamber experiments and ongoing observations of cloud micro-physics.
It doesn’t matter how unconvinced Sherwood is by the evidence for the GCR-cloud mechanism. That evidence does nothing to counter the paleo evidence, cited in the draft report, that some mechanism of enhanced solar forcing must be at work. By using his discontent with the GCR-cloud theory as an excuse to dismiss the paleo evidence, Sherwood is inverting the scientific method, and he is lying to the public about what the report says, making him a seriously bad guy.
Apparently weak minds think alike because Nuccitelli did the same thing Sherwood did, only a day earlier. Dana’s post only looks at the GCR-cloud mechanism and completely ignores the draft report’s admission of strong evidence for some mechanism of solar amplification. It is in the context of that more fundamental mistake that Nuccitelli goes on to completely misinterpret the evidence for the GCR-cloud mechanism itself, claiming that anything less than peak forcing causes cooling, arguing in-effect that he can sober up by drinking a little slower. Just tell that to the officer Dana. He won’t even need to give you a breathalyzer.
More evidence that weak minds think alike is the second semi-official rebuttal to my “game change” claim, issued by Joanna Haigh, a lead author of the IPCC’s third report. Haigh proceeds on the same dishonest pretence as Sherwood, telling NewScientist magazine that the new sentence in the draft report is only about GCR-cloud, which she then dismisses with the same drinking-game mistake that Dana makes, claiming that if climate were being driven by solar activity then the planet would have started cooling when solar activity was at its peak:
Haigh points out that the sun actually began dimming slightly in the mid-1980s, if we take an average over its 11-year cycle, so fewer GCRs should have been deflected from Earth and more Earth-cooling clouds should have formed. “If there were some way cosmic rays could be causing global climate change, it should have started getting colder after 1985.”
Sober up Joanna. Have a single shot instead of a double. Works every time.
Which theory has more trouble with flat 21st century temperatures?
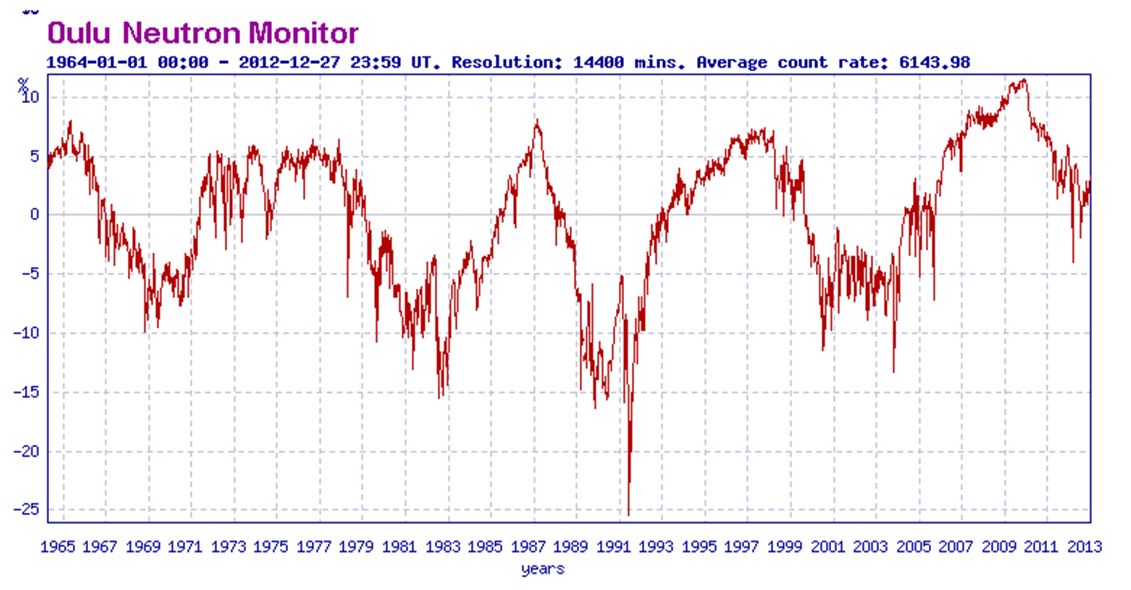
It is amusing how Dana Nuccitelli, through sheer incompetence, was able to prefigure the highly credentialed malfeasance of both of these IPCC fraudsters. Still, Nuccitelli has to be credited with at least a bit of misfeasance of his own because he wasn’t satisfied with just assuring his gullible readers that cooling commences when forcing is at its peak. That only supplied an excuse for dismissing a solar explanation for late 20th century warming, leaving the conspicuous lack of 21st century warming still to be dealt with. Dana’s solution? Pretend that the flat 21st century temperature record militates against a solar driver of climate:
In fact, GCRs reaching Earth recently hit record high levels (Figure 4), yet temperatures are still way up.
Temperatures have merely flattened out, they haven’t gone down yet, and no Skeptical Science reader will ever learn that this is just what the discovered correlations between solar activity and climate predict. The strongest temperature response to a change in solar forcing is seen with a lag of about ten years (Usoskin et al. 2005), or one solar cycle (Solheim et al. 2012). The theory that is discomfited by flat 21st century temperatures is the CO2-warming theory, which predicts ever more rapidly increasing temperatures.
Dana might actually think that the flat 21st century temperature record causes trouble for the solar-warming theory but there is no way he can think it causes less trouble for the CO2-warming theory. For him to pretend that 21st century temperatures favor the CO2-warming theory is inexcusably dishonest, but as usual, the professionals are even worse. Note this little gem from the SOD (p. 7-44):
The lack of trend in the cosmic ray intensity over the last 50 years (Agee et al., 2012; McCracken and Beer, 2007) provides another strong argument against the hypothesis of a major contribution of cosmic rays to ongoing climate change.
That’s 15 IPCC lead authors all accepting the crackpot idea that you can only get drunk if your rate of drinking is going up. Steady exposure to the high 1950’s level of solar activity will keep you from warming, just as steady swilling of a high level of booze will keep you stone-cold sober. But where Dana only said that “temperatures are still way up” (implicitly acknowledging that they are no longer going up), the draft report here claims that temperatures are still going up (“ongoing climate change”).
Must be a Steven Sherwood sentence. He needs to look at page 10-3 of the SOD (emphasis added):
While the trend in global mean temperature since 1998 is not significantly different from zero, it is also consistent with natural variability superposed on the long-term anthropogenic warming trends projected by climate models.
Note that the “consistent with natural variability” part is a near call, after NOAA admitted in 2008 that 15 years of no warming would falsify current models. But yeah, let’s pretend it is the solar theory that has trouble with the lack of recent warming.
The Guardian, Andrew Sullivan, DeSmog, Romm etcetera, all pwned by Dana Nuccitelli’s error-filled AR5 post
The ensuing Skeptical Science newsletter bragged about how many eco-propagandists picked up on nutty Nuccitelli’s non-stop nonsense and the list is indeed impressive, a glaring testament to the total absence of due diligence on the part of these “journalists,” none of whom thought to question Dana’s advice on how to sober up quick. Here is the SkS tally of eco-scalps:
This was a very big week for SkS in the news. Dana’s IPCC Draft Report Leaked, Shows Global Warming is NOT Due to the Sun was re-posted and/or linked to by The Guardian, New York Times Green, New York Times Dot Earth, Huffington Post, Climate Progress, Mother Jones, Climate Crocks, Carbon Brief, Grist, Daily Beast, DeSmogBlog, Graham Readfearn, Der Spiegel, Maribo, Learn from Nature, Alternative Energy in the 21st Century, and Motherboard. It was also Tweeted by Michael Mann and Chris Mooney, among many others.
The only “consensus” journalist on this list who showed any integrity was Andrew Revkin, who had already written a post on my leak of the draft report. After updating that post with a link to Nuccitelli, Revkin updated again later with a link to the rebuttal that Jo Nova and I wrote about Seven Sherwood. Thanks Andrew, for being an actual journalist.
To put their “big week” in perspective the folks at Credulous Science reached high for sufficient words:
Winston Churchill once said: “A lie gets halfway around the world before the truth has a chance to get its pants on.” Not this time; we got the truth’s pants on in record time and nipped this myth in the bud before the contrarians were able to misinform the public.
The “truth” in their rendering is whatever patent falsehoods can be used to fool the ignorant into thinking they should fear CO2. No, nutty ones. You did not forge an exception to Churchill’s dictum. You provided a textbook example of it.
Dana is a poster child for those who feel a moral imperative to “believe the scientists”
For the last two years I have had a lot of fun exposing the large number of top climate scientists who claim that it is not the level of forcing that causes warming, but the trend in the forcing. They are all looking at the wrong derivative (one instead of zero).
Given the enormous pressure on the eco-left to accept what these government-funded climatologists are saying it is not surprising that someone like Dana Nuccitelli would swallow the idea that temperature really is driven by the trend in the forcing, and one super-wacky segment in Dana’s post indicates that he really is accepting that this is how physics works. If you leave a pot of water on a steady flame it won’t heat. If you want to heat the water you have to keep turning the flame up. The segment is titled, “Physical Reality Intrudes on Rawls”:
Rawls has argued to the contrary by claiming that the climate is still responding to the increase in solar activity from the early 20th century, and that GCRs are amplifying that solar warming from over 60 years ago. This argument is simply physically wrong. As Figure 2 illustrates, when solar activity rises, temperatures follow suit very soon thereafter. In fact, during the mid-20th century, solar activity and global surface temperatures both flattened out. Are we to believe that the planet suddenly began responding to the pre-1950 solar activity increase in 1975—2012, after not warming 1940—1975? The argument makes no physical sense.
Obviously I never said that late 20th century warming was caused by solar activity from the early 20th century and Dana does not give a citation for what argument of mine he is referring to but its easy to figure out. I have argued many times that if one combines the strong paleo correlations between solar activity and climate with the fact that solar activity was at what Ilya Usoskin calls “grand maximum” levels from 1920 to 2000 then it is certainly plausible that much of 20th century warming, including late 20th century warming, could have been caused by the sun. 80 years of a high level of enhanced solar forcing just might warm the place up a bit (and it only did warm a bit, about 0.8 °C over the century).
If I am attributing late 20th century warming to the high solar activity that persisted through 2000, why does Dana think I am attributing it to solar forcings from 60 years earlier? He must be fixed on the idea that only a change in the level of solar forcing can cause warming. That’s what all of these top scientists have been telling everyone and there was no rise in solar activity after 1950, hence any solar-caused warming would have to stem from the pre-1950 rise in solar activity.
But come on Dana. That is not what I am saying. That is what they are saying, and I have been trying my darnedest to expose it as a blatant misrepresentation. I’m not attributing late 20th century warming to the pre-1950 rise in solar activity. I’m attributing it to the fact that solar activity remained at close to the same high 1950’s level until 2000 (or 2003). It is the level of the forcing that causes warming, not the trend in the forcing.
I have to feel bad for Dana on this point. It isn’t his fault. He has been systematically duped by this parade of so-called scientists all telling him that a persistent high level of forcing can’t cause continued warming. Makes me want to put him on a milk carton. The poor guy isn’t just lost, he was kidnapped. Want a piece of candy little boy? Credulous Science indeed.
Andrejs Vanags says:
December 30, 2012 at 12:16 pm
Dr. Svalgaard, I am deeply disturbed by the approach taken in the above report to correct older observations (for example by multiplying them by 1.2, page 8) to bring them in line with modern observations . Please do NOT do that. Unfortunately the same approach seems to be taken on the aa index as well.
In both cases there are very good reasons for doing so.
Why don’t you do the little exercise I suggested and convince yourself:
In case of the sunspots it is dead-easy to convince oneself what the problem is. Take any drawing from Locarno http://www.specola.ch/e/drawings.html e.g. from yesterday http://www.specola.ch/drawings/2012/loc-d20121229.JPG or made by Sergio Cortesi [observer since 1957]http://www.specola.ch/drawings/2012/loc-d20121105.JPG
Simply count the spots and compare with the official counts given in the upper right. A counting rule: if there are several black spots within the gray penumbra, count each spot.
It seems that the whiners have gone quiet on this. As I mentioned to Gail: don’t be like the people who refused to look through Galileo’s telescope.
You can also try to count and report your result here for the two cases.
Also this specific correction does not makes no sense. During a period of ~60 years (a small time period) the ‘Waldmeier’ method was used, which recently it was dropped and they are back to using the old method.
No, they are not back to the old method. All sunspot numbers are normalized to the Locarno station which still uses the Waldmeier counting. The people at SIDC in Brussels agree with this.
And the approach you propose is to modify the entire record prior to 1950 and post ~2000 to match that small segment? In my opinion it would be much better to correct that Waldmeier anomaly of 1950-2000 rather than the entire record.
This was considered but met with resistance from operational users who would then be forced to change their programs. So we have no choice in the matter.
What about when even better telescopes come around? will the entire data set need to be re-corrected?
By design sunspots are still counted with [or reduced to ] small telescopes [and will always be – by design].
This goes to the point that lost information cannot be recreated, but new information can always be removed. For example if it is desired to account for the effects of going from the Wolf 37 mmx20 telescope to the Wolfer 80mmx64 (or a more modern telescope) I could envision that it would be easy and simple to create a filter that would reduce the fidelity of the more modern image to the older one, and then count the spots as it would have been done then.
Even better, since both old telescopes still exist we can [and do] simply count using them as well [as controls].
Regarding your point (I’m paraphrasing) that the sun does not influence climate as there has been no ‘grand maximum’, nor a long term trend for 300 years, that simply doesn’t make sense.
But that is what the data shows. As solar activity has not shown any trend, but climate has, what is one to conclude?
Besides… why stop at 1710? (300 hundred years ago) why not go back to 1600? the long term trend would certainly change then.
Because there is very little good data before 1710. A goal of the 4th SSN workshop is to re-examine what exists before 1750. There are attempts to reconstruct solar activity back to the Maunder Minimum. Much evidence favor the view that activity back then was very similar to what we saw at the latest solar minimum in 2008-2009.
Ulric Lyons says:
December 30, 2012 at 12:22 pm
Leif disappears Maunder from the temperature record http://www.leif.org/research/Global-Temp-TSI-Since-1600.png
To be blunt: you are lying or deceiving or worse. Look again. And apologize.
John F. Hultquist says:
December 30, 2012 at 12:36 pm
The international effort toward corrections make sense to me. So, not a problem for me. I was wondering why others think this should not be done.
Your comment was not misleading. But why don’t you do the little exercise I suggested and convince yourself:
In case of the sunspots it is dead-easy to convince oneself what the problem is. Take any drawing from Locarno http://www.specola.ch/e/drawings.html e.g. from yesterday http://www.specola.ch/drawings/2012/loc-d20121229.JPG or made by Sergio Cortesi [observer since 1957]http://www.specola.ch/drawings/2012/loc-d20121105.JPG
Simply count the spots and compare with the official counts given in the upper right. A counting rule: if there are several black spots within the gray penumbra, count each spot.
It seems that the whiners have gone quiet on this. As I mentioned to Gail: don’t be like the people who refused to look through Galileo’s telescope.
John – You can also try to count and report your result here for the two cases.
=====
To everyone who whines about this: Do the count yourself and report back what you find.
For the lazy souls who won’t copy-paste into their browser:
from yesterday http://www.specola.ch/drawings/2012/loc-d20121229.JPG or made by Sergio Cortesi [observer since 1957] http://www.specola.ch/drawings/2012/loc-d20121105.JPG
Andrejs Vanags says:
December 30, 2012 at 12:16 pm
In general a lack of long term trend does not imply a lack of local modulation
My point is that the data shows that the sun is not the major driver of climate. That the sun causes small [of the order of a tenth of a degree] fluctuations is clear from the outset [as TSI varies enough to cause that – of course, there those who deny that TSI has anything to do with the climate : too bad for them]. Some of the dips in temperature [e.g. around 1815] are due to volcanoes, so local fluctuations are clearly possible.
lsvalgaard said:
“To be blunt: you are lying or deceiving or worse. Look again. And apologize.”
It shows a dip for Dalton and sails through Maunder as if it did not exist, its junk,
http://www.leif.org/research/Global-Temp-TSI-Since-1600.png
lsvalgaard says:
December 30, 2012 at 1:15 pm
For the lazy souls who won’t copy-paste into their browser:
from yesterday http://www.specola.ch/drawings/2012/loc-d20121229.JPG or made by Sergio Cortesi [observer since 1957] http://www.specola.ch/drawings/2012/loc-d20121105.JPG
Not a single one has dared do this [it only takes two minutes], so there must be great fear for what the result might turn out to be. That is ostrich-science.
I’ve made a layman’s count, using the drawings from Locarno Monti, without looking at any official count, so it is close to double blind.
Here are my numbers. I’ve never counted spots off drawings before, so I have no idea if I did it correctly or not.
Cagnotti drawing http://www.specola.ch/drawings/2012/loc-d20121229.JPG 12 spots
Cortesi drawing http://www.specola.ch/drawings/2012/loc-d20121105.JPG 6 spots
Paul Vaughan says:
December 30, 2012 at 3:42 am
I’m with you Paul – sometimes Leifs attitude is somewhat perplexing. Anyways – I don’t care if I’m shown to be wrong – I still consider that solar energy must be the primary climate driver (over and above the other orbital variations, etc). To me it is simple physics, ignoring any so called GHG effect, for equilibrium energy in= energy out; and any subtle changes in input will take years/decades/centuries to be ‘seen’ based on the massive heatsink that we call ‘earth’ and its ‘non-static’ (i.e. ‘shifting’) biosphere.
The anti-sun guys want us to believe that the aerodynamic efficiency of a car travelling for billions of miles doesn’t get affected by a single bug on the windshield – but in practise, they forget that there are millions of bugs arriving over a period of time! Not a great analogy, but it serves a purpose – a splatted bug doesn’t cause a great deal of aerodynamic efficiency loss – but a whole load of ’em does!
regards
Kev (also B.Sc,M.Sc!)
I’m sure most five year olds on the planet could point to roughly where the colder periods are through this graph:
http://www.leif.org/research/Ap-1844-now.png
Our “expert” only sees the trend.
Andrejs Vanags says:
December 30, 2012 at 12:16 pm
During a period of ~60 years (a small time period) the ‘Waldmeier’ method was used, which recently it was dropped and they are back to using the old method.
Before making statements like that, better check out the facts first [in lieu of you doing that, you may rely on me having done it]. Slides 19 and 20 of http://www.leif.org/research/SSN/Clette4.pdf shows that Locarno [which still uses the Waldmeier method – and they should continue to do so] is still the central reference point for the modern series.
Ulric Lyons says:
December 30, 2012 at 1:45 pm
Our “expert” only sees the trend.
The trend is called climate change…
Kev-in-Uk says:
December 30, 2012 at 1:41 pm
but in practise, they forget that there are millions of bugs arriving over a period of time! Not a great analogy
As you are aware, it is a bad analogy. The Earth radiates away the energy it receives. To stay in your analogy, the windshield is cleaned continuously.
lsvalgaard says:
December 30, 2012 at 2:38 pm
Perhaps – but what if the cleaning is intermittent? Can you demonstrate otherwise? – I think not!
“The trend is called climate change…”
Quite so. The recovery from the Maunder Minimum when the climate was colder.
I don’t see any problem with Leif’s adjusted graphs.
It seems clear that the level of solar activity has been higher than that required for system equilibrium ever since 1700 or so and ever since then the temperature has slowly risen as the oceans accumulated more energy.
The cause would have been a more positive AO and AAO than during the Maunder with poleward zonal jets, wider subtropical high pressure cells with less clouds and more sunlight into the oceans.
There have been pauses or falls such as the Dalton Minimum and the late 19th century and the mid 20th century and each of them was accompanied by a drop in solar activity as per Leif’s work.
I imagine the charts would have looked much the same from the Dark Ages to the MWP.
Note that exact correlation cannot be expected due to the Pacific Multidecadal Oscillation of 60 years or so offsetting or supplementing the solar effect from time to time.
If there is a visible correlation with climate change (and there certainly is) even after all Leif’s efforts then we should regard him as having proved our point.
I do not feel that Leif has succeeded in his avowed intent to detach solar activity from climate changes.
It is notoriously hard to prove a negative is it not ?
lsvalgaard says: do an exercise
I doubt that I have done the exercise as you envisioned, although that doesn’t matter as explained below.
Figure 237: 2012.XI.5.375
(Don’t know what the XI or last numbers are supposed to tell me)
g = 4, which seems to be the number of fuzzies counted
286, 288, 289 all somewhat similar but not exactly; all counted as 3 each
287 the left and right members are similar to 286; center member may be in the middle of a smudge, but I can’t tell, so either that gets a 2 and the others each 3; or they get 3.5 and the middle one gets a 1.
So this image has a count of 17.
Figure 278: 2012.XII.29.375
g=5,
330 gets a 1
333 seems to get a 1 for the left most dot and then ½ + ½ : total = 2
326 is oval and a bit larger than 330; give 326 a 2
331 seems to have 1 + 2+ 3 = 6
but the numbers 0.5, 1.5 & 4 = 6 also
332 left =3, bottom = 3, top = 1, right = 2
So this image has a count of 20.
So, never having counted sun spots before and having no idea what the rules are, all I am convinced of is that those doing the counting should be doing the same thing in the same way, time after time, and the rules and training should be such that this is possible. Was I expected to just count dots on my screen without regard to size or proximity to other dots or whether or not they are surrounded by the gray penumbra? Sure, that would have convinced me that I had not counted in the same way as someone else. I’ve known that since I read about this issue – probably via a comment or post from you sometime since winter of 2008 when we got a fast internet connection.
So, back to my original point. I expect solar researchers such as yourself and others to provide an appropriate data set. Further, I trust you to do that and explain it all. I do not understand why anyone objects to this.
lsvalgaard says:
December 29, 2012 at 4:57 pm
I’m not claiming certainty about, but you seem to be. It can’t be X. It can’t be Y.
If the data does not support Z, it can’t be Z. Here, I spared you the work:
http://www.leif.org/research/Global-Temp-TSI-Since-1600.png
————————————-
Try a higher quality temperature data set and use 200 years smoothing to allow for shorter time scale natural oscillations.
http://www.science-skeptical.de/wp-content/uploads/2011/08/Comnispa-und-Kosmische-Strahlung.jpg
lsvalgaard says:
December 30, 2012 at 2:38 pm
Sorry – I was being brief in my previous response – in essence, of course the earth radiates away energy it receives – hence the imaginary ‘equilibrium’. No argument there! The question arises as to how long any ‘equilibrium’ takes to establish – and, being somewhat simplistic, taking the OHC as a start point – how long does it take for a few gazzilions of cubic metres of water to heat up and cool down?
Taking the ice core records ‘as read’; we see massive swings in earths temperatures, with various ‘flat’ sections (interglacials) in between showing slight uppy/downy bits! Which parts of these known temperature variations do you suppose indicate the alleged EQUILIBRIUM state? (it matters not your answer!) The glaring fact is simple – there is no fecking ‘real’ equilibrium state! (though I suppose you could take a median position just for fun!?)
On the reasonable assumption that the earths internal heat content is ‘fixed’ (to all intent and purpose) the ONLY thing that can have changed is the rate of external energy radiation OR the rate of incoming radiation – QED – there is no in between state (other than saying both are varying independently and in a cyclic fashion!)
Given that we have never ‘stayed’ in an ice age – or indeed, ‘stayed’ in an interglacial – and working on the reasonable assumption that geothermal/volcanic type heat generation is fairly constant (i.e. as a fairly permanent ‘flux’ from the long term (4.6 billion years) ‘cooling’ earth) – we are left with only incoming radiation change or biospherically based ‘rate of emission’ changes as the direct causes of energy imbalance. Yes?
Now; given that we can only really have these two primary variables – and we take the assumption that solar is indeed FIXED – we are left with the somewhat worrying conclusion that the earth suddenly decides to reflect radiation all on its ownsome – without any external input whatsoever. Equally perverse, sometime after this cool phase, the earth suddenly decides its a wee bit chilly, removes the clouds, etc, and warms up again! Gosh, that’s damned convenient isn’t it!? – the earth doing that as a massive self regulating biosphere? – whilst all the time accepting a CONSTANT energy flux from the sun?! Sorry, but that simply doesn’t compute – something must change in the meantime..
Now – come on Leif – I know full well that you are an intelligent bloke – and I accept that indeed the sun’s output may indeed be fairly ‘regular’ – but don’t you think that earth is ‘more likely’ (to use IPCC speak) to be affected by solar variation than internal variation? To me, it is logical, because otherwise we would have had an earth that boiled dry, or ended up as a permanent snowball! Of course, I am not disputing all the other past effects, past Co2 concentrations, vulcanicity etc, but the fundemental basis of energy in = energy out, remains – and there is no reason to assume that the earth ‘self performs’ the temperature swings observed!
As an aside, for those knowledgeable in the logic method – if the earth has all these positive and negative climatic feedbacks in place – why the flip would it ever ‘bug out’ of the normal range? which brings me conventiently to the next point, which is what IS the NORMAL range? – because, sure as eggs are eggs, the normal range is UNLIKELY to be illustrated by current temperatures!
No, sorry, Leif – much as I’d like to believe that the earth is an isolated, insulated body floating in space without external influence – it just ain’t so. Whether its partly simple solar irradiance, partly CGR;s, geomagnetic fluxes, solar winds, HUV, etc, etc – it doesn’t matter a toss! – these effects all amount to the same thing – a change in the incoming/outgoing energy equation and it is THEY that cause a subsequent change in the earths climate. You can piss about all you want trying to say it’s some other ’cause’ – but the NET effect must be a change in incoming energy vs outgoing energy!
Put another, more simple way, the day someone comes up with proof that the ice ages (and interglacials) were caused by biospheric or other ‘earthbound’ causes, is the day I will renounce solar as the main climate driver! Until then, it is the only logical derivation…
lsvalgaard says:
December 30, 2012 at 2:35 pm
“The trend is called climate change…”
That is way too simplistic, you are essentially implying that forcing would be directly proportional to Ap level, you don’t know that for sure. Anyway, there is no way for you to honestly deny the correlation between periods of low Ap and lower temperatures, or a lack of lows in Ap during warming periods, no matter what projections you lob my way: http://wattsupwiththat.com/2012/12/28/dana-nuccitellis-holiday-trick-for-sobering-up-quick-put-a-little-less-rum-in-your-egg-nog/#comment-1186104
Stephen Wilde says:
December 30, 2012 at 3:36 pm
“It seems clear that the level of solar activity has been higher than that required for system equilibrium ever since 1700 or so and ever since then the temperature has slowly risen as the oceans accumulated more energy.”
I can’t see that in CET from 1730 to 1930: http://snag.gy/2q2kT.jpg
I suppose I should add that to me – ‘solar variation’ encompasses all the reasons for incoming solar incident radiation variation, from orbital changes, milankovitch, solar wind, even lunar transits!,etc, etc – not simply, a direct ‘measure’ of the solar output – which we already know varies by at least 1.4 w/m2 from some poxy 30-40 years of direct measurement in anycase!
Ulric Lyons says:
December 30, 2012 at 1:37 pm
It shows a dip for Dalton and sails through Maunder as if it did not exist, its junk,
http://www.leif.org/research/Global-Temp-TSI-Since-1600.png
graph including Maunder Minimum Carbon-14 record for last 1,100 years (inverted scale). Solar activity events labeled.
This WIKI image is in the public domain because it contains materials that originally came from the United States Geological Survey, an agency of the United States Department of Interior. Source: http://pubs.usgs.gov/fs/fs-0095-00/
An article/paper of some interest.
A person after my own heart.
Anthony Watts says:
December 30, 2012 at 3:34 pm
Here are my numbers. I’ve never counted spots off drawings before, so I have no idea if I did it correctly or not.
Cagnotti drawing http://www.specola.ch/drawings/2012/loc-d20121229.JPG 12 spots
Cortesi drawing http://www.specola.ch/drawings/2012/loc-d20121105.JPG 6 spots
Anthony had the courage to actually count the spots.
Here are my counts:
2012/12/29 1 1 3 4 3 total 12; official 2 1 6 9 2 total 20;
2012/11/05 1 3 1 1 total 6; official 3 8 3 3 total 17;
For 2012: 6858; official 10841; ratio 10841/6858 = 1.58
So, the official count which is the basis for the official sunspot number is 58% higher than what the observers would have counted before ~1946 when they only counted each spot once, regardless of size.
John F. Hultquist says:
December 30, 2012 at 3:44 pm
So, never having counted sun spots before and having no idea what the rules are
You tried to emulate Waldmeier’s weighting scheme. I asked you simply to count the black dots. Every black dot is counted once. If there are 3 black dots, the count is three, etc.
Try again, please
I do not understand why anyone objects to this.
Because they don’t like the result, simple as that.
Manfred says:
December 30, 2012 at 3:50 pm
Now; given that we can only really have these two primary variables – and we take the assumption that solar is indeed FIXED – we are left with the somewhat worrying conclusion that the earth suddenly decides to reflect radiation all on its ownsome
Every complex enough system has random fluctuations.
there is no reason to assume that the earth ‘self performs’
And there is no reason to assume that the sun ‘self performs’. Of course, some would swear that the planets are doing it to the Sun. Yet another unknown mechanism is invoked.
Ulric Lyons says:
December 30, 2012 at 4:07 pm
That is way too simplistic, you are essentially implying that forcing would be directly proportional to Ap level, you don’t know that for sure.
What we do know for sure is that the Ap level is directly proportional to the product of the solar wind magnetic field and the square of the solar wind speed, and is directly proportional to the energy deposited in the Earth’s atmosphere by the solar wind.
Kev-in-Uk says:
December 30, 2012 at 4:24 pm
which we already know varies by at least 1.4 w/m2 from some proxy 30-40 years of direct measurement in any case!
Which will yield less than 0.1 degree heating.
Gail Combs says:
December 30, 2012 at 4:49 pm
We can never be sure of what future generations may pick up from an archive or a well maintained historical library, or on the contrary of what they may lose for ever if we are too casual in our support for the maintenance of records of all types.
The revision of the sunspot number relies heavily on archives and historical records. We urge that all original data be permanently kept and digitized, and have already gone a long way towards that.
A person after my own heart.
And yet you shy away from convincing yourself of the validity of the revision, in spite of the ease of such a test. You earn the right to criticize by performing the test and showing it fails.
Gail Combs:
We can never be sure of what future generations… may lose for ever if we are too casual in our support for the maintenance of records of all types.
Hear, hear! Starting with card catalogues, so I can find what I’m looking for.
: > )
Ulric Lyons says:
December 30, 2012 at 1:45 pm
I’m sure most five year olds on the planet could point to roughly where the colder periods are through this graph
To help your five-year old I have global temperatures since 1850 on the Ap-graph: http://www.leif.org/research/Comparison-Ap-Global-Temps-1850-2012.png
He will have a hard time finding any meaningful correlation:
http://www.leif.org/research/Correlation-Ap-Temp-Not.png
Gail Combs says:
December 30, 2012 at 4:49 pm
We can never be sure of what future generations may pick up from an archive or a well maintained historical library, or on the contrary of what they may lose for ever if we are too casual in our support for the maintenance of records of all types.
You are barking up the wrong tree.
From the original records we reconstruct composite time series as new data becomes available or when calibration errors are discovered. This is normal and important scientific practice. Especially when the correction is transparent, well-documented, and easily checked by anybody. Even you can contribute to that by performing the little test I suggested. Running away from it is no solution.
According to the graph above between 1880 and 1900 THE GLOBAL TEMPERATURE declined by 1/10th of one degree Celsius.
Really?
I strongly suggest that any rational person should try saying that first sentence out loud…as they say it, note the ‘dates’, the word ‘Global’ and the ‘1/10th of a degree’.
Then consider this, today the best scientists, with the latest equipment including satellites cannot agree on the global temperature to 1/10th of a degree…but hey they’ve got 1880 nailed…and the cosmic ray intensity in 1880 too…using proxies from ice core samples apparently….
And we’re arguing with them about this…sheesh!
Lief Svalgaard quoted me saying “the ‘Waldmeier’ method was used, which recently it was dropped and they are back to using the old method.” and said “Before making statements like that, better check out the facts first [in lieu of you doing that, you may rely on me having done it]”
Dr. Svalgaard, I made that comment based on your comment above that: “The problem starts in the 1940s when Waldmeier began to count larger spots more than once [up to five times dpending on size]. He even writes so specifically. The effect of that is a 20% increase of the sunspot number. When we noticed that a few years back, we began to ALSO count each spot only once as was done before 1945. Even the current observers on which the modern sunspots are based participated in the counting ”
Sorry if I misunderstood your comment. Although I am surprised that it was not widely know until recently how the weights were applied to the sun spot number count.
I dont get your challenge to count spots. Of course a weighted count will be different than a single count. That is not the point, the point is what to do about that difference, and I was objecting to ‘correcting’ all data prior to 1945. Specially since the ‘new’ weighted count method is more subjective (for example there is no guidance as to a weight of 4 vs. 5) it would not be so problematic if the single count was recorded as well, which I believe you have proposed and I hope it is carried forwards.
A far more interesting challenge would be to ask us to count the ‘groups’, for which the rules appear to be more subjective.
In any event..could you clarify something? I understand that the TSI (visible only) may not have changed much even during the solar minimums.. (low sun spot numbers) but is it your contention that all radiations from the sun (including UV) have been equally constant? Is it also your position that the GCR have stayed similarly constant? implying the TSI is a proxy for all of them?
Andrejs Vanags says:
December 30, 2012 at 9:11 pm
“When we noticed that a few years back, we began to ALSO count each spot only once as was done before 1945. Even the current observers on which the modern sunspots are based participated in the counting”
It was implied that we did this in parallel with the old method, of course.
Although I am surprised that it was not widely know until recently how the weights were applied to the sun spot number count.
Waldmeier was very secretive about this. He was [we believe] afraid somebody else would ‘scoop’ him and undermine his status as the ‘official’ counter. He was particular critical about the ‘American’ sunspot number which the US began during WWII because they needed real-time sunspot numbers for military purposes [prediction of communication blackouts].
I dont get your challenge to count spots. Of course a weighted count will be different than a single count.
This is what people seem not to understand. I want thrm to see this for themselves so there can be no doubt about this.
That is not the point, the point is what to do about that difference, and I was objecting to ‘correcting’ all data prior to 1945. Specially since the ‘new’ weighted count method is more subjective (for example there is no guidance as to a weight of 4 vs. 5) it would not be so problematic if the single count was recorded as well, which I believe you have proposed and I hope it is carried forwards.
There is precedent for this. Rudolf Wolf did the same in the 1870s when he discovered that the older values should be increased by 25% to compensate for the difference between Schwabe and Wolf. Furthermore, the US Air force objects to correcting the values after 1945, because the SSN is used in operational programs which the Air Force does not want to change [which is a potent argument]. So we have no choice in the matter. About abandoning the weighting and only use a single count we are of the firm opinion that it is better that Locarno continue the way they have been counting since 1957. We shall improve the homogeneity by adjusting the old values only.
A far more interesting challenge would be to ask us to count the ‘groups’, for which the rules appear to be more subjective.
The ‘group’ issue is indeed very important, but not what I was after. To re-iterate: I simply wanted people to convince themselves that weighting causes a problem and a discontinuity in the data. Once such a discontinuity is identified it seems obvious that it must be corrected. I’m amazed and puzzled by how some people cling to the idea of a sacrosanct ‘precious historical record’ as something which cannot be touched, even compare it to the GISS-adjusted temperatures as an attempt to support a personal theory or notion. The venom you can smell dripping from the fangs of such people is palpable. Perhaps their irrational resistance stems from the obvious consequence of the revision, namely that there is no Modern Grand Maximum to explain Global Warming.
is it your contention that all radiations from the sun (including UV) have been equally constant?
At minimum, yes, with the caveat that at some minima the activity may not have died away completely as the two cycles often overlap. If you correct for that, I think we get the same value for all variables. I came to that conclusion rather long ago http://www.leif.org/research/GC31B-0351-F2007.pdf even before I realized the problem with the sunspot number.
Is it also your position that the GCR have stayed similarly constant? implying the TSI is a proxy for all of them?
essentially yes, with the above caveat. Also, what people refer to as TSI reconstructions [before 1978] are really just that: TSI-values derived from other variables: sunspots, GCRs, geomagnetic activity, the lot.