
This isn’t the first time he has claimed punishment from on high is retribution for not seeing climate issues his way, readers may recall he blamed conservative states for bringing tornadoes upon themselves by not acting on the climate issues he and his fellow propagandist, Joe Romm were pushing at the time. Three scientists, Kevin Trenberth, Michael Mann, and Gavin Schmidt provided quotes to make that exercise in Tabloid Climatology™ complete.
Here’s his press release today, followed by a factual rebuttal. Bolding in the body of the PR is mine.
==========================================================
FOR IMMEDIATE RELEASE: October 26, 2012
CONTACT: Blair FitzGibbon : 202-503-6141 : blair@fitzgibbonmedia.com
Statement by Brad Johnson, campaign manager of Forecast the Facts and ClimateSilence.org:
“If the candidates won’t listen to the voters demanding they break their climate silence, maybe they will listen to Mother Nature’s October Surprise. We know the candidates will be asked about Hurricane Sandy, and will express their sympathy with those affected. They will rightly applaud the first responders, the compassion of neighbors, and the strength and resolve of the American people. But what their role as national leaders demands that they also do is explain that Hurricane Sandy is a true Frankenstorm, a monster created by man tampering with nature with oil, coal, and gas pollution.”
===========================================================
Lest you think this sort of logic affliction is unique to Brad Johnson, I’ll point out that his cheering section over at Grist says essentially the same thing in God’s latest warning:
Perhaps this weather scare that may well be much more than just a scare is God’s revenge for the refusal of the U.S. government to take action on the climate crisis. – Ted Glick
Can you imagine the howling from the left if some conservative evangelical said something like that? Whatever suits their purpose for the present I suppose is the new desperation dialog about climate.
The only way to deal with propagandic pinheads such as this is to counter with real facts, and then whenever his propaganda appears, put those facts right back into the venue wherever it appears through comments, emails, and letters. Clear headed people will understand, but you’ll never reach the science muggles that believe and push this sort of stuff while throwing facts to the wind.
By extension, Johnson and Glick’s claims are essentially that this Category 1 storm with 75MPH winds is somehow unique to American history, the result of “tampering” with “nature with oil, coal, and gas pollution.” And it hasn’t even made landfall yet. I don’t have to call BS on their idiotic claims, because the facts do it for me.
First, a historical review of October landfalling hurricanes. Data from the National Hurricane Center and Stormpulse.
OCTOBER HURRICANES MAKING LANDFALL IN THE USA
2005 Hurricane Season
| Name | Max Winds | |
|---|---|---|
| Wilma | 175 MPH |
2002 Hurricane Season
| Name | Max Winds | |
|---|---|---|
| Lili | 145 MPH |
1999 Hurricane Season
| Name | Max Winds | |
|---|---|---|
| Irene | 110 MPH |
1995 Hurricane Season
| Name | Max Winds | |
|---|---|---|
| Opal | 150 MPH |
1989 Hurricane Season
| Name | Max Winds | |
|---|---|---|
| Jerry | 85 MPH |
1987 Hurricane Season
| Name | Max Winds | |
|---|---|---|
| Floyd | 75 MPH |
1985 Hurricane Season
| Name | Max Winds | |
|---|---|---|
| Juan | 85 MPH |
1968 Hurricane Season
| Name | Max Winds | |
|---|---|---|
| Gladys | 85 MPH |
1966 Hurricane Season
| Name | Max Winds | |
|---|---|---|
| Inez | 150 MPH |
1964 Hurricane Season
| Name | Max Winds | |
|---|---|---|
| Hilda | 150 MPH | |
| Isbell | 125 MPH |
1954 Hurricane Season
| Name | Max Winds | |
|---|---|---|
| Hazel | 140 MPH |
1950 Hurricane Season
| Name | Max Winds | |
|---|---|---|
| King | 120 MPH |
1949 Hurricane Season
| Name | Max Winds | |
|---|---|---|
| Hurricane #10 | 130 MPH |
1948 Hurricane Season
| Name | Max Winds | |
|---|---|---|
| Hurricane #8 | 130 MPH |
1947 Hurricane Season
| Name | Max Winds | |
|---|---|---|
| Hurricane #9 | 120 MPH |
1946 Hurricane Season
| Name | Max Winds | |
|---|---|---|
| Hurricane #5 | 130 MPH |
1944 Hurricane Season
| Name | Max Winds | |
|---|---|---|
| Hurricane #11 | 120 MPH |
1941 Hurricane Season
| Name | Max Winds | |
|---|---|---|
| Hurricane #5 | 120 MPH |
1924 Hurricane Season
| Name | Max Winds | |
|---|---|---|
| Hurricane #7 | 120 MPH |
1923 Hurricane Season
| Name | Max Winds | |
|---|---|---|
| Hurricane #3 | 100 MPH |
1921 Hurricane Season
| Name | Historic Name | Max Winds | |
|---|---|---|---|
| Hurricane #6 | Tampa Bay | 140 MPH |
1916 Hurricane Season
| Name | Max Winds | |
|---|---|---|
| Hurricane #13 | 120 MPH |
1913 Hurricane Season
| Name | Max Winds | |
|---|---|---|
| Tropical Storm #4 | 60 MPH |
1912 Hurricane Season
| Name | Max Winds | |
|---|---|---|
| Hurricane #5 | 100 MPH |
1910 Hurricane Season
| Name | Max Winds | |
|---|---|---|
| Hurricane #5 | 150 MPH |
1909 Hurricane Season
| Name | Max Winds | |
|---|---|---|
| Hurricane #10 | 120 MPH |
1906 Hurricane Season
| Name | Max Winds | |
|---|---|---|
| Hurricane #8 | 120 MPH |
1904 Hurricane Season
| Name | Max Winds | |
|---|---|---|
| Hurricane #3 | 80 MPH |
1899 Hurricane Season
| Name | Max Winds | |
|---|---|---|
| Hurricane #8 | 110 MPH |
1898 Hurricane Season
| Name | Max Winds | |
|---|---|---|
| Hurricane #7 | 130 MPH |
1894 Hurricane Season
| Name | Max Winds | |
|---|---|---|
| Hurricane #5 | 120 MPH |
1893 Hurricane Season
| Name | Historic Name | Max Winds | |
|---|---|---|---|
| Hurricane #9 | —– | 120 MPH | |
| Hurricane #10 | Chenier Caminanda | 130 MPH |
1888 Hurricane Season
| Name | Max Winds | |
|---|---|---|
| Hurricane #7 | 110 MPH |
1887 Hurricane Season
| Name | Max Winds | |
|---|---|---|
| Hurricane #13 | 85 MPH |
1886 Hurricane Season
| Name | Max Winds | |
|---|---|---|
| Hurricane #10 | 120 MPH |
1882 Hurricane Season
| Name | Max Winds | |
|---|---|---|
| Hurricane #6 | 140 MPH |
1880 Hurricane Season
| Name | Max Winds | |
|---|---|---|
| Hurricane #9 | 80 MPH |
1878 Hurricane Season
| Name | Max Winds | |
|---|---|---|
| Hurricane #11 | 100 MPH |
1877 Hurricane Season
| Name | Max Winds | |
|---|---|---|
| Hurricane #4 | 120 MPH |
1876 Hurricane Season
| Name | Max Winds | |
|---|---|---|
| Hurricane #5 | 120 MPH |
1873 Hurricane Season
| Name | Max Winds | |
|---|---|---|
| Hurricane #5 | 120 MPH |
1870 Hurricane Season
| Name | Historic Name | Max Winds | |
|---|---|---|---|
| Hurricane #6 | Twin Key West (I) | 120 MPH | |
| Hurricane #9 | Twin Key West (II) | 100 MPH |
1869 Hurricane Season
| Name | Historic Name | Max Winds | |
|---|---|---|---|
| Hurricane #10 | Saxby | 100 MPH |
1867 Hurricane Season
| Name | Historic Name | Max Winds | |
|---|---|---|---|
| Hurricane #7 | Galveston | 100 MPH |
1865 Hurricane Season
| Name | Max Winds | |
|---|---|---|
| Hurricane #7 | 100 MPH |
1860 Hurricane Season
| Name | Max Winds | |
|---|---|---|
| Hurricane #6 | 100 MPH |
1853 Hurricane Season
| Name | Max Winds | |
|---|---|---|
| Hurricane #8 | 100 MPH |
1852 Hurricane Season
| Name | Historic Name | Max Winds | |
|---|---|---|---|
| Hurricane #5 | Middle Florida | 100 MPH |
That’s quite a list. From it you can conclude that strong October hurricanes hit the USA every few years, so Sandy is not in any way unique.
One storm in particular stands out as a parallel to Hurricane Sandy, and that’s Hurricane Hazel in 1954. Brad Johnson is of course too young to have any experience with it (and so am I) but unlike Johnson I pay attention to weather history rather than bloviate gloom and doom at the drop of hat for political purposes.
Hurricane Hazel, October 12-18, 1954

===============================================================
Hazel was first spotted east of the Windward Islands on October 5. It moved through the islands later that day as a hurricane, then it moved westward over the southern Caribbean Sea through October 8. A slow turn to the north-northeast occurred from October 9-12, with Hazel crossing western Haiti as a hurricane on the 12th. The hurricane turned northward and crossed the southeastern Bahamas on the 13th, followed by a northwestward turn on the 14th. Hazel turned north and accelerated on October 15, making landfall as a Category 4 hurricane near the North Carolina-South Carolina border. Subsequent rapid motion over the next 12 hours took the storm from the coast across the eastern United States into southeastern Canada as it became extratropical.
High winds occurred over large portions of the eastern United States. Myrtle Beach, South Carolina reported a peak wind gust of 106 mph, and winds were estimated at 130 to 150 mph along the coast between Myrtle Beach and Cape Fear, North Carolina. Washington, DC reported 78 mph sustained winds, and peak gusts of over 90 mph occurred as far northward as inland New York state. A storm surge of up to 18 ft inundated portions of the North Carolina coast. Heavy rains of up to 11 inches occurred as far northward as Toronto, Canada resulting in severe flooding.
Hazel was responsible for 95 deaths and $281 million in damage in the United States, 100 deaths and $100 million in damage in Canada, and an estimated 400 to 1000 deaths in Haiti.
For an interactive map of Hurricane Hazel visit the NOAA Coastal Services Center.
================================================================
The National Weather Service in Raleigh, NC has a history page on Hazel that says this:
The already remarkable damage Hazel inflicted was exacerbated by the timing at which the hurricane struck. Landfall occurred during the full moon of October – the highest lunar tide of the year. A storm surge in excess of 15 feet inundated southeastern North Carolina from Southport to Topsail Beach, with an astounding 18-foot surge reported at high tide at Calabash and on the island of Holden Beach. Incredibly, all but 12 of the 300 cottages in Holden Beach were destroyed. The surge also leveled many of shrimp houses that lined the riverfront, and put coastal Brunswick and New Hanover counties under water, effectively wiping out the beaches. The surge even reopened Mary’s Inlet, which had been artificially closed during the summer of 1955 by the Army Corps of Engineers.
Hazel’s Impact Felt Across the Eastern Seaboard and Southern Canada
A total of 15,000 homes or buildings were destroyed throughout the state, including some 39,000 damaged structures. Thousands of trees were downed by the combination of tropical-rain soaked ground and ferocious winds. 30 of North Carolina’s 100 counties sustained major damage. Based on reports from residents in the capital city of Raleigh, an average of two or three trees fell per city block, many on homes, automobiles, and power lines. In all, an estimated $136 million in damage occurred in North Carolina as a result of the mighty hurricane. Damage reached to nearly $281 million when the dollar damage in NC was combined with damage estimates from the rest of the United States. The storm went on to produce another $100 million in damage in Canada, as it accelerated northward and became extratropical. Most of the damage there resulted from heavy rain, nearly a foot in less than twenty four hours, associated with the remnants of Hazel. When all was said and done, the death toll included: 400-1000 in Haiti, 6 in the Bahamas, 95 in the US (including 19 deaths and 200 injured in North Carolina alone), and 100 more in Canada.
Hurricane Hazel produced the largest swath of hurricane force winds this century over Virginia and North Carolina. As active as the 1954 hurricane season was for North Carolinians, it was followed by an equally active 1955 hurricane season, when three more storms struck the state. However, none of those could match the fury of the historic Hurricane Hazel.
==============================================================
Sound familiar? Just watch and read the news reports warning of the storm surge from Sandy, and you’ll see its just a repeat performance of lunar timing coincidence. Here’s one from NBC:
Full moon could make Sandy’s impact worse
Gravitational tugs could make high tides rise even more
Heaven and Earth may be aligning to turn Hurricane Sandy into a real monster, just in time for Halloween.
Forecasters expect Sandy to make landfall along the mid-Atlantic coast of the United States on Monday or Tuesday. It may merge with a separate tempest hitting the region at about that time, creating an immensely powerful “Frankenstorm” whose effects could be magnified by the full moon.
When the moon waxes to its full phase Monday afternoon, high tides along the Eastern Seaboard will rise about 20 percent higher than normal, even without the help of Sandy’s storm surge, said Joe Rao, a meteorologist for News 12 in Westchester, N.Y. (Storm surges occur when a hurricane’s winds push the water surface above normal levels.)
Hazel had the same storm surge lunar magnifier, but the MSM is treating it as if this is something new and unique and there’s no mention of Hurricane Hazel in the NBC story.
And then there’s the New England Hurricane of 1938: (h/t to John Coleman)
The 1938 Hurricane, by the Works Project Administration – During this storm, Frank Schubert, last keeper of Coney Island Light, was aboard the buoy tender ship Tulip, which was thrown aground on top of some train tracks by the storm. Even Supermandia recognizes what an event that was.
Here’s the weather map for it from the US Weather Bureau:
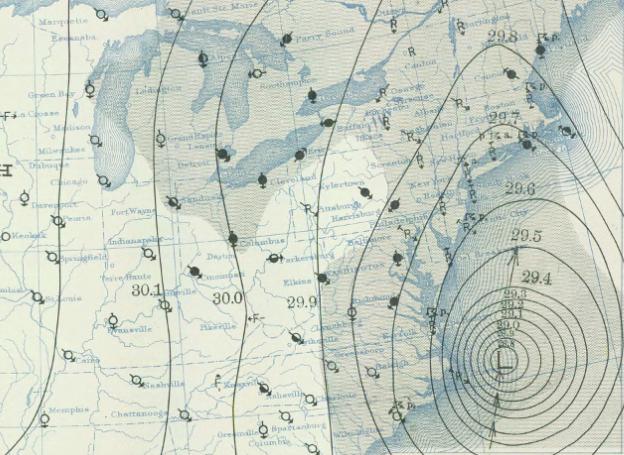
All that happened before Roger Revelle took his first CO2 measurement and published a paper that started it all. Nothing has been seen like Hurricane Hazel since.
Let’s look at CO2 and hurricanes
Why? Because if paid political shills like Brad Johnson are to be believed, CO2 increases in Earth’s atmosphere are the cause of all this “frankenweather” happening now.
This scatterplot graph (by Steve Goddard) shows the relation between atmospheric CO2 concentration and landfalling US Hurricanes.

There is no correlation between atmospheric CO2 and major hurricanes striking the US.
The majority of landfalling US hurricanes occurred when CO2 was around 300 ppm, i.e., the 1950’s. Ambient CO2 is about 394 ppm right now according to the latest NOAA CO2 data.

That blows Brad Johnson’s political frankenpropaganda right out of the water.
Finally let’s look at hurricane related death rates from: Hurricane Fatalities, 1900–2010: Context in these Stormy Times (Aug 27th, 2011)
excerpt of Dr. Indur Goklany’s article:
Long term U.S. data on hurricane fatalities show that from 1900–09 to the 2009–10, hurricane deaths and death rates declined by 82% and 95%, respectively (see Figure 2).These estimates use data from the National Hurricane Center (NHC) provided in Blake et al. (2007) which has 1,525 deaths for 2005, the year of Katrina.
[Note that this month, the NHC, via Blake et al. (2011), put out a new report which has 1,225 deaths for 2005, while NWS’s Weather Fatalities website uses 1,016 for that year. I plan to keep on using the older NHC/Blake et al. estimate, pending consultation with Dr. Blake. I have contacted him, but to no one’s surprise, least of all mine, he has much more important things to do right now.]

Figure 2: U.S. hurricane deaths and death rates per year, 1900–2010. Sources: Updated from Goklany (2009), using USBC (2011) and NWS (2011). For 2005, this figure uses National Hurricane Center data from Blake et al. (2007), which has 1,525 deaths for that year, but Blake et al. (2011) has 1,225 deaths while NWS Weather Fatalities uses 1,016 deaths. This figure uses the Blake et al.’s older data, pending consultation with Dr. Blake.
Conclusion
To any thinking person reading the above, clearly there’s no connection between Hurricane Sandy, atmospheric CO2 levels, or payback from God. It’s the worst example of climate propaganda since An Inconvenient Truth.
Don’t believe political shills like Brad Johnson as he doesn’t rely on facts, but rather, fear. That makes him and those like him that say Hurricane Sandy is some sort of “wrath” for human behavior he and his buddies don’t like not only unreliable and idiotic in their approach, but malfeasant to boot.
Call them on it wherever you see it.
Pink Floyds’ Roger Waters said it. “What God wants, God gets”
Brad Johnson or Ted Glick should find better things to say and do! Any attribution of specific weather events to AGW is shaky science. Any attribution of specific weather events to God is not science at all. While it is natural for people on any side of any argument to make emotional appeals, this often backfires in scientific settings.
However, the rebuttal also has some problems.
Any time you attack an “extension” of someone’s argument, you are, by definition, attacking a strawman! Stick to rebutting what they said, not what you wish they said.. Heck Ted even says “It is absolutely true that strong storms are not anything new” in the article you quote. So clearly he does not believe what you attribute to him!
I lived on Topsail Island in 1954. We left before it got too bad and never went back.
Big big blow with lots and lots of rain. Dad had come back from Korea and was at Camp LeJune at the time. He had just been released from active duty so there was no reason to stay. We literally headed for the hills.
Grammar quibble: I realize that this material is not your original, but the sentence “The surge even reopened Mary’s Inlet, which had been artificially closed during the summer of 1955…” doesn’t make sense. Can’t speak in the past perfect tense of 1955 events, when discussing a 1954 storm. This source says “The storm surge re-opened Mary’s Inlet, which had been recently closed by the Army Corps of Engineers.”
Global trends in hurricanes are discussed in Weinkle et al., “Historical Global Tropical Cyclone Landfalls”, non-paywalled version here. Its abstract says “The analysis does not indicate significant long-period global or individual basin trends in the frequency or intensity of landfalling TCs of minor or major hurricane strength.”
Frankenmoron….
Very good article.
Your hurricane history is excellent.
Thanks, Anthony.
“When the winds of November come early”- Gordon Lightfoot
Brad Johnson’s article is another example why it is important that the public not be aware of history. The revisionists have to discredit anyone who knows through actual research that claims like “Frankenstorm” are clearly false and have no basis in reality.
“To any thinking person reading the above” is the most important part of the conclusion IMO.
Brad Johnston and other members of “the cause” rely on people accepting blindly what they are told.
Even the name “Forecast the facts” is unscientific as it has the cart before the horse.
The scare focus is on the wrong system. The hurricane isn’t the issue. It is why it would follow the predicted path. What pressure systems are working together that would push this thing inland at New York versus the usual turn out to sea? If people want to assign this landfall event to fossil fuels, they will have to look at these other pressure systems that have been predicted to push/pull this thing towards land. The huricane itself is a standard yawner.
Once the media focus is placed on the right path directors in this event, we can all actually learn something. But what fun is there in focusing the camera lens on pressure systems to the right and left of the path that would cause this thing to hit landfall? The eye of the hurricane makes a much more gripping TV screen shot and hands professional weirdos their requested AGW photo op.
My comment appears to have been swallowed by Frankenstorm!
So … God sends cold air from the arctic to collide with the warm air of a hurricane and it is AGW?
Maybe god is saying “Quick, burn more coal like Germany and heat up the arctic so no more cold air will come south!”
Anti-science?
Eternal Father, strong to save,
Whose arm hath bound the restless wave,
Who bidd’st the mighty ocean deep
Its own appointed limits keep;
Oh, hear us when we cry to Thee,
For those in peril on the sea!
O Christ! Whose voice the waters heard
And hushed their raging at Thy word,
Who walkedst on the foaming deep,
And calm amidst its rage didst sleep;
Oh, hear us when we cry to Thee,
For those in peril on the sea!
(The valedictory hymn at school at the end of term)
Okay…I’ll howl. It was a stupid and bizarre statement, indeed almost as nutty as the statement that E. Calvin Beisner has been promulgating and actually has managed to get scientists like Roy Spencer and David Legates to sign on to ( http://www.cornwallalliance.org/blog/item/prominent-signers-of-an-evangelical-declaration-on-global-warming/ ), as well as Ross McKitrick. Statements of this sort on either side should be criticized and it is hard to take either person seriously as both have shown very bad scientific judgement.
Johnson’s statement is also certainly beyond what the current science can support.
“Perhaps this weather scare that may well be much more than just a scare is God’s revenge for the refusal of the U.S. government to take action on the climate crisis. – Ted Glick…”
Wow! That’s what you get for ‘refusing to take action’? I wonder what the Chinese and Indians are going to get? ‘Cause they are actively pumping out lots of CO2…
Perhaps Confucius has had a chat with Brahma and Vishnu, and decided that the IPCC’s data is so one-sided as to be meaningless….
Damn those Democrats for organising a storm for the election. It’ll remind everyone just how incompetent the last Republican president was! Is there nothing these democracy hating communists won’t stoop to?
Trick or Treat ! ! !
Per KeithW above….the now NHC downgraded “Frankenstorm Sandy”….
may NOT become our Halloween surprize….can we then….
rebrand pet name given by….the BJ at “Fauxcast the Fakes”….
FRANKENSPRINKLE SANDY ? ? ?
I was in my early teens when Hazel struck. We were driving from Ontario to New Brunswick through New England. I can remember many trees having been blown down and being cut up with chain saws (I still remember the scream of their 2-stroke engines) and the lack of electricity. Gasoline pumps were made operative by gasoline engines driving the internal mechanism by a V-belt, and the restaurant where we ate (cold food, of course) was illuminated by huge candles from a nearby church.
IanM
AIR FORCE AIRCRAFT FINDS HURRICANE-FORCE WINDS AGAIN…
8:00 AM EDT Sat Oct 27
Location: 28.8°N 76.8°W
Moving: NNE at 10 mph
Min pressure: 960 mb
Max sustained: 75 mph
__________________________________________
Pffff. In Britain, we call that a small Atlantic depression.
Try the 26th January 1884 depression, that broke all records here.
Crieff, Perthshire 925.6mb.
Oban: 27.39″ (927.4mb)
Forest of Glen Tana 27.39″ (927.4mb)
North Shields: 27.63″ (936mb)
Cargen: 27.66″ (936mb)
Dublin: 28.15″ (953mb)
Like the three little pigs, here in the windy UK we learned to make our houses of bricks instead of sticks. Perhaps Obama would like to lecture the US on that thorny little subject instead of claiming trace gasses.
.
“Any attribution of specific weather events to God is not science at all.”
Attribution of ANYTHING to god isn’t science.
History is full of people who claim to be speaking for God who don’t have His “phone number” and refuse to answer when He calls. And it is full of people who do things in the name of God without first finding out what it is God wants done. And it is full of people blaming God for things He’s got nothing to do with.
AlFrankenstorm is a case in point. I feel sad for Brad.
PS If Brad says the storm is God’s doing, is he going to stop blaming Man for Climate Change?
Why do people write things that they know are utterly false and will be revealed as such within hours? I would be embarrassed. Apparently, that is not a problem.
joeldshore says:
October 27, 2012 at 7:53 am
“Alarmist’s statements are also certainly beyond what the current science can support.”
Fixed it for you.
I noticed this comment was prominent in the post-
“Perhaps this weather scare that may well be much more than just a scare is God’s revenge for the refusal of the U.S. government to take action on the climate crisis. – Ted Glick”
Ted et al must of forgotten about the US governments efforts funded via the stimulus program- with less then stellar results as noted here:
http://thebreakthrough.org/index.php/programs/energy-and-climate/how-the-economics-of-the-left-and-right-have-failed-the-electric-car/
and here-
Jim McCrea, of the DOE’s, thoughts on the ACTIONS taken to address the climate crisis via the Stimulus Programs- http://washingtonexaminer.com/email-includes-doe-officials-midnight-confessions-on-picking-losers/article/2511833#.UIsRQ2_A_5x
“lf, as a jobs creation mechanism, there is an incentive for PV solar installations, I do think demand could soar and create large numbers of jobs simultaneously.
“However, lf I were going to invest on that thesis, l might look at inverter manufacturers like Xantrex rather than bet on the PV solar anufacturers. All in all in the solar field, l think it is extremely easy to pick losers and l really do not know how to pick winners.”
Obviously most of the folks that have been trying to select new technologies to generate new products haven’t spend much time doing either activity. A refresher on the subject seems in order-
“Managing innovation: an uncertainty reduction process” by Alan W. Pearson. His uncertainty map, is published on slide 8 in this power point presentation:
http://search.yahoo.com/r/_ylt=A0oGdbl1qhlQQwoAiQJXNyoA;_ylu=X3oDMTE1dmE4NHFiBHNlYwNzcgRwb3MDMQRjb2xvA3NrMQR2dGlkA0FDQlkwNF8xMDA-/SIG=144qkb567/EXP=1343888117/**http%3a//w3.gre.ac.uk/schools/business/entrepreneur/Resources/Managing%2520and%2520facilitating%2520Innovation.ppt
Wow, I had no idea so many hurricanes hit New England like that. Thanks for the information. Most people are under the impression that those hit the Gulf States and stuff like that. Thanks for the clarification.
John Brookes says:
October 27, 2012 at 8:14 am
(I am leaving my response as empty as the post I am addressing)