PART1 – (part 2 comes later today is NOW ONLINE HERE)
I’ve been noting with some humor the anticipation of a new Arctic sea ice extent minimum in the Alarmosphere. Yesterday, the frustration that there hasn’t been any major announcement yet bubbled to the surface in the form of a Michael Mann tweet, who was upset that NSIDC is making him wait:

Today though, looking at the NSIDC extent graph, he seems happy, declaring it “official”:

NSIDC made an announcement a few minutes ago, just as I started writing this post (and for that reason I’m publishing this post in two parts, see below):
Arctic sea ice appears to have broken the 2007 record daily extent and is now the lowest in the satellite era. With two to three more weeks left in the melt season, sea ice continues to track below 2007 daily extents.
Arctic sea ice extent fell to 4.10 million square kilometers (1.58 million square miles) on August 26, 2012. This was 70,000 square kilometers (27,000 square miles) below the September 18, 2007 daily extent of 4.17 million square kilometers (1.61 million square miles).
Here’s the plot, annotation mine:

Predictably, Seth Borenstein is already practicing for the big story he’ll be writing any minute now, and, the money quote he uses is just as predictable:
Data center scientist Ted Scambos says the melt can be blamed mostly on global warming from man-made emissions of greenhouse gases.
Neither Borenstein nor NSIDC’s current announcement mentions the massive Arctic storm that broke up huge amounts of sea ice, making this new record low possible. NSIDC said on August 14th:
As of August 13, ice extent was already among the four lowest summer minimum extents in the satellite record, with about five weeks still remaining in the melt season. Sea ice extent dropped rapidly between August 4 and August 8. While this drop coincided with an intense storm over the central Arctic Ocean, it is unclear if the storm prompted the rapid ice loss.
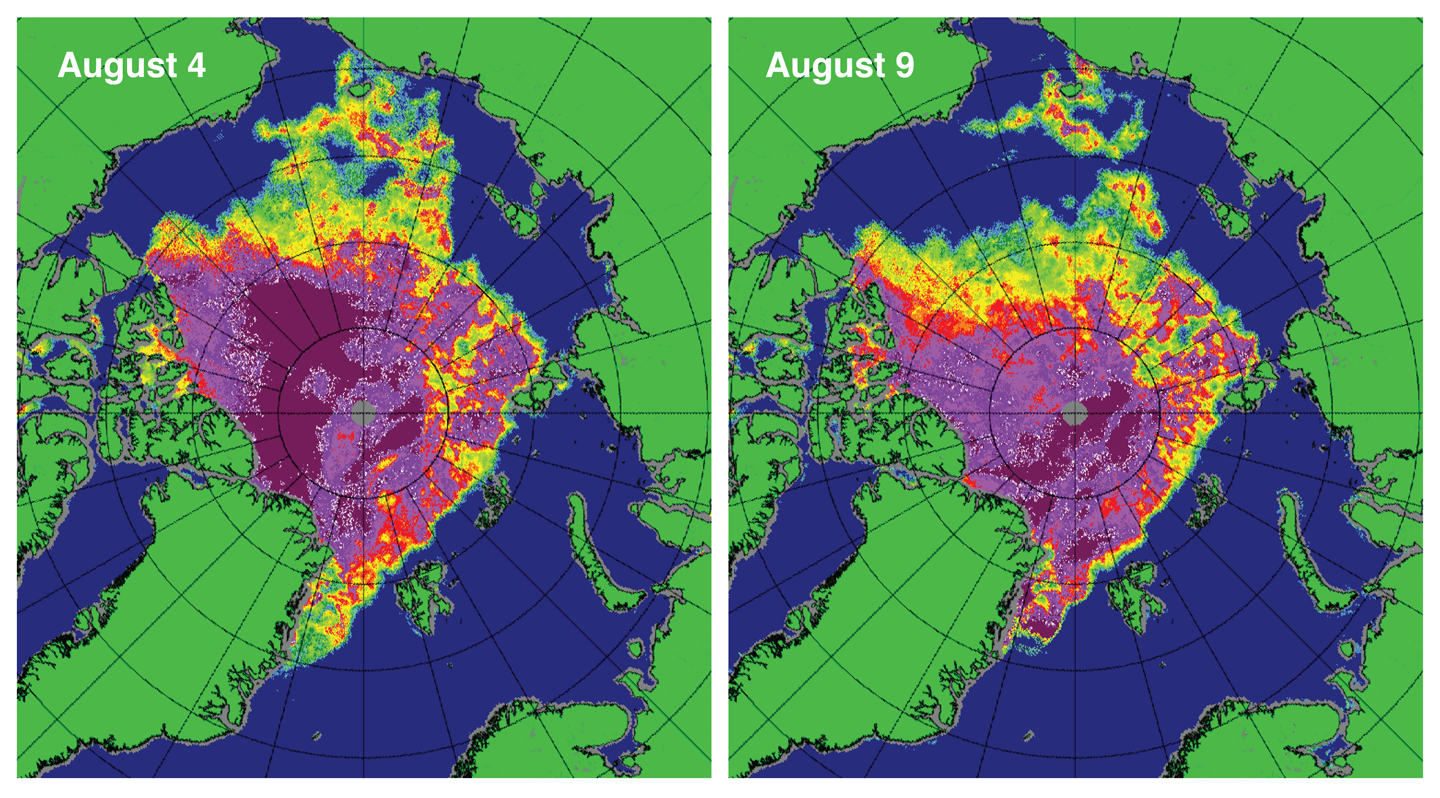
Unclear? Hmmph. Further down they dub it: “The Great Arctic Cyclone of 2012” and provide this before and after image:

Figure 4. These maps of sea ice concentration from the Special Sensor Microwave Imager/Sounder (SSMIS) passive microwave sensor highlight the very rapid loss of ice in the western Arctic (northwest of Alaska) during the strong Arctic storm. Magenta and purple colors indicate ice concentration near 100%; yellow, green, and pale blue indicate 60% to 20% ice concentration.
Credit: National Snow and Ice Data Center courtesy IUP Bremen
Calling the reason “unclear” seems more than a bit disingenuous to me, especially when you don’t mention it again.
It should be noted that in the ARCUS sea ice forecast submitted on August 5th, both NSIDC and WUWT forecasts agreed at 4.5 million sqkm. Clearly NSIDC didn’t expect this storm nor its effects, because if they had, their forecast would have been much lower.
In part two of this post, later today, I’ll share some other interesting things I’ve found that suggests NSIDC and the media aren’t telling you the full story right now.
Smokey,
You have a very large bowl of cherries at your disposal, but that does not stop them being cherries. I have seen your 50 or more charts, and each one is a cherry pick: too long so as to mask the relevant effect, too short so as to hide it in a different way, too localised, inappropriate y-axis, or superimposed with a linear trend when a different trend would be a better fit. Cherries, evey one.
And regarding beliefs, it is you, Smokey, who ignores all scientific evidence in favour of newspaper articles and the like, simply because they appear to confirm your wishful-thinking-inspired beliefs.
John
Gail Combs says:
August 27, 2012 at 3:13 pm
…….
It is just plain common sense. Floating sea ice is 90% under surface, and 10% in the air, not to mention huge heat capacity of water in comparison to puny one of the atmosphere.
Has any ‘atmosphere ice melting scientist’ asked ‘why icebergs do turn over on regular basis?
Well, because it melts from underneath, becomes top heavy and then rolls over.
hey, ‘scientist’ did you notice below water line melt section.
Smokey says:
August 27, 2012 at 12:15 pm
Steven Mosher says:
“A real skeptic would shrug his shoulders and say… ‘Sure there is less ice, sure warmer temps plays a role, but we have no knowledge about why its warmer’.”
I think that is what most of us here are saying. The planet is still emerging from the Little Ice Age, but we don’t know all the reasons why, or why the LIA occurred in the first place. It was one of the coldest times of the entire Holocene. Why? We are not certain why.
The actual error is on the side of the climate alarmist crowd, which assumes that human activities are causing global warming. The fact that they have no scientific evidence to support their assumption seems to be irrelevant to them. Thus, their belief is no different than a belief in witch doctor juju. They cannot explain it, and they have no evidence for it. They simply believe it.
==========================================================
Dittos
Gail Combs says:
August 27, 2012 at 3:39 pm
I think you get the broad swing during the glacial and a much lesser swing during an interglacial because the earth’s feedback mechanisms put an upper limit on the high temperature.
The paper itself points to something completely outside of the earth as the “clock” Dr Nir J. Shaviv comments on The Milky Way Galaxy’s Spiral Arms and Ice-Age Epochs and the Cosmic Ray Connection So I would hazzard a SWAG that there is something in our galactic neighborhood that is effecting the earth’s climate on a 1470 year period. A comet maybe?
It is obvious we are still collecting all the factors that effect the earth’s climate. I do not thing saying X% is due to the sun or CO2 or H2O or Cosmic Rays or Geomagnetic variations can be done until we know all the factors first.
—————————
1) We are probably not at the top of the curve at present. The superwarming episodes observed during this and previous interglacials give us another degree or two of at least temporary warming. I would expect to see a stronger signal than we do.
2) We have a very good idea of what’s around us for a number of light years. Anything likely to affect us from outside the solar system should have been noticed. A long period comet would have left a detectable debris trail around its orbit, and anything much heavier in the solar system would have shown its orbital influence. I know that “absence of evidence is not evidence of absence”, but that’s usually the way to bet.
3) We probably have all the major climate drivers spotted. They are the ones showing detectable influence on the short or long term record. There may be others, like your 1500 year peridicity, but if they are influencing our current climate they would show in the energy budget as unexplained peaks or gaps in insolation, back radiation or the emission spectrum.
There is a story of the Stealth fighter development. A model of the aircraft was mounted on a plinth and illuminated with a radar. The engineers saw no return signal, making the aircraft effectively invisible. One engineer said “its gone”. HIs young son pointed out the window and said
” No it hasnt, I can see it.”
Your hypothetical unknown variables would leave a signal somewhere. That they do not suggests that they are absent, insignificant or at best intermittent.
Some European says:
August 27, 2012 at 3:10 pm
One word: pathetic.
Get over it, guys.
Please, let’s all move on to the real debate: what to do about this problem?
________________________
Drop all the politicians who are after our wealth in the Arctic sea to feed the Poley Bears?
Oh, and since when is warmer a problem? History tells us it is COLD weather that causes civilizations to colapse. Of Time and Temperatures
The Greenland ice core graph shows a slow descent during the Holocene into the next big ice age.
NASA Scientists Predicted a New Ice Age in 1971 Dr. S. I. Rasool came to his chilling conclusions by resorting in part to a new computer program developed by Mr. Hansen that studied clouds above Venus.
This was the same time period that the Milankovitch cycle theory was being investigated.
A refinement of this work (actually a clearification of info that was lost) is discussed in this article with links to the paper: In defense of Milankovitch by Gerard Roe
A discussion about the end of the Holocene by a a California Licensed Professional Geologist and former Certified Environmental Auditor (and former global warming proponent) with links to several papers is here.
The return to Ice Age conditions is a given and that should be the biggest concern. Killing off our civilization under those conditions at the tail end of the Holecene is sheer idiocy.
RACookPE1978 says:
August 27, 2012 at 1:54 pm
“What is the final link to that composite graph of the DMI data?”
http://ocean.dmi.dk/arctic/meant80n.uk.php
David A. Evans says:
August 27, 2012 at 10:24 am
JohnB says:
August 27, 2012 at 9:56 am
REPLY: Thanks Walt, have you ever considered we may be at/near the bottom of a natural cycle? How can you rule that out without data much beyond 30 years? There’s historical anecdotal evidence of very low Arctic sea ice in the past where you have no data. – Anthony
——————-
Anthony, what evidence would that be?
How’s this?
Within 5° of the pole & no ice, that’s 300nm.
Only if the Russians could walk on water! Read the article, they were drifting in the ice not open water. (like the Fram)
vukcevic says: @ur momisugly August 27, 2012 at 3:54 pm
Gail Combs says: @ur momisugly August 27, 2012 at 3:13 pm
…….
It is just plain common sense. Floating sea ice is 90% under surface, and 10% in the air, not to mention huge heat capacity of water in comparison to puny one of the atmosphere….
________________________________
Another one of those inconvenient little facts that are never mentioned especially in the press.
Your graph of the AMO and the NAO (delayed X years) shows the warming/cooling cycle of the Atlantic Ocean bottoming out in the early 1970’s and topping off in the last few years. The peak look like it is around 2005 – 2007.
So there is a perfectly logical explanation for the sea ice melt being greater now than in the 1970’s.
Graph 1 and Graph 2 and Graph 3
Gail Combs says:
August 27, 2012 at 4:16 pm
The return to Ice Age conditions is a given and that should be the biggest concern. Killing off our civilization under those conditions at the tail end of the Holecene is sheer idiocy.
———————-
We WERE due to go back into a glacial period. Up until 1880 we were cooling at 0.6C per millenium, barring the odd Maunder Minimum.Then we started warming at better than 0.6C per century, for reasons we’ll probably be arguing about indefinately.
The planet will warm or cool and not notice. As a civilization living mostly on coastal plains we will end up with one of four outcomes.
1) We try to mitigate climate change, reducing its effect when it comes.
2) We try to mitigate climate change and it does not come. We look silly.
3) We do nothing about climate change and it comes. We get hammered.
4) We do nothing about climate change and it does not come. We win.
I feel a bit like Pascal. To summarise Pascal’s Wager:-
God may exist ,or he may not.
I may believe in him or I may not.
If I believe in him and he exists, I go to Heaven.
If I believe in him and he does not exist I have lost nothing.
If I do not believe in him and he does not exist I have lost nothing.
If I do not believe in him and he exists, I go to Hell.
I will therefore believe in him to minimise my risk.
I am inclined to accept climate change to minimise my risk.
I thought the Arctic ice was increasing:
Except of course when there’s no trend:
Happily, the resolution to these conflicting ideas comes from the same source:
JohnB says:
“And regarding beliefs, it is you, Smokey, who ignores all scientific evidence in favour of newspaper articles and the like, simply because they appear to confirm your wishful-thinking-inspired beliefs.”
•
JohnB, may I once again point out the plain fact that there is no scientific evidence showing that human CO2 emissions cause global warming. None. Not even a little bit of evidence. It is all just your baseless belief.
But there is scientific evidence showing that changes in CO2 follow changes in temperature. On all time scales, from years to hundreds of millennia. Faced with solid scientific evidence, and having zero scientific evidence to support your belief, you give the typical alarmist response.
•
Kevin MacDonald,
You make no sense. But it sends a tingle up my leg to see that you’re saving my comments from years past.
Let me point out that what I wrote in 2010 was valid for 2010. The fact that conditions have changed does not seem to have occurred to you. So let me end with a quote from Leon Trotsky:
Everyone has the right to be stupid, but comrade MacDonald abuses the privilege. ☺
Gail Combs said
“The return to Ice Age conditions is a given and that should be the biggest concern. Killing off our civilization under those conditions at the tail end of the Holecene is sheer idiocy.”
Well yes it is of course a concern, but not our biggest concern. The timescales are completely different. The next major glaciation is not due for thousands of years – Houghton says 50,000 years.
The affects of human induced climate change on the other hand are being felt now and will impact fully on scales of hundreds of years.
And who said anything about “killing off our civilization” ?
A few hundred years back the height of transport and industrial technology was steam power. We are currently at the start of the next industrial revolution which will, over decades, deliver most of our power from renewable resources.
The “biggest concern” is how much more carbon we put into the atmosphere before we start to seriously switch to renewables and high efficiency.
kramer says:
August 27, 2012 at 3:08 pm
Why does the NSIDC graph bottom out at 2 million square kilometers? It should be 0.
Visually, the ice graph looks worse with the bottom y axis set to 2.
Try this one:
http://ocean.dmi.dk/arctic/meant80n.uk.php
Why does the y-value start at 235 K and not Zero?
There are two sorts of answers:
One is that the programs doing the drawing use automatic scaling:
http://asymptote.sourceforge.net/doc/graph.html#automatic%20scaling
Two is that the designers of the graph never expect it to get as low as that beginning number. In the ice graph case they apparently do expect it to go to zero. Thus, answer #1 it is.
If the ice loss was due to the storms at the pole then the refreeze should quickly restore it. But here is a question I have – the drum beat from the alarmists is the ice loss represents loss of albedo which is seen as a positive feed back. But if you look at the polar cloud cover the albedo problem appears to be a red herring. Part II of that is that if the sea is exposed to the sky as is one would think with such low levels of ice, the polar ocean is losing heat through radiation at epic levels. That is a cooling event, not a warming event at this time of year.
Entropic man says:
August 27, 2012 at 4:14 pm
…..Your hypothetical unknown variables would leave a signal somewhere. That they do not suggests that they are absent, insignificant or at best intermittent.
________________________________________
First during the last 450 kyr BP, the temp swing has been ~ 10C Graph That includes 5 interglacials with peaks about +/- 1C of each other.
Scientists have already said they have no idea what is causing the 1,470 yr cycle Dansgaard-Oeschger events. In the paper I linked to the scientists think it is caused by outside influence. In this paper, Were Dansgaard-Oeschger events forced by the Sun? Braun and Kurths suggest
This paper: Controls on the tropospheric oxidizing capacity during an idealized Dansgaard-Oeschger event, and their implications for the rapid rises in atmospheric methane during the last glacial period looks at CH4.
And The Azimuth Project
So there is a known cycle that is quite prominent in the Greenland ice cores and in the history of the rise and fall of various civilizations and no one agrees on what the devil is causing it. (In some cases it is not temperature but precipitation that changes. E. M. Smith elaborates on the D/O Bond events in this WUWT comment )
You may also recall the infamous quote from Kevin Trenberth.
“The fact is that we can’t account for the lack of warming at the moment and it is a travesty that we can’t,”.
When a scientist declares everything is known about a subject, then you know he is lying.
Steven Mosher says:
August 27, 2012 at 11:41 am
=============
Ask any pilot, gremlins are real.
Entropic man says:
August 27, 2012 at 5:06 pm
“I am inclined to accept climate change to minimise my risk.”
Except that you are asking the rest of us to finance your acceptance.
“1) We try to mitigate climate change, reducing its effect when it comes.
2) We try to mitigate climate change and it does not come. We look silly.
3) We do nothing about climate change and it comes. We get hammered.
4) We do nothing about climate change and it does not come. We win.”
How silly. We all know the climate will change, so #2 and #4 are wrong. Your assumption that climate change (whichever direction) will always be harmful is unfounded, so #1 and #3 are also wrong. In addition, your assumption that whatever humans do will be beneficial just demonstrates that you are filled with self importance. But alas, all dictators are that.
Blast. This is really annoying, because:
A.) A couple of my pet theories got trashed this summer. But at least I can admit I was wrong.
B.) The Global Warming fraud will be able to limp on a bit longer before paying the piper, called Truth. The aging fools most responcible for this fraud might even be able to milk a final trip to Bali from the delay. Meanwhile the honest scientists, who have stood up for Truth and taken some lumps, are likely to take a few more lumps, rather than gaining the praise and rewards they truly deserve.
I’d like to note a few minor details:
1.) Rather than tilting and sinking, the “North Pole Camera” shows meltwater pools starting to freeze over.
2.) If you look at the map at http://nsidc.org/data/seaice_index/images/daily_images/N_bm_extent_hires.pngt
you will notice Siberian bays that are usually ice free still have some ice, even this late in the summer.
3.) Entering winter with this much open water will allow far more heat to be lost to the polar night (and outer space) than would be lost if the arctic ocean was sheltered by ice. Think of an igloo. If you wanted to stay warm, whould you lie in the igloo, sheltered by ice, or lie out in the open?
I would like to sit back and wonder and marvel and study the weather patterns that having so much open water are like to show us. It really spoils my enjoyment when the beauty of nature is dirtied by the grunge of politics.
James Abbott says:
August 27, 2012 at 5:18 pm
Others say not. There is a lot of links at this discussion of The End Holocene, or How to Make Out Like a ‘Madoff’ Climate Change Insurer
you get this
Sure sounds like the scientist really do not know. Also there has been the recent update to the Milanchovitch cycles and now the match is excellent, link therefore an abrupt end of the Holocene can not be ruled out.
Sorry but that is absolute Bull Feces. The current temps and climate are neither unusual or nasty. There is a good reason it is called the Modern Optimum and that is because the climate is very nice right now.
The goal is an ~85% reduction in CO2 (not carbon) The EU’s road map reflects the stated goal by European governments to reduce emissions by 85-90 percent by 2050, compared to 1990 levels. I ran through that analysis a while ago see comment It will put us back to the level of civilization in the early 1800’s. Wind, biofuel and solar are not energy dense enough to sustain anything close to our current civilization it is just that simple. It is also the reason for shifting from wind and biofuel to coal in the first place. China India and Russia of course will do very well since Australia and the USA will be shipping them our coal and The World Bank will be providing the funding for the building of all the new coal plants.
So you are correct only the free western civilization will be killed off. The areas where individual human rights are trod on with combat boots will be allowed to prosper.
The corporations and bankers really do want a captive work force and if you read between the lines that is what “sustainability” is all about. Shove everyone in cities composed of tiny dormitory style housing. Restrict travel to bikes and walking. Ban any and all farming, gardening and small independent businesses.
When ever the corporate owned media and politicians are pushing hard for something better dig to find out how benefits because it certainly is not going to be the little guy.
My favoured explanation for the D-O events is ocean cycles based on the thermohaline circulation (1000 to 1500 years long) drifting in and out of phase with solar variations (1000 years for a full cycle).
When in phase they combine to give severe climate swings such as observed during glaciations, when out of phase they tend to offset one another for smaller climate variability such as seen during interglacials.
In fact I suspect that they would have an influence on the timing of the shifts into and out of glaciations whilst the Milankovitch cycles operate in the background.
Severe downward swings would tend to give rapid ice build up on the northern continents that would not all melt in the next upswing.
Small downward swings giving less ice build up which more easily melted in the next upswing.
The ratio between glaciations and interglacials being about 9 to 1, I suspect that the current northrern hemisphere landmass distribution allows fast enough ice build up during downswings to keep us in glaciations for 90% of the time.
“Everyone has the right to be stupid, but comrade MacDonald abuses the privilege. ☺”
History has shown that Leon Trotsky was the stupid one. Comrade MacDonald is still doing just fine.
Well I’m pretty sure you didn’t answer any of the questions. Here, I’ll just repost them all back to back with all other commentary stripped:
Julienne, Are you saying we’re supposed to still be in the same climate that we had in the 1960’s and 1970’s? … Are we supposed to be in that climate again? … Did man alter that pristine cooler 1970’s climate forcing our moderately warmer current climate? … Do you believe that humans have brought an abrupt stop the natural cool and warm and cool and warm cycles locking us into a permanent warming? … Have we ruined the chances for another Little Ice Age? … Where were you 4 months ago when extent hit the long term average (and probably exceeded it but for a suspicious satellite problem once again)? … Did the CO2 concentration drop 4 months ago and suddenly return to normal at the solstice? … Do you in fact believe that this past July was the hottest in all history? … Do you in fact believe that CO2 is behind the melting of Arctic sea-ice (but somehow ignores every place else!)? … Both these things (the so-called melting in the Arctic is the same water that freezes and thaws annually, and also that nothing about sea-ice affects sea-level.) get confused in the general publics’ mind, and I suspect that Serreze is just fine with that. Are you?
After re-reading your ‘answers’ it occurs to me that it all supports my inference that you and your fellow AGW believers specifically worship two separate hockey sticks. It can all be concisely explained …
(1) The Mannmade stick with a straightened handle (wiping out the MWP,LIA and other variations) and an upturned blade (for human caused thermal runaway) to scare the bejeezus out of everyone.
(2) A northern hemisphere summer sea-ice minimum extent hockey stick with a straightened handle (equalizing all extent from the 1970’s backwards to 1900 according to you) and a downturned blade (for Serreze’s death spiral) of summer extent.
These two concepts illustrate the entire body of evidence from the AGW hoaxsters. It also identifies just how flimsy this house of cards really is. If either stick is considered as a handle + blade, then either or both hockey stick is falsifiable by locating errors in their handle *or* blade which irrefutably transforms the hockey stick into something completely the opposite.
I’ll cut to the chase now, neither of these hockey sticks will be around much longer. It was a fool’s errand to try to elminate the MWP and LIA, and now many people are unearthing and compiling supporting documentation. The blade portion for temperature is also crushed by many people like McIntyre, not to mention the common sense of expected post-LIA moderate warming (Duh, what should it be doing?).
The other stick is even more fragile because the handle is anything but straight and the effort to use the 1970’s as a starting point for icy death spirals, and then further compound this as being representative back to 1900 defies all reason. Historical newspaper accounts show the thing changing all the time, and each time there is a bunch of hoaxsters making grand pronouncements of impending disaster. The downturned blade portion will be fixed all by itself within a couple of years as mother nature works her magic and frustrated alarmists like Romm, Serreze, and now Mosher are heard babbling and stuttering excuses for anyone still listening.
The only thing that real scientists and skeptics need to do is keep a close eye on the foxes guarding the chicken coops full of sea-ice and other data, making sure Hansen style corruption cannot occur, and that apples are no longer compared to oranges.
Several people here assert that the Arctic Sea Ice extent is linear.
Unfortunately, a linear fit of Sept min sea ice extent, even over the limited satellite record (33 years) has to be discarded as a viable hypothesis of Arctic Sea ice decline, since it leads to a completely unrealistic 5 million km^2.
Even the WUWT ARCUS poll was well below that number, so apparently WUWT voters do not believe in a linear decline either.
The best fit over the satellite record is the Gompertz fit :
http://neven1.typepad.com/blog/2011/04/trends-in-arctic-sea-ice-extent.html
and
http://rankexploits.com/musings/2011/connelly-dekker-bet-actually-robs-got-a-very-good-chance-of-not-losing/
Gompertz fit is attractive since it matches the satellite record better than linear and quadratic and other trends, but also because it matches the “soft” landing that results from running simulations in GCMs :
http://www.realclimate.org/images/seaice10.jpg
Besides that, the onset of a Gompertz curve is exponential (and thus quadratic in the second factor), which matches with what one would expect for a system response with amplifying “positive feedbacks” (such as albedo feedback) in the Arctic climate system, as is also shown in the GCM results.
The only difference with GCM runs at this point is the timeframe on which they pan out : reality shows a much faster decline than climate models (although I understand that Dr. Stroeve’s new paper presents improved results there).
Still, using Gompertz fit, NSIDC Sept minimum extent in 2012 should be around 4.3 million km^2 :
http://neven1.typepad.com/blog/2012/06/naive-predictions-of-2012-sea-ice.html
Since the minimum this year will likely be shattering the 2007 record, and likely end up below 3.8, even the non-linear Gompertz fit seems overly optimistic at this point.
Needless to say that claims here of a ‘linear’ decline during the satellite record (or even a linear decline since the LIA as some suggest) leads to unrealistic numbers and thus is refuted by simple statistical analysis of observations over the past 33 years.
Hi Anthony,
I can understand why sea ice extent is impacted by the vagaries of weather (e.g., wind shifts, the presence of blocking highs etc.) and proximity to deep oceanic basins and continental land masses, but the current and sudden melt-back of the Arctic ice sheet seems somewhat odd, given that:
(1) Arctic sea ice extent and area during the 2011-12 winter season approached the mean for the period 1976 and 2006;
(2) The ocean temperatures across the entire Arctic Ocean and, in particularly, the Beaufort and Chukchi Seas, have been unremarkable throughout 2012;
(3) The ice sheet to the north of Nunavut (Canada) has remained relatively thick and intact. and
(4) The rate of melt-back in the Beaufort and Chukchi Seas has seemingly accelerated over the past month.
Prior to the start of May, things were proceeding along ‘normally’. The Siberian side of the Arctic (a region with an extensive land mass and relatively shallow and wide continental shelf) became free of ice well before the Northwest Passage started to open up – as it always does. However, at the start of May the Northern Hemisphere Jet stream started to fragment and has remained in this condition throughout the subsequent summer season.
Several questions for your climate and meteorological boffins:
(a) Why does the earth appear to be entering a cooling phase, with cooling greatest in the tropics (have a look at temperatures in Northern Australia, SE Asia, Hawaiian Islands etc.) followed by the mid-latitudes (e.g., southern Australia, southeast USA, South Africa), yet the Arctic region of the earth are experiencing well above-average temperatures?
(b) Given the above observations, why have the Beaufort and Chukchi Seas been stripped of their sea ice so quickly this year, yet the ice pack above Nunavut (which has thickened dramatically in the last couple of years) is experiencing little, if any, melt-back?
(c) What is disrupting the Jet Stream? Is this a cyclical (perhaps annual) event?
(d) What on earth is going on in Alaska and Northern Canada to account for the differences in summertime melt-back rate of the Arctic ice sheet?
It’s almost as though the earth is cooling from the equator (actually plane of the ecliptic). Could this be a further vindication of Svensmark’s hypothesis (e.g., an proportionately greater increase in low level cloud cover in the tropics than in higher latitudes)?
Regards,
Greg B.
It appears that my website is experiencing some difficulties, no idea why (?!).
My apology to anyone who could not access quoted links.