12 years ago, I pointed out to NSIDC in this post: Errors in publicly presented data – Worth blogging about?
Because they told me it “wasn’t worth blogging about” in this comment that was posted on WUWT by NSIDC’s chief research scientist, Dr. Walt Meier:
Anthony,
We’re looking into it. For the moment, we’ve removed the data from the timeseries plot.
You need to remember that this is near real-time data and there can be data dropouts and bad data due to satellite issues. While the processing is automatic, the QC is partly manual. Thus errors do happen from time to time and one shouldn’t draw any dramatic conclusions from recent data.
I’m not sure why you think things like this are worth blogging about. Data is not perfect, especially near real-time data. That’s not news.
Walt Meier
Research Scientist
NSIDC
In the prior thread I raised a question of why there was a large downward jump in sea ice extent on the graph presented by NSIDC’s Artic Sea Ice News page. The image below was the reason, a million-plus square kilometers of Arctic sea ice went missing. Note the blue line.

Click for larger image
Well, it turned out that is WAS worth blogging about and it WAS news, because the satellite sensor failed, as we published later:
It sure looks to me like it has happened again.

NSIDC says now:
NSIDC continues to investigate errors in our sea ice processing, and we are upgrading software to address the errors. Daily Sea Ice Index/Arctic Sea Ice News and Analysis values after February 19 are erroneous. We will post new data as soon as the software upgrades are implemented.
The old image from Feb 23rd they have on the website now only shows a dip.

But the interactive chart they have shows a clear dropout of data:

I wonder how long it will be before they fess up and say the satellite sensor has failed rather than bluster about “processing errors”?
Are the satellite monitors asleep on the job? 45 days!!
Why question something when it is yielding results that agree with your own predisposition? It is what they call “science” these days, after all.
its only been days, it as the last error that was 45 days
at least 14 days … and that is what people call “weeks” … as in a couple of weeks …
And how long has the sensor been causing low readings before it totally died?
It might be partially due to the fact that NSIDC employees have been working from home for a year and if any employee is concerned about COVID they can continue to do so at least through August.
Nah, busy celebrating Arctic ice loss…
Ah yes! I remember when NASA missed a chunk of sea ice the size of Texas. Arctic SHOCK: NASA reveals missing ice size of Texas in record ice melt | Science | News | Express.co.uk
They figured out what happened to it. It melted.
They’re blaming a processing error, and are upgrading software.
https://nsidc.org/arcticseaicenews/charctic-interactive-sea-ice-graph/
Antarctic seems unaffected.
Yeah, well the plot 12 years ago and now look identical. Doubtful they have a “processing error” with a dropout that steep. That was the claim years ago too.
They are probably a new batch of people, Walt has long since left NSIDC, so they have to learn all over again.
if I remember right the last time the error went the other way.
No, data dropout always goes toward zero.
Depends … with high speed testers, the application is often written to provide 99999V so that the data stands out from say 3mV.
That tends to get one’s attention.
Furthermore, given the evidence you have presented above, you have made a prima facie case for fraud. Thus, you shifted the burden of proof to the data fiddlers: it is now THEY who must prove their actions are legitimate.
(Just like some determined people must in Wisconsin, Michigan, Pennsylvania, Georgia, Arizona, and New Mexico ….. or their data fiddling will forever remain evidence of a gross injustice. )
Nice work, Anthony.
Welcome back Janice!
Theo! 🙂 Thank you 😊 Good to “see” you. Thank you for giving me the pleasure of being acknowledged.
I hope you are doing well and enjoying as I am the first, lovely, signs of Spring. Here, the daffodils still have their green jackets firmly tucked around them, but, the robins….. ah, the robins are singing their noble hearts out — even while all around them is cold and bleak.
I’ll second that!
Thanks, Steven 😊
I didn’t know Walt had left. Did Julienne also? I liked their posts on here years ago (even though they were wrong). What’s Walt doing now?
I facetiously posted on here recently that they were going to have to get Trofim Karl out of retirement and measure Arctic sea ice with ship’s buckets.
Gawd, what a clown show.
http://nsidc.org/data/seaice_index/images/daily_images/S_stddev_timeseries.png
There are missing data too
I don’t see a reference to processing error:
In the history of software development, we’ve often been called upon to implement “fixes” for hardware design problems. Even sometimes for hardware failures when it’ impractical to fix the hardware. NASA’s programmers have squeezed years of good data out of failing satellites.
I don’t see any blame either.
“I’m not sure why you think things like this are worth blogging about.”
It isn’t twelve years later either. But hey when you’re clutching at straws…
And maybe he should fix up his own blog before gratuitously sniping at others.
So says the Luddite who wants to shutdown energy production agriculture and manufacturing across the entire developed world. Too funny.
You respond by just making things up, what a loyal keyboard foot-soldier.
What a mindless ACDS cultist you are
Living in your own EVIDENCE-FREE little dodo-land. !
Ahh, you hate it when people point out the stupidity you are pushing. Stop pushing stupidity and no one can point out the stupidity you are pushing.
You truly are a low-life cretin, loy-dodo
All clutching at bard wired as you float in your empty fantasies down into the depths of anti-science and ignorance.
You remain a stinking empty sock.
Nothing to fix here, except getting rid of mental failures like you, loy-dodo.
2021-2009 = 12 years which is what wordpress puts on the article it’s right next to the clock dropkick … probably hard for an old blind lefty to see. You want to split hairs it’s 11 years and tax but hardly the point.
What we have established is you can’t evaluate 20 points on a graph and can’t do subtraction … so probably stay away from maths.
There was a notice to that effect. It’s gone now and the graph has gone back up, but the winter peak might have occurred during the suspicious alleged glitch.
NOAA is not to be trusted.
Antarctic systems are affected. No readings for several days. http://nsidc.org/data/seaice_index/images/daily_images/S_stddev_timeseries.png
Is “upgrading software” code for increasing the fudge factor / worse than we thought variable???
the data here
ftp://sidads.colorado.edu/DATASETS/NOAA/G02135/north/daily/data/
stops at 21/2/2021 after missing 20/2/2021 (I write dates in dd/m/year format)
if you add the “missing” to the actual value for 21/2/2021 you get a sensible value
—–
Data for SH stops at 25/2/2021, so Antarctic is affected
ftp://sidads.colorado.edu/DATASETS/NOAA/G02135/south/daily/data/
ps. MASIE is still functioning and is at 14.75 Wadhams
I just compared the data from Jan1st to Feb 19th – they are completely different, MASIE has greater surface than SIDADS
They measure different things. Different ice concentrations.
You wouldn’t expect them to give the same value.
They are not that different, though (nsidc “broke” around day 50))
ps, that dip starting around day 47 – 52 coincides with the intense cold through the USA..
There is only so much intense COLD to go around !
That is a very interesting observation. I know there was a blog about predicting the cold blasts but I did not get into it.
Does the drop off in ice provide an early indicator for a cold blast or it just an instrument problem?
Rick,
I suspect it is the flip-side to the USA deep freeze
Probably by wind-forced ice compaction.
But I can’t add the MASI data in my spreadsheet the time NSIDC lack data 😉 to hide the decline 😀
Try “Mike’s nature trick.”
I just add a second sheet withe these datas:
ftp://osisaf.met.no/prod_test/ice/index/v2p1/nh/osisaf_nh_sie_daily.txt
They are up to date, only in the 80th there are missing data.
Advantage, in contrast to NSIDC starting Oct 1978 with data only for each second day for 10 years, they start in Jan 1979 with daily data.
Good to know. Thanks.
Anthony
“Because they told me it “wasn’t worth blogging about” in this comment <strike>was</strike> posted on WUWT by NSIDC’s chief research scientist, Dr. Walt Meier:
Will the real northern sea ice extent please stand up:
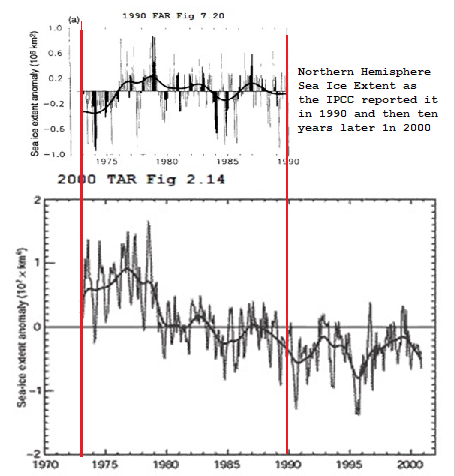
The 1973-1990 time line over a ten year period was substantially changed (worse than previously thought) later editions of the the IPCC’s assessment reports dropped the 1973 start date in favor of the high point in 1980. This sort of thing goes on endlessly in “Climate Science” and in broad daylight. More to the point, they are getting away with it.
They are getting away with it because the Climate Science they practice is not science. Magical thinking and ‘climate dowsing’ are better descriptors of what is going on.
Wow, I never new they completely eliminated the 1973 low. Amazing, and like the elimination of the MWP, without even a mention of the re-write?
It should never amaze me to see the depths of deception plumbed but it still DOES. These IPCC puppets have no respect for data. It gets adjusted to fit their models.
It is like a Ponzi scheme but here they can inflict incredible economic harm and come out the other side saying they fixed the problem; no more fossil fuel gives no more global warming. The problem though is weaning off fossil fuel is nothing short of genocide with the present heavy reliance on fossil fuels for survival – think of Texas a few days back!. Eventually enough people will realise nothing is changing before fossil fuels are no longer burnt. That is why indoctrinating the next generation is so important; keep feeding new minds the fantasy and encourage them to become their useful idiots.
@Steve Case: Comparing the 2 charts directly is apples-to-oranges. There are differences in baseline, in threshhold, in source attribution, and in scope of the data.
Baseline FAR=1973-1990 TAR=1973-1996
Threshold FAR=10% TAR=15%
SourceAtt FAR=NOAA TAR=Blend of Walsh ’78, Cavalieri et al 1997, Grumbine ’96
Scope FAR=Sea Ice TAR=Sea ice and Great Lakes Ice (Assel ’83)
As far as I know, the TAR was the only report which conflated Great Lake ice with Arctic Sea Ice extent. Personally, I think the authors were trying to obscure the low pre-1975 sea ice values by the conflation of the lake Ice, which also moved the anomaly baseline. I think the ‘Blending’ used in the TAR, which is not described in the text, further obscures the derivation of the charted values.
Best regards to all.
Sigh, it really is past time I make a pass through https://wattsupwiththat.com/reference-pages/sea-ice-page/ and fix the failed links and images.
At least more of it was working a month or so ago than I expected to see.
I guess this is a good place to solicit new stuff to add to the sea ice page.
At least the ENSO meter is still working. I wonder how I do that? [Dig, grep, ls, cat] Ah. Data download from the BoM in Australia every Monday. Last change was to the upload site in April 2019. Working fine.
> “we are upgrading software to address the errors”
People go to prison in most industries for changing accounting methods to address missing data.
In the financial services industry, this stuff sends people to an all-expense paid vacation to Club Fed, complete with orange jump suits.
And no parachutes!
… with attractive ensemble numbering!
Something has obviously “broken” somewhere in the data retrieval and processing chain
Why do you think “fixing it” should send people to prison ?
because they are lying about it being broken … they are no monitoring their data as they should be …
Until Rob D. returns…. my guess is RD was keying in on their “software (read: “coding”)” focus.
That is, that the hardware would be a more likely legitimate focus for investigation.
Translation of NSIDC’s previous snarky communication from Dr. Walt Meier to WUWT on this matter: How it that you common-folk at WUWT can scoop NSIDC’s scientists in quickly discovering problems with our data output . . . what, you really expect us to be bothered to examine our data more frequently than once every 45 days?
Hmmm . . . February 19, 2021 to March 3, 2021 (day of public announcement of latest “errors in our sea ice processing”) is a total of 12 days. I guess things at NSIDC have improved somewhat over the last 12 years.
I take a look at it every day just for S&G’s, not sure why they don’t look at there own data all the time.
they only looked because he asked …
That’s why I told Griff 4 or 5 days ago his sea ice death spiral was finally here!!!!!!
Griff is a day dreamer
Dreaming requires a functioning brain.
Yeah I posted that too. griff was correct that we’re all going to die of Arctic sea ice decline. Maybe we could ship some ice up there from Antarctica. Get a few penguin stowaways and the polar bears will have more food. A climate 2-fer. Do I get a prize?
Do be sure to text Pippin Kool, too. He or she used to go into all-caps, bold, hysterics over the Arctic.
“Keep your eyes on the Arctic people!!!!” P K
(when we asked her/him who “the Arctic people ” were — silence. Silent as the blink of the eye of the polar bear watching Pippin from 1 km across the ice.)
What, didn’t they pay their satellite bill? Can do that online now guys.
😛
Great, Greenland will be ice free by the end of the month.
Anyone interested in purchasing some valuable real estate, currently under only measly 5000 feet of a super-fast melting ice, eminently suitable for a palm-oil or banana growing plantation.
And you don’t even have to clear virgin rain forest for your planation!! What a bargain!
I want a plot with aircraft in it !!!
I know of one with a Nuclear reactor. How about that?
Errors happen if you drink too much bourbon every President’s Birthday.
How come NASA can identify a problem with a mars rover in hours and fix many problems in a few days but can’t do so for earth orbiting satellites?
The Mars rover is a new one, the satellites are years old and the documentation may be lost or are difficult to find. 😀
The repair manual accidentally got mixed in with material going to the shredder to avoid FOIA requests!
Because the rovers are products of, and operated by, The Jet Propulsion Laboratory, part of Cal Tech – a contractor to NASA.
who do you think built the satellite ?
Mars rovers aren’t politicized science.
There is no mandate to blame all our earthly problems on ‘little green men.’
There is a mandate to blame all our earthly problems on ‘orange man.’
oh, they can, but as the result of the malfunction can serve for a few great headlines before anyone catches on to the problem, they really don’t care. Retractions and corrections go on page 56 in the bottom corner in microfont, the original false articles are page 1 above the fold!
They have proven that they can’t fix all rover problems, and some of their tricks to work around failing subsystems in rovers likely don’t map to sensor units.
JPL spent months trying to get Spirit and Opportunity to respond before declaring their missions over.
https://www.sciencemag.org/news/2019/01/winds-fail-revive-nasa-s-opportunity-rover
I used to look at the sea ice page pretty regularly but it is basically useless now. Most of the graphs haven’t updated for months and the ones that have appear broken.
Other than these aberrations, it’s still updated daily (for the previous day). The interactivity is pretty cool (no pun intended).
I much prefer the actual data..
IIRC, the charting combines 3 or 4 things so is slightly different from the ftp site.
Due to La Niña, the temperature above the 80th parallel drops.
http://ocean.dmi.dk/arctic/plots/meanTarchive/meanT_2021.png
http://ocean.dmi.dk/arctic/plots/icecover/osisaf_nh_iceextent_daily_5years_en.png
At least the MASIE data has been updating daily and appears OK. I look at it from the ftp site every day when it updates the all-years 4km csv file, usually by 10:00 a.m. Eastern.
ftp://sidads.colorado.edu/DATASETS/NOAA/G02186/
Let’s see what happens.
NSIDC and MASIE not that dis-similar ..
NSIDC “broke” around day 50
The Danish Polarportal has this annotation on their Arctic Sea Ice Page:
MISSING DATA: Due to an error at the ground processing station, data from SSMIS sensors on board three DMSP satellites are missing for the period 19-23 February 2021. It is not clear whether this data can be reprocessed. The problem is not due to the Polar Portal. Note that these satellites are very old, the oldest more than 15 years, so it cannot be excluded that further problems occur in the future
Interesting. I also look at the DMI Polarportal pages for Arctic sea ice extent and ice volume every day, but did not pick up on the message you have quoted.
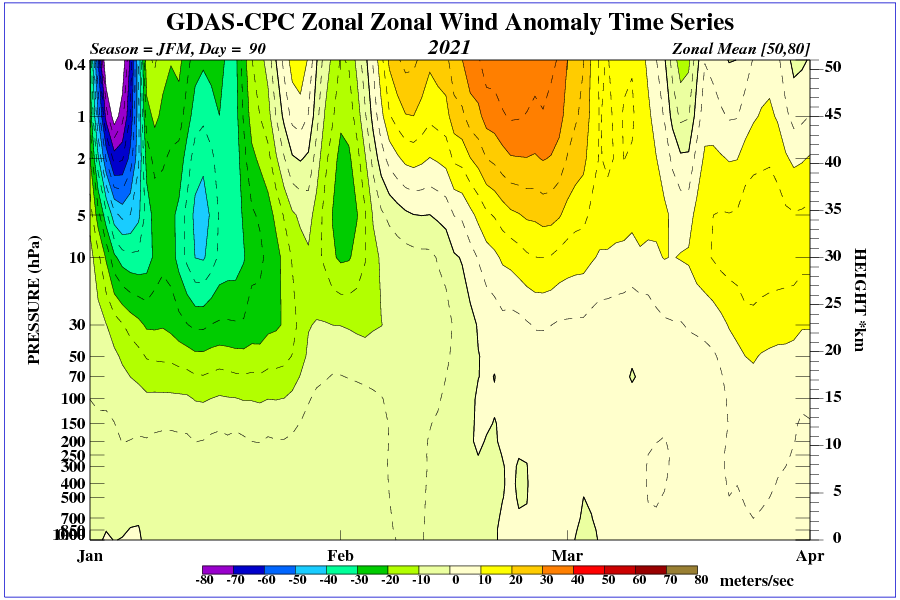
Currently, the stratospheric polar vortex has separated from the troposphere and La Nina will be the decisive influence on mid-latitude weather.
To the North, a huge high extends from northern Canada through Greenland and Iceland to Scandinavia. This is definitely not a temporary baric system.
Due to the high pressure, the temperature in Svalbard will be low.
https://www.wunderground.com/forecast/sj/ENSB
Data, schmata, we’ll just plot a line that fits the narrative
Entire Northern Hemisphere
Fred was right 14.75 Wadhams.
Arctic sea ice coverage dropped suddenly in mid-February, when the Arctic is dark most of the day, and there were snowstorms in Texas. Doesn’t make much sense…
The drop was also seen in MASIE (not mid Feb but late Feb)
And coincides with the extreme cold through the USA
Just the flip side of the errant polar vortex
It could be worse–we could be riding in Apollo 13.
With the BHO White House, we are all Columbia now — doomed but blissfully unaware of what is to happen.
That happened under Bush II…
Troposphere temperature in the Arctic dropped after the SSW.
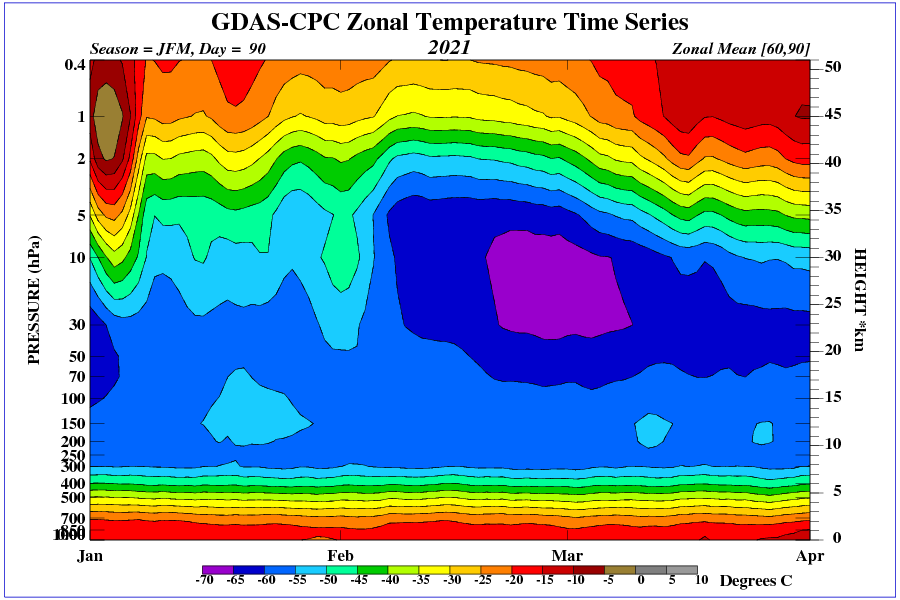
The temperature above the 60th parallel.
The polar vortex in the upper stratosphere recovered in the second half of February.
That was a _lot_ of heat headed to deep space!
The Adjustment Bureau simply got a little carried away with implementing the Biden-Harris-Obama WH directive to make the Arctic Sea Ice disappear. The WH needs to push the narrative on “climate change” in preparation for Biden’s April climate scam soiree.
Just like the 2015 Karl Pause Buster paper in a lead-up narrative to prep for Obama-Kerry pushing the Paris Agreement down American’s throats, this Sea Ice adjustment was done more clumsily and hastily.
During the SSW, the temperature increased only in the upper troposphere, but not at the surface.
This looks like a graph we are all familiar with. Maybe there was a late night sea ice dump? They should have just left the kink in and kept going as usual. (lol)
Someone let the UN know before another emergency meeting of the security council is called. They might call it anyway “out of an abundance of caution’ with special testimony by NY health experts and the NY AG.
The DMI chart showed a rapid decline at the end of February which they fixed on 24th Feb.
That “dip” coincides with the freezing temps through the USA and other places.
Also seen in MASIE sea ice.
Just the polar vortex playing games.
The other thing to realise is that these drops may not be melt, but ice area compression by wind.
Beyond the data glitch, I have from time to time compared NSIDC to DMI. They purport to measure the same things (Arctic sea ice extent defined as >15% ice coverage), but don’t get the same results. Scientific measurements should be independently repeatable. So this is more ‘climate science’ in the same category as sea level rise acceleration.
Rud, they use different resolutions. I wouldn’t expect them to be the same.
Where can I get the DMI data?
I used to have the volume data, but they stopped making it public, just showing their graph instead.
Ocean.dmi.dk/arctic/index.uk.php will get you the index to their full suite of data and graph products. Just click on whatever you want to see. I have the index site bookmarked on my iPad.