PART1 – (part 2 comes later today is NOW ONLINE HERE)
I’ve been noting with some humor the anticipation of a new Arctic sea ice extent minimum in the Alarmosphere. Yesterday, the frustration that there hasn’t been any major announcement yet bubbled to the surface in the form of a Michael Mann tweet, who was upset that NSIDC is making him wait:

Today though, looking at the NSIDC extent graph, he seems happy, declaring it “official”:

NSIDC made an announcement a few minutes ago, just as I started writing this post (and for that reason I’m publishing this post in two parts, see below):
Arctic sea ice appears to have broken the 2007 record daily extent and is now the lowest in the satellite era. With two to three more weeks left in the melt season, sea ice continues to track below 2007 daily extents.
Arctic sea ice extent fell to 4.10 million square kilometers (1.58 million square miles) on August 26, 2012. This was 70,000 square kilometers (27,000 square miles) below the September 18, 2007 daily extent of 4.17 million square kilometers (1.61 million square miles).
Here’s the plot, annotation mine:

Predictably, Seth Borenstein is already practicing for the big story he’ll be writing any minute now, and, the money quote he uses is just as predictable:
Data center scientist Ted Scambos says the melt can be blamed mostly on global warming from man-made emissions of greenhouse gases.
Neither Borenstein nor NSIDC’s current announcement mentions the massive Arctic storm that broke up huge amounts of sea ice, making this new record low possible. NSIDC said on August 14th:
As of August 13, ice extent was already among the four lowest summer minimum extents in the satellite record, with about five weeks still remaining in the melt season. Sea ice extent dropped rapidly between August 4 and August 8. While this drop coincided with an intense storm over the central Arctic Ocean, it is unclear if the storm prompted the rapid ice loss.
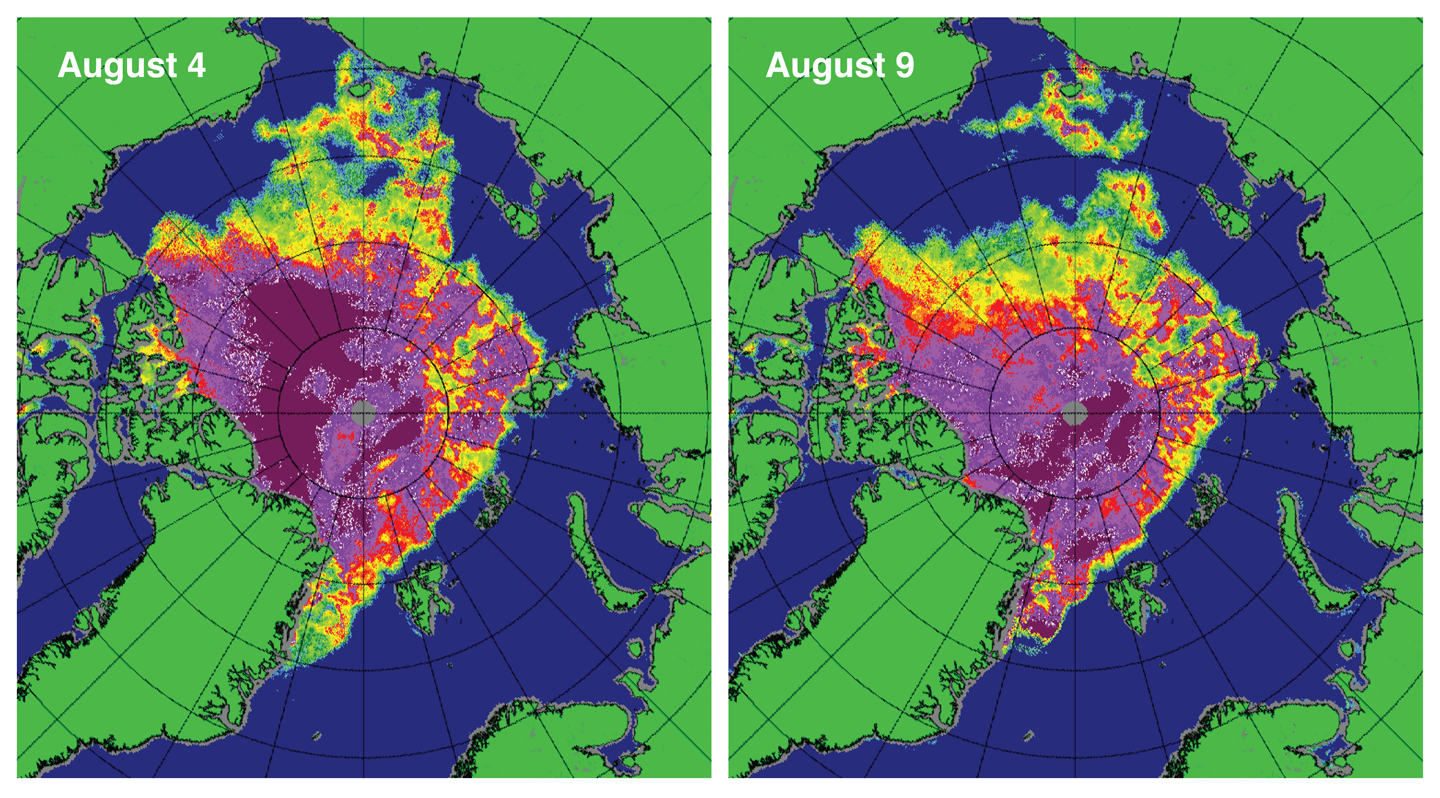
Unclear? Hmmph. Further down they dub it: “The Great Arctic Cyclone of 2012” and provide this before and after image:

Figure 4. These maps of sea ice concentration from the Special Sensor Microwave Imager/Sounder (SSMIS) passive microwave sensor highlight the very rapid loss of ice in the western Arctic (northwest of Alaska) during the strong Arctic storm. Magenta and purple colors indicate ice concentration near 100%; yellow, green, and pale blue indicate 60% to 20% ice concentration.
Credit: National Snow and Ice Data Center courtesy IUP Bremen
Calling the reason “unclear” seems more than a bit disingenuous to me, especially when you don’t mention it again.
It should be noted that in the ARCUS sea ice forecast submitted on August 5th, both NSIDC and WUWT forecasts agreed at 4.5 million sqkm. Clearly NSIDC didn’t expect this storm nor its effects, because if they had, their forecast would have been much lower.
In part two of this post, later today, I’ll share some other interesting things I’ve found that suggests NSIDC and the media aren’t telling you the full story right now.
Julienne Stroeve says:
August 27, 2012 at 12:32 pm
“Theo, we don’t have the data/analysis in at this point to say exactly what the storm did (i.e. what sizes of floes did it break the ice-pack up into, what were the SSTs, how far were the ice floes transported, how much thick the ice was when it was broken up, how much melt happened as the ice pack spread out, etc. etc.”
Thank you. That is exactly what I wanted to know. When some important facts about the storm’s effects are known then we can have a delightful scientific discussion of them. Until then any discussion of the present ice melt is based on an incomplete set of facts.
Entropic man says:
August 27, 2012 at 1:07 pm
Timing of abrupt climate change: A precise clock
Many paleoclimatic data reveal a ∼1,500 year cyclicity of unknown origin. A crucial question is how stable and regular this cycle is.
—————————
Mr. Watts, your last link describes a 1470 year periodicity in which 12 successive events occur quite evenly spaced. According to Figure 1, each shows a rapid increase in temperature, followed by a slightly slower decline back to normal. The last, 10,000 years ago, showed a rapid increase as before, but then a sustainded rise continuing to the present. Something has changed.
_____________________________
It is called an interglacial. Remember? The Holocene is about 10,000 years old.
10,000 year Greenland Ice Core Graph
15,000 year Greenland Ice Core Graph
For the layman, E. M. Smith goes into the 1500 year cycles during the Holocene in detail in several articles accessed here. (Click on the titles for each article)
Kodos and thanks to Walt Meier and Julienne Stroeve for joining the discussion at WUWT!
When the cycle turns and we begin to get more ice, not less, will those so eager to jump on this as “proof” of AGW return to ‘fess up that they got it wrong? I doubt it somehow, but I do hope they prove me inaccurate. It’d be nice to see some adults the warmist crowd.
Moser: “You better think about that argument because you’ll have to make it in the not too distant future.”
No, Steve, it’s you alarmists who are claiming there is a problem and must FIRST show evidence of such problem! Get to work, Steve!
This is science, it’s unfortunate that I, a non-scientist, understand it’s underpinnings better than you.
New Oxford Dictionary: “problem”
“1 a matter or situation regarded as unwelcome or harmful and needing to be dealt with and overcome : ….”
There is no problem with the melting ice but the normal ones. There is only money, politics and a government-suckling culture. Climates go through periods of change AND STABILITY and ALWAYS HAVE. The very words “Climate Change” it should simply be “Climate”; change goes without saying. Like Wet Water.
Also, I note that your writing skills improve when you are talking about yourself.
Did I just read a fully paid up govt scientist poo-poo the idea we need 60+ years to see potential earth system cycles? Really? Jesus wept.
Smokey says:
August 27, 2012 at 12:02 pm
Entropic,
I posted a chart that is based on raw temperature data. The fact that you wish to reject it indicates a closed mind.
————————————
Smokey, there are two problems with your argument, the chart itself and its context.
This is your chart.
http://img141.imageshack.us/img141/3241/spannualkq5.png
The linear trend drops from -49.3 to -49.6 from 1958 to 2008, a decrease of 0.3C and a rate of change of 0.006C per year. By eye, I would estimate the 2 sigma boundaries at about =/-1.5C, a range between -47.95C and -50.95C . This is the range of variation from year to year which would be regarded as normal, regardless of any trend.(Always show these error bars if your software can generate them. If you include error bars, your charts are more likely to be taken seriously). With the error bars so much larger than the trend you are trying to demonstrate, your claim is not justified by the data.
You claim that if the Arctic is warming , the South Pole should be warming. The two are not comparable.
The Arctic is an ocean, partly surrounded by land. It interacts strongly with the Atlantic, the Pacific, Europe, Asia, North America and Greenland.This links it closely with weather, seasonal and climatic changes elsewhere.
The South Pole is the centre of a continental ice sheet 3000 metres thick, surrounded by ocean. It is isolated from outside influences by the winds and currents of the Southern Ocean, by the Polar Vortex, by its high latitude and by its high altitude. This is the last place on Earth likely to be affected by any climate change( though the West Antarctic Peninsula and some other coastal margins are showing signs of change).
Some history on Arctic warming.
Of note, the Arctic has been warming since the mid to late 19th century. Warming was particularly strong in the 1920/30s based on actual measurements.
http://www.colorado.edu/geography/class_homepages/geog_4271_f11/readings/week_12_13_serreze_barry_arctic_amp.pdf
The minimum wouldn’t have looked half as scary if the books hadn’t been cooked to stop the line crossing normal earlier this year.
I’ve been concerned for a while about the propaganda benefits for warming proponents that would ensue from any further reduction of Arctic ice below 2007.
They have been on tenterhooks for some years because of the failure of it to happen sooner.
I felt it was perfectly possible that it might happen on one or more occasions before the oceans shed the accumulated energy from the 20th century reduction in cloudiness , zonal jets and high solar activity.
What does surprise me is the recent closeness of the Arctic ice trend to the ups and downs of ENSO ten years previously.
1997 was a powerful El Nino year and 2007 was a high melt season.
1997 to 2001 was mostly La Nina and from 2007 to 2011 Arctic ice generally recovered a little.
2002 was another El Nino year and 2012 we have another high melt season.
So, for the future:
If the correlation holds then we have La Ninas in 2003 and 2004 so I’d expect an Arctic ice recovery for a couple of years then another dip to close to 2012 levels in 2015 which is ten years after the last real El Nino spike in 2005.
From 2005 to 2012 La Nina became more dominant so we should see a proper ice recovery from 2015 onwards perhaps encouraged by what will by then be a weakening AMO.
All we can do is wait and see.
Bookmark this post for future reference.
Just curious: how is the thickness? In 2007 we saw a “record” minimum sea ice by surface area but over the summer there was actually increasing thickness in the area that remained covered — a result of the high winds that caused the reduced surface area: the ice essentially stacked up. So satellite images showed less ice, whereas the total volume was close to “normal”, just concentrated in a smaller area.
I think this is an important consideration, and I’m personally a bit tired of seeing area figures bandied about in isolation from this more meaningful context.
Glaciers maximum in Norway last 11.000 years was aprox around 1750.
Glacier maximum at Svalbard last 11.000 years was aprox around 1910-20.
If the cooling in the LIA was not synchronized, why must the warming since be?
The BBC News at 10:00 pm laid it on pretty thickly. Apparently we can blame 30% of the ‘warming’ on ‘natural causes’; the rest of it…shock horror…is down to us. Hmmm.
Gail Combs says:
August 27, 2012 at 2:33 pm
It is called an interglacial. Remember? The Holocene is about 10,000 years old.
10,000 year Greenland Ice Core Graph
15,000 year Greenland Ice Core Graph
For the layman, E. M. Smith goes into the 1500 year cycles during the Holocene in detail in several articles accessed here. (Click on the titles for each article)
—————————————
Fair enough for the Holocene change10,000 years ago.
My main puzzling thought was that the 1500 year cycle which brings the temperatures up to interglacial levels briefly every 1500 years odd shows up well in the glacial period, but shows up much less clearly in the Holocene record.
I wonder what causes it. I cannot recall a 1500 year periodicity in any of Earth’s orbital parameters, or in the solar system’s dynamics. If it is a 1500 year cycle of solar activity, why does it warm glacial Earth by 5C and interglacial Earth by less than 1C?
BTW….Alarmosphere…I like it.
Why does the NSIDC graph bottom out at 2 million square kilometers? It should be 0.
Visually, the ice graph looks worse with the bottom y axis set to 2.
question says:
August 27, 2012 at 2:11 pm
Not really,
Including 2012 over the past decade average surface and troposphere global temperatures don’t show an increase.
http://www.woodfortrees.org/plot/uah/from:2002/plot/rss/from:2002/plot/hadcrut3gl/from:2002/plot/hadsst2gl/from:2002/plot/uah/from:2002/trend/plot/rss/from:2002/trend/plot/hadcrut3gl/from:2002/trend/plot/hadsst2gl/from:2002/trend/plot/gistemp/from:2002
This period included a few record low Arctic ice minimums, yet the majority overall show a decline in overall global temperatures.
Ocean temperatures during the same period using hadsst2 are decreasing both globally and in the NH and SH.
http://www.woodfortrees.org/plot/hadsst2gl/from:2002/plot/hadsst2nh/from:2002/plot/hadsst2sh/from:2002/plot/hadsst2gl/from:2002/trend/plot/hadsst2nh/from:2002/trend/plot/hadsst2sh/from:2002/trend
On the last point, internal modes are extremely important and can be mainly determined using ocean cycles and global albedo. It still stands with ingoing and outgoing radiation not changing; CO2 is not having any noticeable overall affect during this period. An internal energy change includes the oceans, so it has not been left out. The surface energy left over from an El Nino eventually moving towards the Arctic contributed towards the melting. Looking at DMI over recent years melting from below the ice would have to be the main factor. The AMO already mentioned on previous posts is also a significant candidate.
One word: pathetic.
Get over it, guys.
Please, let’s all move on to the real debate: what to do about this problem?
Only one and a half MILLION SQUARE MILES of sea ice left!
Do I look bothered?
Elizabeth says:
August 27, 2012 at 2:24 pm
All I can say there ain’t no global warming there hasn’t been any for 16 years check out AMSU satellite temps 600mb compare all years, So how in hell is global warming causing NH ice to melt.?…
_________________________________
I would agree with Vukcevic. The ice is melting from the bottom due to a warm AMO. The actual air temperatures are not really high enough for much melting. link The only other options are sublimation from a more energetic sun or a break-up of the ice by storms and then the ice being transported out of the pole areas to melt as happened in 2007.
No one bothers to tell the public that the summer sea ice is not like a frozen lake you can skate on in the winter. Instead it is ICEBERGS. They are looking at Ice where there is 15% or more icebergs. Note second line under the title in this graph
Arctic Sea ice extent 30% or greater (DMI) graph
This graph gives you an idea of how much of the arctic is solid ice and how much is actually icebergs floating in the sea. link and this satellite photo of August really brings it home link (this is sea ice thickness for the last winter link )
Note that NONE of the Arctic Sea Ice experts who posted here have bothered with this simple explanation. Instead we are lead to believe it is a solid sheet of ice that has been broken up by the storm because it was so thin.
And this comment:
The IMS sensor is able to supply sea ice charts for 2007 and 2012 on a like for like basis.
Is there similar 2007 maps as a suitable comparators for the other charts ?
Has there been any change in sensing techniques that might cause such a pronounced divergence ?
rogerknights says:
August 27, 2012 at 10:54 am
Anthony, we can also go back somewhat reliably until 1953, –Julienne
What’s holding back release of ice-extent-estimates based on the pre-1979 military satellites? (Along with sample photos of extremes from that range.)
Roger the data are available. NSIDC only has the ESMR-SMMR-SSMI-AMSR data, but Had1SST has the data back to before 1900. Anyone can access the data.
Robbie says:
“…you only come up with a bunch of newspaper articles as ‘proof’ for your own claims.”
Yes. Newspaper accounts and direct observations are what we have. And TonyB has posted extensive accounts of global warming and cooling going back to Greek times.
On the other hand, you have nothing in the way of scientific evidence to support your CO2=CAGW belief system.
I note that neither you, nor any other climate alarmist has posted any scientific evidence showing that human emitted CO2 is the cause of global warming. When your belief is based on ZERO testable evidence, doesn’t it make you wonder if you might be wrong?
Nah, probably not. Beliefs are comfortable things.
• • •
Entropic wins the 2012 Joel D. Shore Award for his non-stop complaints about charts I post. If it wasn’t the error bars, he would complain about something else.
[Background: A year or two ago Joel Shore complained about a chart I had posted, so I found fifty (50) more charts that showed the same thing, from about 40 different sources, and posted them. Joel Shore found fault with every one of them! Some folks just don’t like what the real world is telling them. So, Entropic, carry on…]
Its great that WUWT is still running the
Arctic Sea Ice Nearly Disappears September 22nd, 2012 – 26 days to go.
story – clearly designed to try and poke fun at a date specific prediction.
Lets hope the story stays up and is revamped for the next few years, because the spiral of decline in area, extent and volume towards zero looks set in.
The comments some have made in this thread that this arctic sea ice decline is “local” are ignorant of the fact that:
“Notably, it was the warmest July on record for the Northern Hemisphere, where the majority of Earth’s land mass is located. This is the fourth month in a row that the Northern Hemisphere has set a new monthly land temperature record”
http://www.ncdc.noaa.gov/sotc/global/
As I posted previously, if current trends continue we can expect to see the north pole become ice free before the whole arctic becomes ice free in late summer. The thickest ice remains along the Greenland and Ellesmere Island coasts.
Comparing with September 2007, then ice remained locked on to the islands on the Siberian side of the arctic, but this year there is open water there and currently there is a developing area of open water and weak ice penetrating towards the pole from the Siberian side.
http://arctic.atmos.uiuc.edu/cryosphere/deetest/deetmp.19546.png
Steven Mosher’s post was spot on – if it does go to zero, what will the “anything but warming” camp come up with to explain it ?
A “screaming arctic” is a bit over the top, but maybe a better analogy is an alarm sounding. Its sensible to check to see why an alarm is sounding rather than try to ignore it or dismiss it because of misplaced belief that “it cannot be for real”.
Entropic man says: @ur momisugly August 27, 2012 at 1:07 pm
Timing of abrupt climate change: A precise clock
Many paleoclimatic data reveal a ∼1,500 year cyclicity of unknown origin….
____________________________
Gail Combs says: @ur momisugly August 27, 2012 at 2:33 pm
It is called an interglacial. Remember? The Holocene is about 10,000 years old…..
—————————————
Entropic man says: @ur momisugly August 27, 2012 at 3:04 pm
Fair enough for the Holocene change10,000 years ago.
My main puzzling thought was that the 1500 year cycle which brings the temperatures up to interglacial levels briefly every 1500 years odd shows up well in the glacial period, but shows up much less clearly in the Holocene record.
I wonder what causes it. I cannot recall a 1500 year periodicity in any of Earth’s orbital parameters, or in the solar system’s dynamics. If it is a 1500 year cycle of solar activity, why does it warm glacial Earth by 5C and interglacial Earth by less than 1C?
________________________________
I think you get the broad swing during the glacial and a much lesser swing during an interglacial because the earth’s feedback mechanisms put an upper limit on the high temperature.
The paper itself points to something completely outside of the earth as the “clock” Dr Nir J. Shaviv comments on The Milky Way Galaxy’s Spiral Arms and Ice-Age Epochs and the Cosmic Ray Connection So I would hazzard a SWAG that there is something in our galactic neighborhood that is effecting the earth’s climate on a 1470 year period. A comet maybe?
It is obvious we are still collecting all the factors that effect the earth’s climate. I do not thing saying X% is due to the sun or CO2 or H2O or Cosmic Rays or Geomagnetic variations can be done until we know all the factors first.