PART1 – (part 2 comes later today is NOW ONLINE HERE)
I’ve been noting with some humor the anticipation of a new Arctic sea ice extent minimum in the Alarmosphere. Yesterday, the frustration that there hasn’t been any major announcement yet bubbled to the surface in the form of a Michael Mann tweet, who was upset that NSIDC is making him wait:

Today though, looking at the NSIDC extent graph, he seems happy, declaring it “official”:

NSIDC made an announcement a few minutes ago, just as I started writing this post (and for that reason I’m publishing this post in two parts, see below):
Arctic sea ice appears to have broken the 2007 record daily extent and is now the lowest in the satellite era. With two to three more weeks left in the melt season, sea ice continues to track below 2007 daily extents.
Arctic sea ice extent fell to 4.10 million square kilometers (1.58 million square miles) on August 26, 2012. This was 70,000 square kilometers (27,000 square miles) below the September 18, 2007 daily extent of 4.17 million square kilometers (1.61 million square miles).
Here’s the plot, annotation mine:

Predictably, Seth Borenstein is already practicing for the big story he’ll be writing any minute now, and, the money quote he uses is just as predictable:
Data center scientist Ted Scambos says the melt can be blamed mostly on global warming from man-made emissions of greenhouse gases.
Neither Borenstein nor NSIDC’s current announcement mentions the massive Arctic storm that broke up huge amounts of sea ice, making this new record low possible. NSIDC said on August 14th:
As of August 13, ice extent was already among the four lowest summer minimum extents in the satellite record, with about five weeks still remaining in the melt season. Sea ice extent dropped rapidly between August 4 and August 8. While this drop coincided with an intense storm over the central Arctic Ocean, it is unclear if the storm prompted the rapid ice loss.
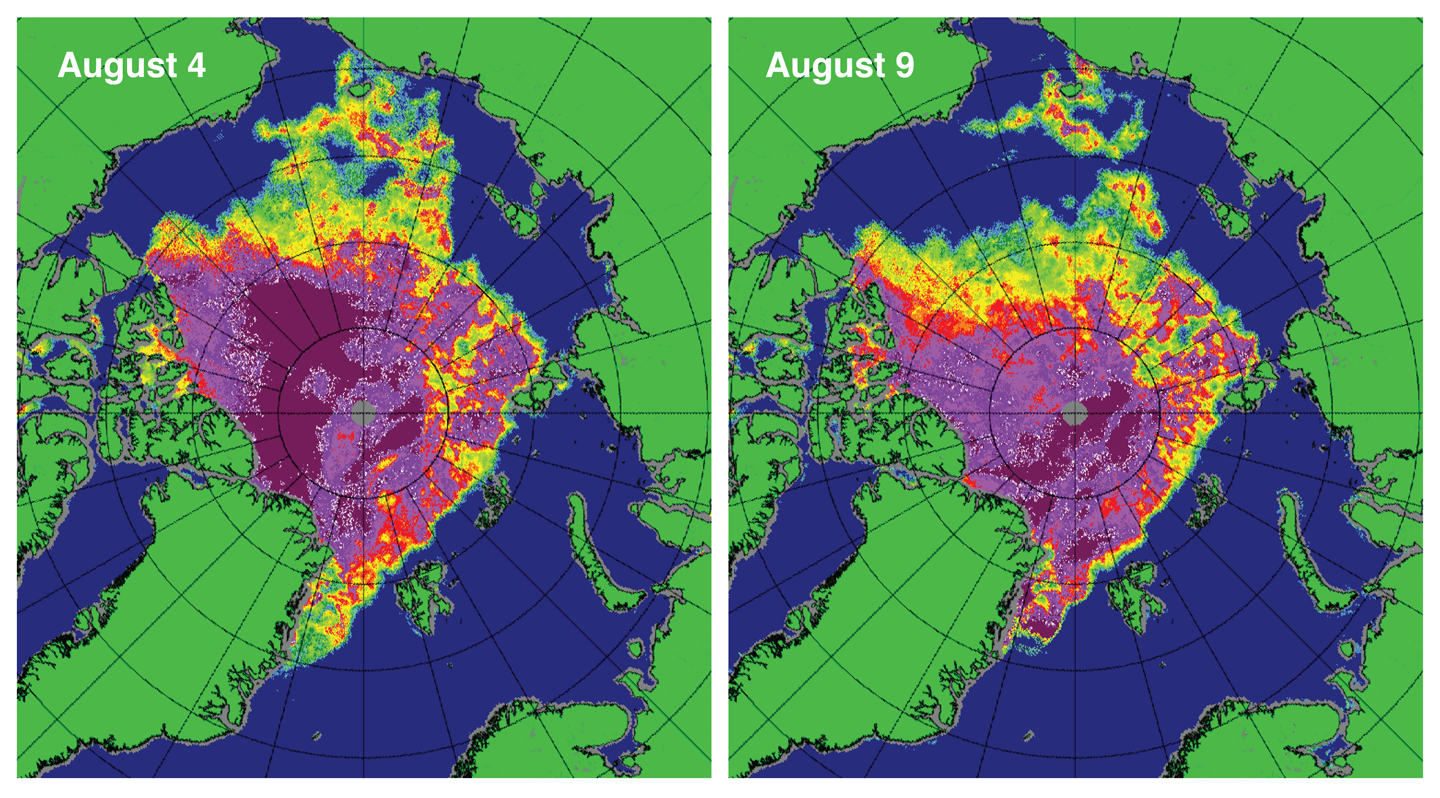
Unclear? Hmmph. Further down they dub it: “The Great Arctic Cyclone of 2012” and provide this before and after image:

Figure 4. These maps of sea ice concentration from the Special Sensor Microwave Imager/Sounder (SSMIS) passive microwave sensor highlight the very rapid loss of ice in the western Arctic (northwest of Alaska) during the strong Arctic storm. Magenta and purple colors indicate ice concentration near 100%; yellow, green, and pale blue indicate 60% to 20% ice concentration.
Credit: National Snow and Ice Data Center courtesy IUP Bremen
Calling the reason “unclear” seems more than a bit disingenuous to me, especially when you don’t mention it again.
It should be noted that in the ARCUS sea ice forecast submitted on August 5th, both NSIDC and WUWT forecasts agreed at 4.5 million sqkm. Clearly NSIDC didn’t expect this storm nor its effects, because if they had, their forecast would have been much lower.
In part two of this post, later today, I’ll share some other interesting things I’ve found that suggests NSIDC and the media aren’t telling you the full story right now.
Gail Combs says:
August 27, 2012 at 12:10 pm
Anchorage Alaska had record snows last winter and the snow was not melting out.
—————————
I do not have isobar charts handy for the US this year, but I did encounter a reference to Notherly winds giving Washington and North California a cooler Summer. The same airflow may have given Alaska its unusually cold weather.
With the jetstream locked at high latitude over the Eastern US and at low latitude over Europe for much of 2012, did Alaska and the US West coast get stuck with a low latitude jetstream and the colder weather to match?
Jim P. says:
August 27, 2012 at 12:34 pm
I see Mosher trolling in the comment threads again. Sorry Steve, if heat is causing the Arctic to melt, then the Antarctic should also be melting.
————————————
It is. The GRACE satellite data records a loss of 246Gt/yr and rising.
http://ess.uci.edu/researchgrp/velicogna/files/increasing_rates_of_ice_mass_loss_from_the_greenland__and_antarctic_ice_sheets_revealed_by_grace.pdf
JohnB says:
August 27, 2012 at 9:56 am
REPLY: Thanks Walt, have you ever considered we may be at/near the bottom of a natural cycle? How can you rule that out without data much beyond 30 years? There’s historical anecdotal evidence of very low Arctic sea ice in the past where you have no data. – Anthony
——————-
Anthony, what evidence would that be?
+++++++++++++++++++++++++++++++++++
Stuff like that is one reason most geologists laugh at the CAGW crap. Here is a Greenland graph.
A WUWT article on another paper link
And here is a paper Temperature and precipitation history of the Arctic
And another
And another
@DaveE – “Within 5° of the pole & no ice, that’s 300nm.
As I recall Syedoff was frozen in on Dec 18th & free again by Valentines day 1939.”
The article you link to says that the Syedoff had been frozen fast in polar ice for fourteen months, meaning some time about the beginning of October, 1937. They had been drifting – locked in polar ice – ever since. They were 300 nautical miles from the pole – in ice. They had to worry about being attacked by polar bears, which had not swum across open ocean to within 300 miles of the pole.
This article says nothing about extent of Arctic Ocean ice in the late 1930s, unless you can plot where the ship froze in, back in ’37. You now have one data point for 1937. Error bars? It isn’t science without error bars…
Julienne Stroeve says:
August 27, 2012 at 10:11 am
BillD, we have a new paper just published: http://www.agu.org/pubs/crossref/2012/2012GL052676.shtml
This paper compares the next round of climate models with the observations. They better represent the mean state of the ice cover than the models in 2007 IPCC report, and they also generally simulate faster rates of decline, though many are still slower than observed. Interestingly though is that the uncertainty as to when an ice-free Arctic may be realized remains about the same in the earlier models.
Thanks Julienne: it’s good to know that scientists are able to keep up with the speed of the ice melt. Sometimes reading climate blogs, one gets the impression that climate scientists and the IPCC are exagerating the rateof climate change and warming, not underestimating it. On the other hand, good scientific estimates are likely to be too high in some instances and too low in others.
To Gail @ur momisugly 8/27, 12:10PM:
“I was thinking the same thing.”
It gets worse! Open Arctic also means “Ocean Effect” albedo enhancing snow in Northern EurAsia; somewhat less in Northern Canada for geographical reasons, but snow nonetheless.
Result? 70% of lingering sunlight (and its energy content) before it gets totally dark, gets reflected off the Earth. The Polar high pressure system gets colder and larger, and when parts of it sweep through North America and EurAsia, Gulf, Atlantic, & Mediterranean moisture sweeping into it falls as albedo enhancing snow.
Polar temperatures drop by 10 degrees F (as they did in winter 2007-2008) and Arctic ice will appear to recover next year as a result. But the 4 & 5 year Multiyear ice is gone and won’t come back, so watch for succeeding repeat performances in the future.
The die has already been cast, and CO2 was not calling the roll, as you can see by following:
http://www.colderside.com/Colderside/Temp_%26_CO2.html
Ewing and Donn figured it out a half century ago. Soon many more will!!!
Timing of abrupt climate change: A precise clock
Many paleoclimatic data reveal a ∼1,500 year cyclicity of unknown origin. A crucial question is how stable and regular this cycle is.
—————————
Mr. Watts, your last link describes a 1470 year periodicity in which 12 successive events occur quite evenly spaced. According to Figure 1, each shows a rapid increase in temperature, followed by a slightly slower decline back to normal. The last, 10,000 years ago, showed a rapid increase as before, but then a sustainded rise continuing to the present. Something has changed.
In my August 27, 2012 at 11:19 am comment I suggested a connection between Antarctic melting and the superwarming your links describe. Can you suggest possible candidates driving these changes, beyond the vague “natural variability” so beloved of sceptics writing here.
Has this WUWT article been cited yet?
http://wattsupwiththat.com/2012/05/02/cache-of-historical-arctic-sea-ice-maps-discovered/
It’s worth remembering the Arctic ice has been melting much quicker than the models predicted over the past decade, therefore with global temperatures not increasing during the same period this is very likely down to a change in the distribution of energy around the planet. This can therefore only be blamed on the natural cycle when distribution of energy (internally) over time periods are concerned. When the outgoing radiation and ingoing radiation hasn’t changed. Hence, this behaviour has not shown to be caused by CO2.
Smokey says: August 27, 2012 at 11:27 am
I see Smokey: Newspaper articles is real science, isn’t it?
You are demanding from Julienne Stroeve evidence “per the scientific method (testable, quantifiable scientific evidence)” and you only come up with a bunch of newspaper articles as “proof” for your own claims.
http://www.ngu.no/en-gb/Aktuelt/2008/Less-ice-in-the-Arctic-Ocean-6000-7000-years-ago/ (from the link in your first comment I replied to)
“However, the scientists are very careful about drawing parallels with the present-day trend in the Arctic Ocean where the cover of sea ice seems to be decreasing.
“Changes that took place 6000-7000 years ago were controlled by other climatic forces than those which seem to dominate today,” Astrid Lyså believes.”
It looks like you can’t even read either. Now what does Astrid Lyså think which forces could be responsible for the current trend in the Arctic Ocean?
Mosher, The Gremlin you search was pointed out by Vukcevic.
http://www.vukcevic.talktalk.net/Sun-Earth.htm
I would think that multi year ice will be removed more effectively by warmer sea temperatures from below than by warmer air temperatures from above.
I can see plenty of benefits to an ice free Arctic. Lets harvest those clathrates.
Entropic Man. And yet temperatures have been declining in the Antarctic for years. Perhaps you’re thinking that the present cool / ice house multi million year climate phase is coming to the end of it’s cycle, to be replaced by the hot house phase for the next 30+ million years.
Ray says:
August 27, 2012 at 12:37 pm
“The ice extend graph is not very consistent with the Mean Temperature above 80°N graph showing constant below zero temperatures and also the webcams showing refreezing for a while…”
If you click on the graph it will take you to another page with a chart of all the graphs starting in 1958. Looking at each year, the Mean Temperature above 80N is almost the same every year. If the temperature has been almost the same each year since 1958 obviously it is not the temperature that is the main cause of more ice melt. Must be something else. Perhaps Vuk is right after all.
David A., aka DaveE
@ur momisugly11:39
Sorry, David, I did not mean to imply or suggest the idea was original with me, nor did I mean to not give credit where and if due.
My main point was to agree with your comment about Walt M.
The rest I added as sometimes an idea expressed in a different wording may help the argument along. Also, I think P.G.’s “notrickzone” is a nifty site with an emphisis on German and European activities – he translates a lot of things from German to English, thus making it available to a wider audience – well, me anyway.
—————————————-
JohnB says @ur momisugly 11:02
“I started there, and found: “useful data . . .” ”
[Until you can measure something and express it in numbers, you have only the beginning of understanding. Lord Kelvin]
Let’s assume I’m cutting firewood on the edge of my property and a mountain lion is watching me from the riparian zone not far away. My neighbor sees both of us but doesn’t bother to tell me so because she doesn’t know if it is one cougar or 2 or 3, doesn’t know its age, or sex, or when its last meal was. And she doesn’t know if I have seen the cougar and don’t care. She’s got no “useful data!”
In any case, others have pointed to many places for you to look. Maybe you can see something useful there.
Has the ice melted or has it simply spread out more so that more of it is excluded from the 15% calculation? I don’t know and I suspect none of the scientists know. It is a breathtaking assumption to say that it has melted from the evidence available, especially given the likelihood that the storm would contribute to a spreading of the ice components.
If this had occurred earlier in the year then there would have been a good chance that this reduced concentration of ice would be more vulnerable to melting, but given the lateness of the season the chances are that it won’t.
For what it is worth, my opinion is that we will see a much quicker increase in the total ice extent once the freeze sets in because of the greater extent of less concentrated, but still present, ice.
Entropic man says:
August 27, 2012 at 1:07 pm
…..
No mystery, temperature changes in the seas north of Greenland – Scotland ridge is not determined by short summer irradiation or CO2, but by the warm currents inflow. In the open seas warm inflow raises air temperature and in the iced area melts ice from below.
Temperature of the inflow is determined by the AMO (N.Atlantic SST) which happens to be at the multi-decadal peak , and may stay at high values for up to another decade (has 9 year short cycle) but it is expected than to fall back due to medium term 64-5 year cycle. Is there a longer centuries long cycle, it is not known.
Don’t worry guys. There will be a new record…
Tomwys. you said “But the 4 & 5 year Multiyear ice is gone and won’t come back, so watch for succeeding repeat performances in the future.”
But only if you ignore the fact that the AMO is still in a warm phase and will go to a cold phase in a few years. You also ignore the fact the sun is currently at or near it’s low maximum and is expected to have a long slow decline over the next few years.
The combined effect will put paid to Arctic alarmospherism. Get your crampons ready, you may be able to walk from Greenland to Iceland.
Tom in ice free Florida says:
August 27, 2012 at 1:39 pm (responding to)
Ray says:
August 27, 2012 at 12:37 pm
“The ice extend graph is not very consistent with the Mean Temperature above 80°N graph showing constant below zero temperatures and also the webcams showing refreezing for a while…”
If you click on the graph it will take you to another page with a chart of all the graphs starting in 1958. Looking at each year, the Mean Temperature above 80N is almost the same every year. If the temperature has been almost the same each year since 1958 obviously it is not the temperature that is the main cause of more ice melt. Must be something else. Perhaps Vuk is right after all.
What is the final link to that composite graph of the DMI data?
Anthony and others concerned about this summer’s storm, do you recall the storm of summer 2008 around the same time of year? On 29 July a storm originated in northern Siberia and slowly moved into the Chukchi and Beaufort seas. It reached a maximum intensity of 976 hPa (this year it was 964 hPa). The storm lingered over the Chukchi Sea along a closed track and during its weakening phase moved into the Beaufort Sea along the ice edge and eventually into the central Arctic where it dissipated. SSTs decreased as the storm moved into the region, the maximum decrease was as much as 2C in the coastal waters of the southern Beaufort Sea. No significant SST response was seen in the area covered by sea ice. The vertical mixing was enhanced by high winds associated with the storm that brought cold water to the surface in the coastal Beaufort Sea. In addition, the increased vertical mixing increased the mixed layer by about 5m. During the storm, the extent didn’t show the large changes it did this August. Satellite ice thickness show thinner ice this year than in 2008 – a reason why the August 2012 storm could impact the ice like it did.
All I can say is ice holes!
http://psc.apl.washington.edu/northpole/NPEO2012/WEBCAM2/ARCHIVE/npeo_cam2_20120729123519.jpg
http://psc.apl.washington.edu/northpole/NPEO2012/18.jpg
Entropic man says:
August 27, 2012 at 12:38 pm
…. With the jetstream locked at high latitude over the Eastern US and at low latitude over Europe for much of 2012, did Alaska and the US West coast get stuck with a low latitude jet stream and the colder weather to match?
__________________________________
I farm and am outside a lot and pay close attention to the weather both on the radar (Wundergound) and while outside. Normally the weather is from the west. In the last few years it has changed from being mostly from the west to all over the place. This is consistent with a change in the jet stream patterns from zonal to meridional flow. The blocking high over Russia in 2010 that caused a heat wave and the blocking high this year over the US midwest are typical of the meridional flow. This would seem to indicate the Dust Bowl of the 1930’s was also a time of meridional flow.
Vukcevic shows the AMO was in the same spot in the cycle graph in the 1930’s as it is in right now. The PDO however is in a different part of the cycle: graph from ftp://eclipse.ncdc.noaa.gov/pub/ersstv3b/pdo/pdo.1854.latest.situ.v3b.ts
A discussion on the PDO.
So perhaps S. Wilde is correct and it is driven by the change in the amount of energy into the tropical oceans from the sun.
@Matt G:
I’m glad you agree that Arctic ice has been melting and melting very quickly. Even a quick analysis of the ice volume dataset shows this pretty unequivocally.
The second part of your paragraph, however, is misleading. It depends on your definition of “global temperature”. Averaged global surface temperature does show a continued increase if 2012 and 2011 are included. But much more important, if ocean temperatures are included then the “global mass averaged temperature” is definitely increasing.
Finally, your last sentence is not correct. CO2 forcing on a complex system like the climate is not so simple. As you allude to earlier, internal modes are extremely important. And those internal modes are causing significant ocean heating and increased storm action. Since much of the ice thinning is due to subsurface melt, the ocean temperatures cannot be dismissed so casually.
Roger Harrabin has just been granted prime time News at Ten to tell the world that this is incontrovertible proof of CAGW. Apparently we are all doomed unless we give the UN all our money.
You might almost think he had been chatting with his ‘friends’.
All I can say there ain’t no global warming there hasn’t been any for 16 years check out AMSU satellite temps 600mb compare all years, So how in hell is global warming causing NH ice to melt.? Soot maybe yes may play a part so we will concede that one to the environmentalist
Dear me, predictions come in all sizes and types. In fact 4 out of the 5 key objections here were predicted back on August 12 and like pavlovs dogs, WUWT gladly ranted their hearts out.
The only prediciton which did not get fulfilled was sensor failure…. I must admit I’m a little surpised as WUWT always claims that DMI sensors have failed every time it drops like a stone. Funny satellites those which fail and then start working perfectly when eggshell thin ice re-forms very rapidly very late in the season….
However Anthony you are bending the truth, yet again. NSIDC is almost the LAST record to fall. Not the first or the only. But, of course, you had to wait until the situation settled enough before you could start spreading your poison so it would be believable.
I see a trend here. People on the board keep saying we’re recovering from the little ice age and so there should be a melt. Yet there is a second and almost constant thread which says that ice is recovering. These two opinions are diametrically opposed yet everyone here seems to think they make the case in two different ways.
WUWT has been making constant noise about how the ice is NOT melting yet the WUWT submissions for SEARCH have dropped by 1msqkm between 2007 and now.
Pinnoccio methinks your nose is growing.
As the weeks go on and the ice does not recover, you will, again, say absolutely nothing. You will only perk up again when the temperature drops to -100 for a week and generates 6 inches of flash frozen ice in a sudden spurt. Then again it’ll be a sudden and “unprecedented” re-freeze of the ice. Never mind the fact that the ice will not reach the 2006/9 low ice winter levels. The fact that the average winter temperatures around Greenland will be 30C – 40C higher than normal over a period of weeks, no let’s ignore all that.
Only on WUWT could the arctic sea loose heat all winter but not gain heat in the summer, creating a net effect of cooling which will then melt even MORE ce the following year.
Escher had nothing on the logic of WUWT. But of course it’s not logic is it. It is simply making any claim which could possibly be believed by anyone so that an incredible and impossible claim can be upheld.
True to form and true to type. Eeven more so as the whole site lacks logic so badly that nobody can see the basic inconsistency of the position. One key message I use to make people wake up and understand the position is the basic inconsistency of the denailosphere arguments. Argue one thing one day and another the day after. Never cross check to see if you are making sense, what good would that do? Belive me you make my case much more focibly than I could. All I have to do is point out the basic inconsistency of sites like this and I have people convinced.
What thousands of graphs and billions of lines of data will not do for the common person, WUWT does for me perfectly.
Keep it up. It helps me enourmously.