Guest Post by Willis Eschenbach
Although it sounds like the title of an adventure movie like the “Bourne Identity”, the Bern Model is actually a model of the sequestration (removal from the atmosphere) of carbon by natural processes. It allegedly measures how fast CO2 is removed from the atmosphere. The Bern Model is used by the IPCC in their “scenarios” of future CO2 levels. I got to thinking about the Bern Model again after the recent publication of a paper called “Carbon sequestration in wetland dominated coastal systems — a global sink of rapidly diminishing magnitude” (paywalled here ).
 Figure 1. Tidal wetlands. Image Source
In the paper they claim that a) wetlands are a large and significant sink for carbon, and b) they are “rapidly diminishing”.
So what does the Bern model say about that?
Y’know, it’s hard to figure out what the Bern model says about anything. This is because, as far as I can see, the Bern model proposes an impossibility. It says that the CO2 in the air is somehow partitioned, and that the different partitions are sequestered at different rates. The details of the model are given here.
For example, in the IPCC Second Assessment Report (SAR), the atmospheric CO2 was divided into six partitions, containing respectively 14%, 13%, 19%, 25%, 21%, and 8% of the atmospheric CO2.
Each of these partitions is said to decay at different rates given by a characteristic time constant “tau” in years. (See Appendix for definitions). The first partition is said to be sequestered immediately. For the SAR, the “tau” time constant values for the five other partitions were taken to be 371.6 years, 55.7 years, 17.01 years, 4.16 years, and 1.33 years respectively.
Now let me stop here to discuss, not the numbers, but the underlying concept. The part of the Bern model that I’ve never understood is, what is the physical mechanism that is partitioning the CO2 so that some of it is sequestered quickly, and some is sequestered slowly?
I don’t get how that is supposed to work. The reference given above says:
CO2 concentration approximation
The CO2 concentration is approximated by a sum of exponentially decaying functions, one for each fraction of the additional concentrations, which should reflect the time scales of different sinks.
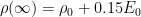
So theoretically, the different time constants (ranging from 371.6 years down to 1.33 years) are supposed to represent the different sinks. Here’s a graphic showing those sinks, along with approximations of the storage in each of the sinks as well as the fluxes in and out of the sinks:
 Figure 2. Carbon cycle.
Now, I understand that some of those sinks will operate quite quickly, and some will operate much more slowly.
But the Bern model reminds me of the old joke about the thermos bottle (Dewar flask), that poses this question:
The thermos bottle keeps cold things cold, and hot things hot … but how does it know the difference?
So my question is, how do the sinks know the difference? Why don’t the fast-acting sinks just soak up the excess CO2, leaving nothing for the long-term, slow-acting sinks? I mean, if some 13% of the CO2 excess is supposed to hang around in the atmosphere for 371.3 years … how do the fast-acting sinks know to not just absorb it before the slow sinks get to it?
Anyhow, that’s my problem with the Bern model—I can’t figure out how it is supposed to work physically.
Finally, note that there is no experimental evidence that will allow us to distinguish between plain old exponential decay (which is what I would expect) and the complexities of the Bern model. We simply don’t have enough years of accurate data to distinguish between the two.
Nor do we have any kind of evidence to distinguish between the various sets of parameters used in the Bern Model. As I mentioned above, in the IPCC SAR they used five time constants ranging from 1.33 years to 371.6 years (gotta love the accuracy, to six-tenths of a year).
But in the IPCC Third Assessment Report (TAR), they used only three constants, and those ranged from 2.57 years to 171 years.
However, there is nothing that I know of that allows us to establish any of those numbers. Once again, it seems to me that the authors are just picking parameters.
So … does anyone understand how 13% of the atmospheric CO2 is supposed to hang around for 371.6 years without being sequestered by the faster sinks?
All ideas welcome, I have no answers at all for this one. I’ll return to the observational evidence regarding the question of whether the global CO2 sinks are “rapidly diminishing”, and how I calculate the e-folding time of CO2 in a future post.
Best to all,
w.
APPENDIX: Many people confuse two ideas, the residence time of CO2, and the “e-folding time” of a pulse of CO2 emitted to the atmosphere.
The residence time is how long a typical CO2 molecule stays in the atmosphere. We can get an approximate answer from Figure 2. If the atmosphere contains 750 gigatonnes of carbon (GtC), and about 220 GtC are added each year (and removed each year), then the average residence time of a molecule of carbon is something on the order of four years. Of course those numbers are only approximations, but that’s the order of magnitude.
The “e-folding time” of a pulse, on the other hand, which they call “tau” or the time constant, is how long it would take for the atmospheric CO2 levels to drop to 1/e (37%) of the atmospheric CO2 level after the addition of a pulse of CO2. It’s like the “half-life”, the time it takes for something radioactive to decay to half its original value. The e-folding time is what the Bern Model is supposed to calculate. The IPCC, using the Bern Model, says that the e-folding time ranges from 50 to 200 years.
On the other hand, assuming normal exponential decay, I calculate the e-folding time to be about 35 years or so based on the evolution of the atmospheric concentration given the known rates of emission of CO2. Again, this is perforce an approximation because few of the numbers involved in the calculation are known to high accuracy. However, my calculations are generally confirmed by those of Mark Jacobson as published here in the Journal of Geophysical Research.
“Thanks, Bart. So … where in your derivation do we find the part about the division of the atmosphere into partitions, each of which has a different time constant? That’s the part that seems problematic to me”
Where he says:
“Thus, the fraction a/(a+b) of H accumulates in the atmosphere, and b/(a+b) accumulates in the oceans. The total a/(a+b) + b/(a+b) = 1, so all of it either ends up in the land or in the oceans.”
If a fraction a/(a+b) stays in the air, the time constant for the transfer only applies to the CO2 transferred, which is a proportion b/(a+b) of the total atmosphere.
Some have said that the rate has to be proportional to the total CO2 content of the atmosphere, but this isn’t true. The rate is proportional to the difference in concentrations of the source and destination reservoir, like conductive heat flow is proportional to the difference in temperatures, electrical current is proportional to the difference in voltages, water flow is proportional to the difference in heights, etc.
And the difference between the atmosphere and one sink may be different to the difference between the atmosphere and another sink.
The other thing being assumed is that the CO2 transferred has no effect on the level of CO2 in the sink, that it acts like an infinite void, or an idealised thermodynamic cold sink that can absorb any amount of heat without changing temperature. While there’s no doubt the ocean is a lot bigger than the atmosphere, it’s not infinitely bigger, and to start with only the top layer of the ocean is affected. The level in the sink increases as it absorbs CO2, and the rate of flow is proportional to the difference in levels. So the flow pushes the source to decrease and the sink to rise until they converge on an intermediate level, when flow stops. It’s not because the reservoir is full, or saturated. It’s simply because the levels are equal. If you add more CO2, it will go up again. If you keep adding CO2 it will go up continuously. Stop and the flow will slow and stop, but it decays away exponentially to the intermediate level, not the original level. (A fraction a/(a+b) stays in the air.) This is at some fraction of the difference between them, and that’s where the apparent partitioning comes from.
I’ll try the tanks example with some numbers, in case that helps. Tanks A and B have 1 square metre horizontal cross sections, but are very tall. Tank C has a 98 square metre cross section, and is again tall. The level of water in all three tanks is 3 metres. We now dump a pulse of 3 cubic metres into tank A. Instantaneously the level in that tank doubles to 6 metres. Very quickly, because of the wide pipe connecting them, A drops to 4.5 metres and B rises to 4.5 metres as 1.5 cubic metres of water flows between them. Note that the 3 cubic metres added has been partitioned – half of it has transferred and half stayed. Only 1.5 metres is affected by the rapid exponential decay. Then over a far longer period, the 4.5 metres in A and B equalises with the 3 metres in C. 3 cubic metres (2x(4.5-3)) is spread evenly over 100 square metres, for an equilibrium depth of 3 centimetres. Tanks A and B slowly drop to 3.03 metres, and C even more slowly rises to 3.03 metres. There is 3 cm of permanent rise.
None of the tanks are full. If you dump another three cubic metres into tank A, half of it will still drain into tank B just as rapidly as before. The sink is not saturated, its capacity for absorption not reduced. You could dump 300 cubic metres into it and half would still transfer to B with the same rapid rate constant. But only half.
Willis and others:
I understand the interest in the Bern Model because it is the only carbon cycle model used by e.g. the IPCC. However, the Bern Model is known to be plain wrong because it is based on a false assumption.
A discussion of the physical basis of a model which is known to be plain wrong is a modern-day version of discussing the number of angels which can stand on a pin.
I again point to our 2005 paper which I referenced in my above post at May 6, 2012 at 3:58 pm. As I said in that post, agreement of output of the Bern Model requires 5-year smoothing of the empirical data for output of the Bern Model to match the observed rise in atmospheric CO2 concentration.
The need for 5-year smoothing demonstrates beyond doubt that the Bern Model is plain wrong: the model’s basic assumption is that observed rise of atmospheric CO2 concentration is a direct result of accumulation in the air of the anthropogenic emission of CO2, and the needed smoothing shows that assumption cannot be correct.
(Please note that – as I explain below – the fact that the Bern Model is based on the false assumption does NOT mean the anthropogenic emission cannot be the cause of the observed rise of atmospheric CO2 concentration.)
I explain this as follows.
For each year the annual rise in atmospheric CO2 concentration is the residual of the seasonal variation in atmospheric CO2 concentration. If the observed rise in the concentration is accumulation of the anthropogenic emission then the rise should relate to the emission for each year. However, in some years almost all the anthropogenic CO2 emission seems to be sequestered and in other years almost none. And this mismatch of the hypothesis of anthropogenic accumulation with observations can be overcome by smoothing the data.
2-year smoothing is reasonable because different countries may use different start-dates for their annual accounting periods.
And 3-year smoothing is reasonable because delays in accounting some emissions may result in those emissions being ‘lost’ from a year and ‘added’ to the next year.
But there is no rational reason to smooth the data over more than 3-years.
The IPCC uses 5-year smoothing to obtain agreement between observations and the output of the Bern Model because less smoothing than this fails to obtain the agreement. Simply, the assumption of “accumulation” is disproved by observations.
Furthermore, as I also said in my above post, the observed dynamics of seasonal sequestration indicate that the system can easily absorb ALL the CO2 emission (n.b. both natural and anthropogenic) of each year. But CO2 is increasing in the atmosphere. These observations are explicable as being a result of the entire system of the carbon cycle adjusting to changed conditions (such as increased temperature, and/or addition of the anthropogenic emission, and/or etc.).
The short-term sequestration processes can easily absorb all the emission of each year, but some processes of the system have rate constants of years and decades. Hence, the entire system takes decades to adjust to any change.
And, as our paper shows, the assumption of a slowly adjusting carbon cycle enables the system to be modelled in a variety of ways that each provides a match of model output to observations without any need for any smoothing. This indicates the ‘adjusting carbon cycle’ assumption is plausible but, of course, it does not show it is ‘true’.
In contrast, the need for smoothing of data to get the Bern Model to match ‘model output to observations’ falsifies that model’s basic assumption that observed rise of atmospheric CO2 concentration is a direct result of accumulation in the air of the anthropogenic emission of CO2.
Richard
Willis and others:
I write this as an addendum to my post at May 7, 2012 at 2:09 am.
As several people have noted, the Bern Model is one example of a ‘plumbing model’ of the carbon cycle (personally, I think Engelbeen’s is the ‘best’ of these models).
Adjustment of the carbon cycle is akin to all the tanks and all the pipes varying in size at different and unknown rates. Hence, no ‘plumbing model’ can emulate such adjustment.
And the adjustment will continue until a new equilibrium is attained by the system. But, of course, by then other changes are likely to have happened so more adjustment will occur.
Richard
Bart,
Not sure about the infinite expansion.
I think the number of decaying exponentials is the number of reservoirs minus one.
It’s a system of coupled first-order linear differential equations. If we put the levels in all the n reservoirs into an n dimensional vector L, the homogeneous part is dL/dt = ML for some matrix of constants M. This can be diagonalised dL/dt = (U^-1 D U) L so we can change variables d(UL)/dt = D(UL) and the coupled equations are separated into independent differential equations each in one variable. Once we’ve solved for the variables UL, we can transform back to the original variables.
The matrix is of rank n-1, since we lose one degree of freedom from the conservation of mass. We therefore ought to get n-1 decaying exponentials for n reservoirs.
So if we stop all fossil fuel CO2 the level of CO2 in the atmosphere would drop. There would be a modest fall in global temperature. At what level would the amount of CO2 in the atmosphere stabilise? And as the natural processes of the carbon cycle continue then
1) What is the source of CO2 to maintain stability as the natural sequestering processes would continue as sediments fall below the earth’s surface? Is it essentially just volcanoes?
2) Based on this stable level of atmospheric CO2 what reduction in biogrowth would we expect vs current levels of CO2?
3) What limits would such a fall put on potential global agricultural production vs projected growth in world population?
4) Should we be capturing carbon now so that when carbon fuels run out we can inject CO2 into the atmosphere to maintain agricultural production levels?
Its not clear to me whether the various carbon sinks are acting in series or parallel.
Let’s say the ocean is a fast carbon sink and plankton photosynthesis is a slow carbon sink. The ocean takes up CO2 and then plankton remove it from the water and it sinks to the deep. An initial pulse of CO2 would be reduced quickly, but the ocean would become saturated, then there would be a long tail as the plankton removed it at the same rate as there was further uptake by the ocean.
Is this going in the right direction? Don’t know enough myself.
Thanks Willis for responding to my comment, which was based on a misunderstanding of the link I gave. But what an interesting post, question and comments. I learn something new here every day.
The question, ” what is the physical mechanism that is partitioning the CO2 so that some of it is sequestered quickly, and some is sequestered slowly?” seems to be unanswerable, which perhaps makes the Bern Model wrong and therefore its use by the IPCC wrong.
Particularly as “there is no experimental evidence that will allow us to distinguish between plain old exponential decay (which is what I would expect) and the complexities of the Bern model”.
The Svensmark paper mentioned carbon dioxide being scarce when supernovas were high based on the idea that plants dislike carbon dioxide molecules containing carbon-13, which were then absorbed by the ocean. But this doesn’t seem relevant so apologies if I’m talking through my proverbial.
I look forward to your further posts on sinks and the e-folding time. You have that rare knack for getting straight to the heart of a theory.
son of mulder:
At May 7, 2012 at 2:49 am you ask;
“So if we stop all fossil fuel CO2 the level of CO2 in the atmosphere would drop. There would be a modest fall in global temperature. At what level would the amount of CO2 in the atmosphere stabilise?” etc.
I answer;
Please read my above post at May 6, 2012 at 3:58 pm because it explains why it is not possible for anybody to provide an answer to any of your questions (although some people claim they can).
Richard
Published in January 2008 at
http://icecap.us/images/uploads/CO2vsTMacRae.pdf
Excerpt:
The four parameters ST (surface temperature), LT (lower tropospheric temperature), dCO2/dt (the rate of change of atmsopheric CO2 with time) and CO2 all have a common primary driver, and that driver is not humankind.
Veizer (2005) describes an alternative mechanism (see Figure 1 from Ferguson and Veizer, 2007, included herein). Veizer states that Earth’s climate is primarily caused by natural forces. The Sun (with cosmic rays – ref. Svensmark et al) primarily drives Earth’s water cycle, climate, biosphere and atmospheric CO2.
Veizer’s approach is credible and consistent with the data. The IPCC’s core scientific position is disproved – CO2 lags temperature by ~9 months – the future cannot cause the past.
Faux Science Slayer says
The oceans do NOT absorb CO2 from the atmosphere
——–
The measurements says otherwise.
Allan McRae,
Nice analysis! Temperature variations cause a lagged CO2 response because of the solubility pump’s dependence on temperature. But CO2 change is contributed to by many sources and sinks, and just because one component is caused by temperature doesn’t mean all the others are.
You might find it useful to plot a graph of the correlation coefficient between temperature and lagged CO2 as a function of the lag. That’s the usual way to make lagged relationships clear.
A long time ago I worked on developing an inverse technique for deducing isotope concentrations based on the results of degassing experiments on minerals. It turned out to be mathematically equivalent to a constrained numerical inversion of the Laplace transform. Unfortunately, this is known to be an incredibly ill-conditioned problem. The bottom line is that simultaneously deducing the distribution of amounts AND half-lives from decay data (either radioactive decay or CO2 concentration decay) is incredibly difficult and the uncertainties are enormous because the functions you are using to model the decay (a series of exponentials) are far, far from being orthogonal. Any negative exponential can, to excellent accuracy, be approximated by a sum of other exponentials with different decay rates. You can either deduce decay rate if you know you have a single (or at least very simple but known) combination of reservoirs, or you can deduce the amounts in different reservoirs if you know their decay rates independently. You just can’t to both things simultaneously to any useful degree. I would be quite skeptical of anyone who purported to do both.
I notice that the little cartoon diagram fails to include the sequestration as concrete sets.
Bill Tuttle says:
May 6, 2012 at 10:15 pm
….They’re also a large and significant source of methane. As for the “rapidly diminishing” part, I can only assume they believe that any (cue scary music) sea level rise (cut scary music) will cover existing wetlands (aka, “tidal swamps”) without creating new ones…
________________________________
The “rapidly diminishing” part also sticks in my craw. In the USA swamps are busy forming as the !@ur momisugly#&* beaver dam up streams and creeks. My pretty little creek is now a large multi-acre swamp despite the power company having a guy trap over two hundred beaver in one year. The nearest city, with a drinking water inlet just down stream from the outlet of my creek, now has a Giardia/Beaver Fever problem according to the county Inspections Department guy I asked.
I should also note that the beaver dam raised the water table so high that along with the beaver pond there is now an additional 40 acres that is too soggy to support the lob lolly pine that had been growing and the field beyond the pines is also too wet to plow. That is just on my land. It does not include the addition hundred or so acres belonging to my neighbor.
I should also add about this to the “rapidly diminishing” part.
Running water performs three closely interrelated forms of geologic work:
1. Erosion
2. Transportation
3. Deposition
As rivers erode the river bed the angle of incline becomes lower. In “old age” or where a river/stream dumps into a lake, pond or ocean you get flood plains with low relief across which the water flows meander causing braided channels, deltas and marshes. As the eroded sediment is dumped into lakes and ponds they fill and the later stages are swamps and marshes.
Mankind using dredging can to some extent modify this geologic progression but with “wetlands protection” in many advanced western countries “rapidly diminishing” stopped thirty years ago and has more likely changed to “rapidly advancing” ever since.
In 1971, the international Convention on Wetlands was adopted…The Ramsar List of Wetlands of International Importance includes nearly 2,000 sites, covering all regions of the planet.
In other words this is a recycling of the old “Boogy Man” from the 1960’s for a new generation of ignorant bleeding hearts who are unfamiliar with the complex tangle of international treaties, conventions and accords.
(BTW bleeding hearts is not a derogatory term, it is the con-men using people’s compassion that I have the problem with. Civilization requires EDUCATED bleeding hearts to keep the predators in check. Most people on WUWT fit the category of educated bleeding hearts, or we would not give a darn what happens to future generations.)
The integral is a convolution of the emission history with an impulse response function. If you get a pulse of emissions and then nothing, the emission falls further and further behind, t-t’ gets larger and larger, and the impact of the emissions is given a large negative weighting, shrinking it. It does decay.
 of
of  which we’ll assume was established in the distant past so that it is constant, the concentration will be the following:
 (1)
(1)
 . That is an absurdity on the face of it — surely there is a natural rate
  that would maintain an equilibrium CO_2 concentration, within noise, on all time scales, and equally certainly it won’t take the Earth thousands of years or even hundreds to find that equilibrium. Indeed, I’ve written a very simple linear model for — at least in a linear response model in which exponentials are themselves appropriate — how the equilibrium concentration must depend on the input and total decay rate. My model, gentlemen, will reach follow equilibrium wherever the input might take it. The Bern model, my friends, has no equilibrium —
  increases without bound for any input at all, and not particularly slowly at that.
No, it doesn’t. I understand perfectly well what this model does. If we feed it:
as input — your “emissions pulse” (which we’ll have to assume is uniformly applied, since I imagine that it takes times commensurate with the shortest decay time to mix a bolus through the entire atmosphere) — then it states that — given an initial concentration at
and we are right back where we started, asking why the bolus of CO_2 that was added at time $t_0$ came with four labels and is removed by a sum of exponential processes acting on labelled partial fractions of the whole.
There are two things immediately apparent about this. First, no matter how long you wait, the asymptotic behavior of this is:
It does not decay. This is a monotonically growing model and if it were true we would see CO_2 inexorably increase over the ages because even the 171 year time scale is absurd — it really says that we keep 40% of every delta function “blip”, every breath, the foam from every beer, in the atmosphere, indefinitely. It says that almost 30% of the gasp of breath Albert Einstein exhaled when he first realized that Planck’s quantum hypothesis could explain the photoelectric effect is still with us, not just 30% of the molecules but 30% of the additional concentration that it represented. There is no rate of addition of CO_2 that can lead to equilibrium with this solution but zero.
If this doesn’t strike you as being a blatently political but well-concealed scientific lie, well, you are very forgiving of a certain class of error.
Error, you say? Yes, error. Obvious error. If you will check back to my first post — and Bart’s remarks, if he will take the time to go back and check them, and K.R.’s remarks as he accuses Willis of being less than sincere — it appears that we all agree that there is no way in hell atmospheric CO_2 concentration will decay as a sum of exponentials because this is a horrendous abuse of every principle that leads one to write down exponential functions in the first place. CO_2 does not come with a label, and decay processes act on the total concentration to reduce it until equilibrium is reached. The only conceivable correct local behavior is the product of competing exponentials, never the sum.
Now, it was asserted (by K.R. and perhaps Bart, hard to recall) that the integral presented wasn’t really the sum of exponentials but something way complicated that does in fact arise from unlabelled CO_2 in some math juju magic way. By presenting you with the actual integral of a delta function bolus of CO_2, I refute you. Perhaps K.R. can apologize for his use of “disingenuous” to describe Willis’ stubborn and correct assertion that it did. I have never known Willis to be anything but sincere…;-)
Now, it would be disingenuous to continue without an actual explanation of two things:
a) Why anyone should take seriously a model that cannot — note well cannot — ever produce an equilibrium given a non-zero input function
b) Far up above, I thought that we all agreed that a model that consists of a weighted sum of exponentials acting on partial fractions of the partial pressure was absurd and non-physical, because CO_2 does not come with a label and each process, being stochastic and proportional to the probability of a CO_2 molecule being presented to it, proceeds at a rate proportional to the total CO_2 concentration, not the “tree fraction” of it. I have now conclusively proven that hiding that behavior in a convolution does not eliminate it from the model. What, as they say, is up with that?
The onus is therefore upon any individuals who wish to continue to support the model to start by justifying equation (1) above for a presumed delta function bolus. A derivation would be nice. I want to see precisely how you arrive at a sum of exponential functions each acting on a partial fraction of the additional CO_2, with a “permanent” residual.
rgb
[Formatting fixed … I think. w.]
Some have said that the rate has to be proportional to the total CO2 content of the atmosphere, but this isn’t true. The rate is proportional to the difference in concentrations of the source and destination reservoir, like conductive heat flow is proportional to the difference in temperatures, electrical current is proportional to the difference in voltages, water flow is proportional to the difference in heights, etc.
Yes, but in order for the model to be correct, none of the reservoirs can be in contact with absolute zero, and if the model doesn’t permit the attainment of equilibrium on a reasonable time scale and in a reasonable way, it is just wrong. So why, exactly, will the biosphere adjust its equilibrium upwards? Why won’t the ocean follow the temperature instead of some imagined “fractional difference” leading it to an every higher base equilibrium concentration? Noting well that the total atmospheric CO_2 is just a perturbation of oceanic CO_2 so that for all practical purposes it is an infinite reservoir.
rgb
rgbatduke,
Thanks for the extensive reply. I’ll try to take each of your points systematically. Let me know if I miss anything important.
Your equation (1) contains a number of negative exponentials, which decrease in value over time. That’s what I meant by “decay”.
I already explained why it came with four ‘labels’. Because there are effectively five reservoirs, and five coupled linear ODEs.
Yes, the asymptotic behaviour is that $0.15 E_0$ remains. That’s partly because I think some very slow decay terms are being approximated, and partly because mass is conserved, and if you add CO2 to a system then the total amount of CO2 in the system must increase.
This doesn’t include Einstein’s last breath, though, because that’s part of the exchanges being modelled. The exchange with the biosphere reservoir includes both plants growing and animals eating them. $E_0$ is CO2 added from outside the modelled system.
If you pour water into a container with no exits, the water level increases forever. There is no equilibrium in which the level tails off to a constant, even though you’re still adding more water. Why do you assume there *has* to be an equilibrium?
I try not to assume motive without evidence.
I went through the business about labelling and whether decay is proportional to total concentration or the difference in concentrations previously. If decay is proportional to total concentration, you could only reach equilibrium when total concentration was zero.
I don’t consider anyone here to be disingenuous. Willis asked a sensible question, the answer to which I agree is not at all obvious. And I can quite see where you’re coming from with this.
a) You say “surely there is a natural rate E(t) > 0 that would maintain an equilibrium CO_2 concentration”. Why?
b) I agree CO2 doesn’t come with a label. But I’ve already explained that the partition is a mathematical artefact of the ratio of reservoir sizes, and that a portion does not get transferred because the level rises somewhat in the sink as a result of the transfer.
The case with three or more reservoirs is not intuitively clear, but it seems clear enough with two – that if the buckets are of equal size that only half the water dumped in one ends up in the other. They cannot all return to their previous level – where would the added water go to?
The probability of a CO2 molecule moving from A to B is proportional to the total CO2 concentration in A, but the probability of a molecule moving from B to A is proportional to the total concentration in B. The net flow from one to the other is proportional to the difference in concentrations.
“A derivation would be nice. I want to see precisely how you arrive at a sum of exponential functions each acting on a partial fraction of the additional CO_2, with a “permanent” residual.”
See my comments above regarding the equation dL/dt = ML and diagonalisation. The algebra is messy, but straightforward.
MikeG says:
May 7, 2012 at 1:31 am
“Declaring exponential constants to four significant figures is a triumph of optimism.”
Or, something. Agree completely.
richardscourtney says:
May 7, 2012 at 2:09 am
“This indicates the ‘adjusting carbon cycle’ assumption is plausible but, of course, it does not show it is ‘true’.”
Absolutely. The system is underdetermined and not fully observable. Thus, to get an answer, the analysts have to insert their own biases. The likelihood that they would hit on a faithful model, out of all the possibilities, is vanishingly small.
Nullius in Verba says:
May 7, 2012 at 2:45 am
“The matrix is of rank n-1, since we lose one degree of freedom from the conservation of mass. We therefore ought to get n-1 decaying exponentials for n reservoirs.”
The reservoirs themselves are a continuum. For example, what is the land reservoir? It is trees, grasslands, soil bacteria, rock and sediment formation, mammals, reptiles, amphibians, insects, etc… And, the dynamics of the atmosphere are diffusive. Areas of high and low concentration appear randomly, and the divergence increases near the surface sink. The eigevalues of the Laplacian operator are limitless. So, basically, you are correct, but n tends to infinity.
Gail Combs says:
May 7, 2012 at 6:06 am
My pretty little creek is now a large multi-acre swamp despite the power company having a guy trap over two hundred beaver in one year.
If you had dammed the creek to create a small pond for migrating waterfowl, the EPA would have forced you to tear down your dam (they have the backing of the DoJ) and fined you several thousand dollars for interfering with a watercourse and creating a potential health hazard. Because beavers built the dam, any action you might take (like accidentally dropping a stick of dynamite in the center of the dam) to assist the creek to return to it’s previous state would render you subject to horrendous fines for destroying a Giardia-filled wetland.
Just one more reason to gut the EPA…
[Formatting fixed. -w.]
rgbatduke says:
May 7, 2012 at 8:06 am
“There is no rate of addition of CO_2 that can lead to equilibrium with this solution but zero.”
Yes. As I have been saying, the model is mathematically, theoretically sound. But, they have parameterized it in such a way that it gives the answer they wanted, vastly underestimating the power of the sinks to draw out a substantial fraction of the atmospheric constituents in the near term. There is no data available to establish that the model is correct.
In fact, we know it is incorrect, for the very simple reason that temperature is driving the rate of CO2, and not the other way around. It is obvious in this plot that anthropogenic inputs have, at best, a minor role in establishing the overall concentration. Temperature variation accounts for almost all of it.
Nullius in Verba:
At May 7, 2012 at 9:16 am in relation to a ‘plumbing model’ you ask;
“The case with three or more reservoirs is not intuitively clear, but it seems clear enough with two – that if the buckets are of equal size that only half the water dumped in one ends up in the other. They cannot all return to their previous level – where would the added water go to?”
I answer:
It goes into a change in the volume(s) of the reservoirs.
In other words, the model is misconceived. Please see my above post at May 7, 2012 at 2:09 am and especially its addendum at May 7, 2012 at 2:44 am.
Richard
My Occamized Hypothesis is:
Geology and geogenesis put a sh**-load of CO2 into the early atmosphere. Eventually, life forms (flora) arose able to build themselves and proliferate by using photons to combine H2O and CO2. Shortly, eaters (fauna) evolved to munch on said flora. The flora expanded with little restraint and consumed CO2 until it began to run short. They then evolved to survive on less, but kept going. They are now approaching a lower limit, variously guesstimated to be in the region of 130-260 ppm — famine time. Fauna mass and volume and numbers track this, more or less.
So the “ideal number” is the lower limit, as that’s what the dominant life forms (flora) keep trying to achieve. Warmies are mental vegetables, so they also want to flirt forever with suicide by famine.
Simples!
So
A model valid over decades at this point in history, which is supported by the data, is:
dA/dt = -A/tau + k1*(T-To) + k2*H
A = atmospheric concentration anomaly
tau = time constant (could be operator theoretic, leading to a longer than simple exponential tail)
k1,k2 = proportionality constants (again, could be made operators)
To = equilibrium temperature
H = anthropogenic input
With tau relatively short and k2 not very large, the input from H would be attenuated rapidly. With k1 large, in the near term, the equation then becomes approximately
dA/dt := k1*(T-To)
which is what we see in the data.
richardscourtney says:
May 7, 2012 at 2:09 am
Richard, your paper is paywalled, so I fear I won’t be able to comment. That may be the reason your claims have gotten little traction, because you are referring to an unavailable citation.
All the best,
w.